- DOGE’s price remains bullish as price holds above $0.1
- Price remains strong as bulls dominate the market; the price aims for a rally toward $0.15
- DOGE’s price trades above the daily 50 and 200 Exponential Moving Averages (EMA)
The price action displayed by Dogecoin (DOGE) has been a show to watch, outperforming the likes of Ethereum (ETH) and Bitcoin (BTC) in recent days.
In the high timeframe, the price of Dogecoin (DOG) looks strong, with a probable result of an uptrend movement if the market remains optimistic.
Despite the relief bounce and uncertainty surrounding the crypto market, the FTX fiasco continues to act as a catalyst for the market to bottom out.
The Domino effect of the FTX saga and other large investors has stalled the market, as it has yet to make a significant move, raising concerns about the market’s direction. (Data from Binance)
Dogecoin (DOGE) Price Analysis On The Weekly Chart
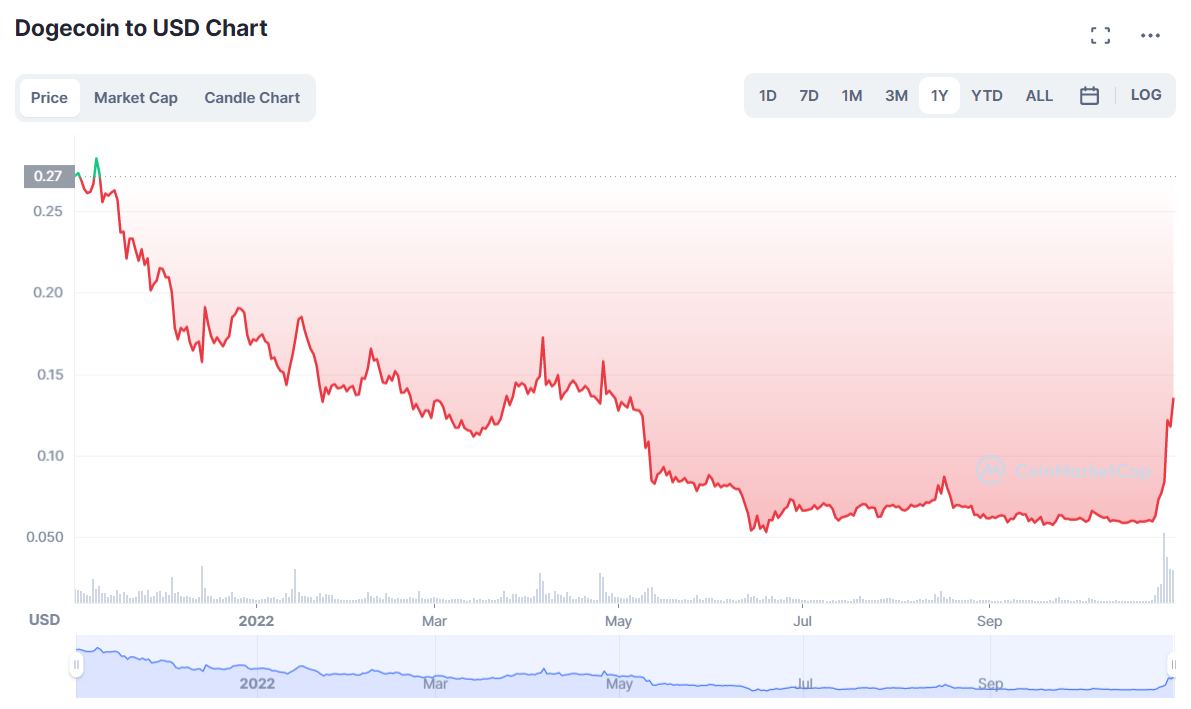
Despite the relief bounce across the market, with the price of DOGE rallying from a weekly low of $0.08 to a high of $0.104, the crypto market remains uncertain and turbulent, affecting the price of DOGE.
With so much news of a capitulation imminent for all crypto assets coupled with the FTX and other crypto projects suffering from bankruptcy, the bottom could be in soon.
DOGE’s price had a weekly close below a crucial area of $0.09 after showing so much strength rallying from a weekly low of $0.08 to a high of $0.088 as the price was unable to break above $0.15.
With the price of DOGE looking bullish on a low timeframe, the price could rally to a high of $0.15 if the market regains its relief bounce.
Weekly resistance for the price of DOGE – $0.15.
Weekly support for the price of DOGE – $0.09.
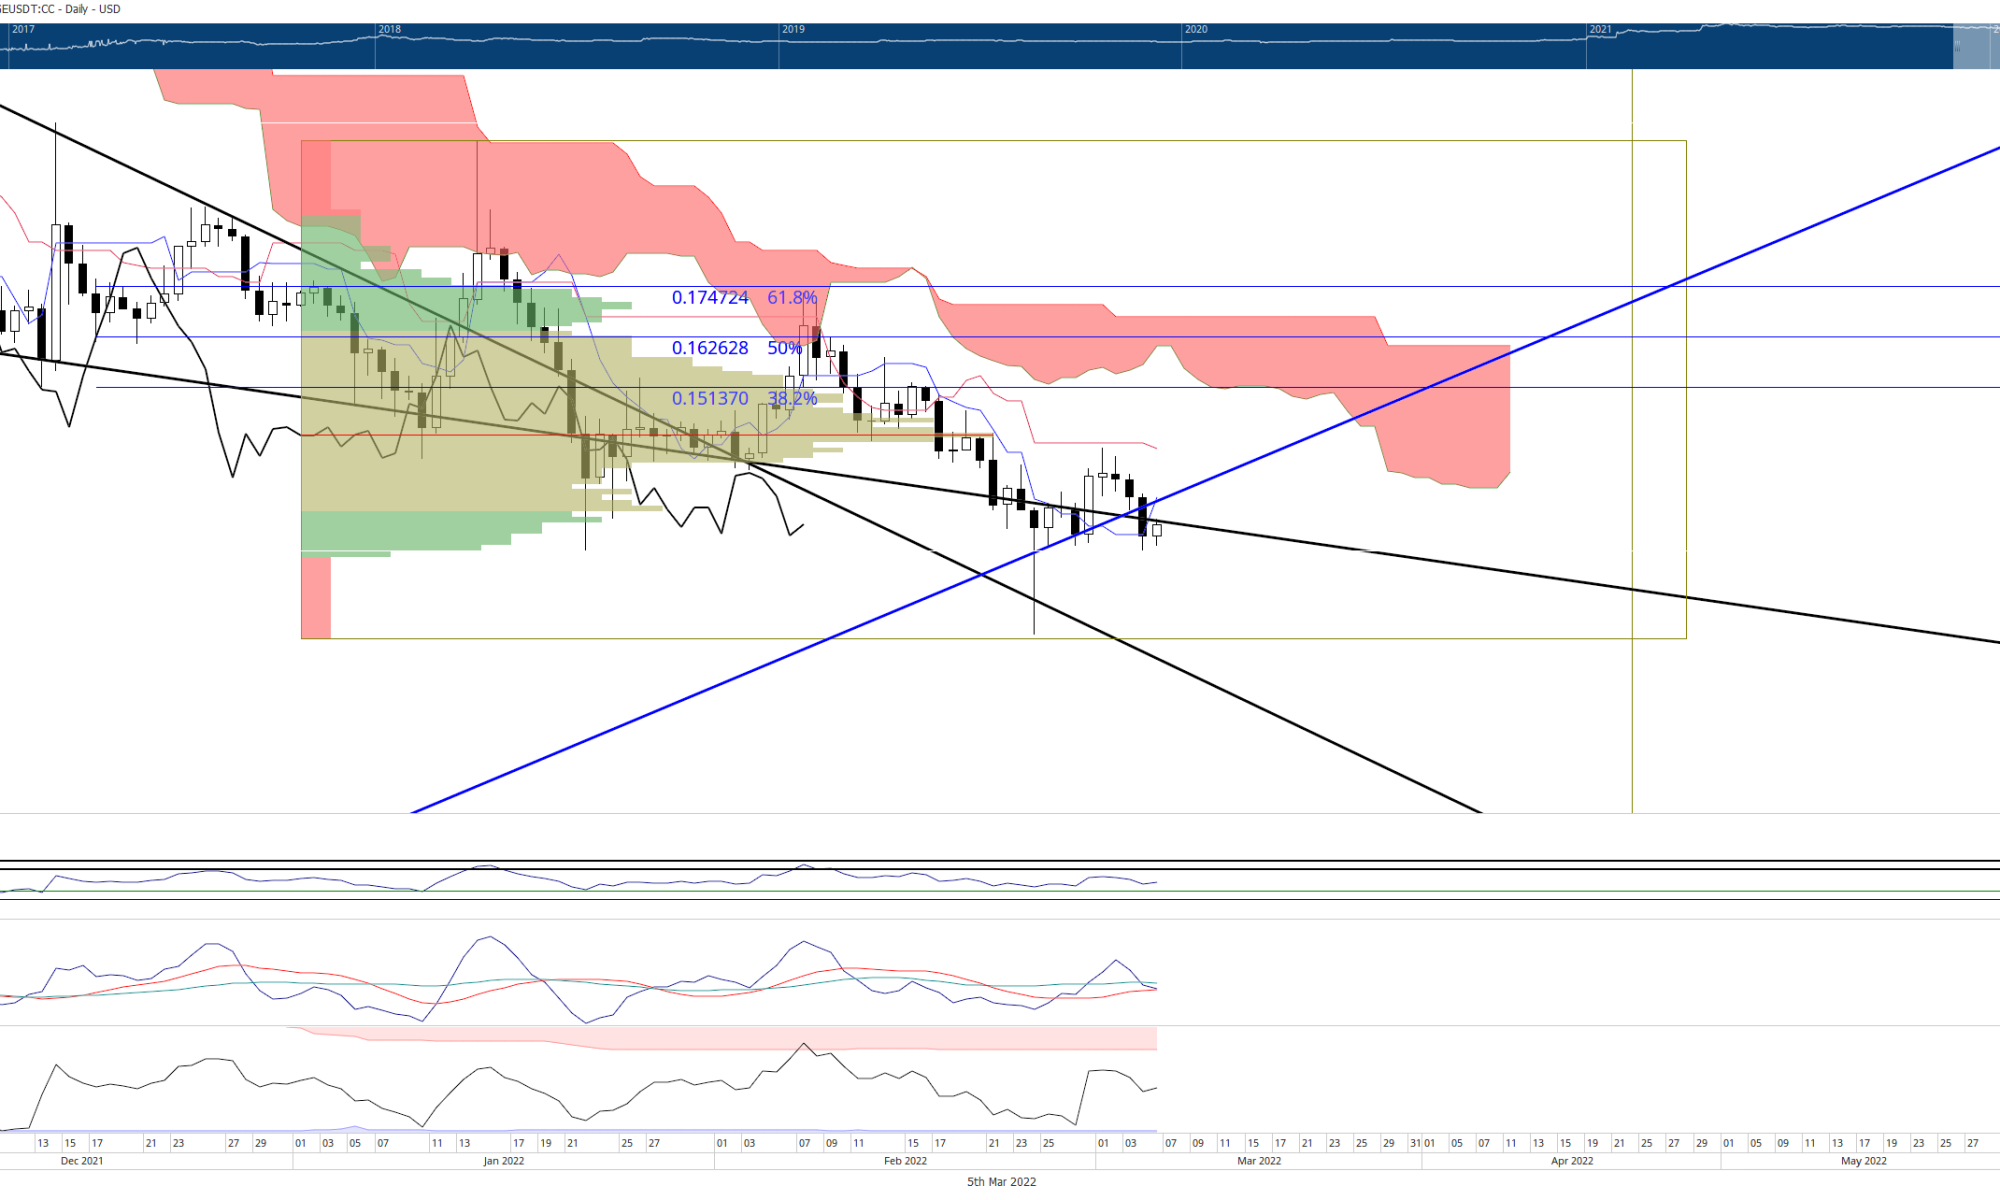
Price Analysis Of DOGE On The Daily (1D) Chart

The price of DOGE remains considerably strong in the daily timeframe after closing above $0.088. With DOGE’s price aiming to break past the region of $0.12, we could see more price rally to a high of $0.15.
DOGE’s price currently trades at $0.12 above the 50 and 200 EMA, supporting the price of DOGE from dropping lower to $0.09.
If the price of DOGE breaks and holds above the 38.2% Fibonacci level, we could see more price rally for DOGE price, signaling more buy orders and bulls in control.
If DOGE’s price fails to flip, the region of $0.11 corresponds to 50% of the Fib value; we could see the price retesting $0.1 or lower depending on market sentiment.
Daily resistance for the DOGE price – $0.12.
Daily support for the DOGE price – $0.09.
Featured Image From zipmex, Charts From Tradingview