Aave Price Action: Bearish Pull Forces AAVE To Resist Drop To $74 Level

AAVE has been showing hints of recovery today which is quite the opposite of its figures a few hours ago.

  • AAVE shows signs of recovery as price climbs by 7.35%
  • Coin generally bearish but the bulls are now attempting to take over
  • AAVE breaches $77.53 level

This could be due to the general crypto market recovering too as of press time. Will this be for long term?

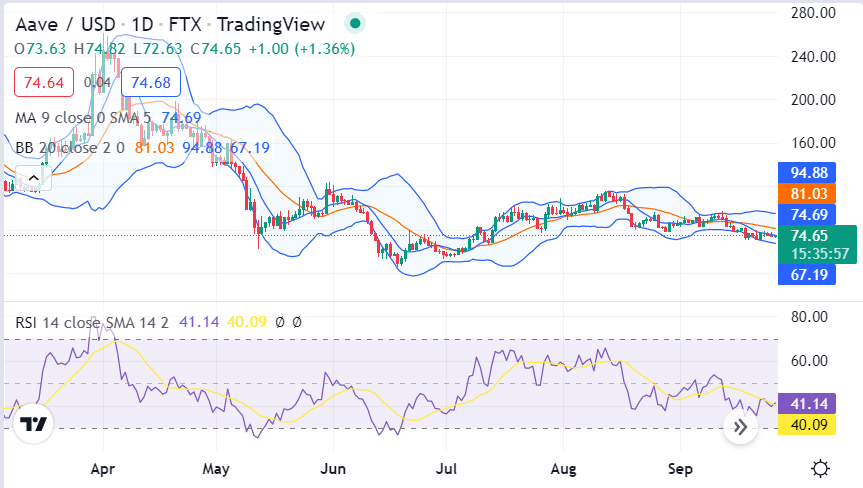
The coin has been generally bearish as it resist falling into the $74 level. Key support is now spotted at the $73.65 level and resistance is present at $77. 52.

Evidently, AAVE is seen to be moving downhill earlier as it failed miserably in breaching the $77.53 level. At this point AAVE is treading the bearish route for short term.

Judging by the 1-day price analysis, it is moving downwards as triggered by the uptick in selling pressure. If the selling pressure subsides, then AAVE price could shoot way up which is happening right now.

Chart: TradingView.com
AAVE Price Climbs By 7.35%

According to CoinMarketCap, the coin’s price has skyrocketed by 7.35% or trading at $79.64 as of press time which means it has successfully breached the $77.53 level that it has been trying to do so for the past couple of days.

The Bollinger Bands Indicator higher band is now seen at the $78.63 mark which is now the key resistance for AAVE while the lower band is seen at the $73.83 mark.

More so, RSI has previously manifested a decline to 40 but has shown recovery and is now looking more balanced.

The 4-hour price chart reveals that the bears have been dominant for many hours but the bulls are now taking over.

Previously, the sharp decline of AAVE has caused a devaluation of price down to the $73.22 level which has been a good sign to the sellers.

Price Likely To Build Momentum

AAVE price is seen to be generally bearish due to its sideways consolidation but is seeing an uptick now and making some room for the bulls.

The price has plummeted by $74.34 yesterday but it has now found its mojo and on its way to making more gains. Momentum will likely build up in the coming days.

At this point, AAVE is expected to continue trading in its current range for the next 24 hours.

However, the scenario with AAVE/USD still looks like a tug-of-war and anything can happen at this point as either the bears or the bulls can get exhausted and propel the coin to move either way in the coming days.

AAVE total market cap at $1.12 billion on the daily chart | Source: TradingView.com

Featured image from AMBCrypto, Chart: TradingView.com

PancakeSwap Watch: CAKE Trading Volume Spikes Over 50% In 24 Hours

PancakeSwap (CAKE), just like any other cryptocurrency, has had its share of ups and downs.

  • PancakeSwap registers over 53% increase in 24-hour trading volume
  • PancakeSwap among trending BNB projects today
  • CAKE’s next resistance level could be at $5

Just two months after it was launched on September 2020, the token hit its all-time low to date. Back then, it was trading at just merely $0.19.

Today, a quick glance of data provided by CoinGecko shows the 68th ranked crypto by market capitalization trading at $4.80. It is way below its $43.96-all-time high that was attained on April 30, 2021.

CAKE might have lost 89% of that impressive trading value, but that does not necessarily mean the token is not commanding strong interest among traders.

If anything, current data shows Christmas came early for the digital asset.

PancakeSwap Outperforms Many Cryptocurrencies

The crypto market is continuing to deal with bearish conditions, but CAKE was able to pull off an impressive feat – close the day and the week in green and outperform many of its competition.

Over the last seven days, the governance token of PancakeSwap was able to increase its value by 9.4% and is one of the few digital assets to be “on the green” in today’s market.

Source: CoinGecko

Its price recovery is not the only thing that is impressive about CAKE right now. Its 24-hour trading volume is also standing mighty strong.

In fact, there was a 52% increase in the token’s trading volume, even reaching over $55 million before slightly reverting to above $51 million at the time of this writing.

Even with that, PancakeSwap has shown some impressive leaps for the past week.

Will The Token Sell Like Real Pancakes?

If its most recent trading volume is any kind of indication, the digital currency, by the looks of it, actually sold like pancakes.

After all, high trade volumes often denote “high retail excitement” and in crypto space, this might work wonders for an asset’s price.

Over the past week, CAKE placed high on the watch list of crypto investors and is among the trending BNB projects.

The PancakeSwap bulls, though, needs to capitalize on this momentum in order to sustain price level of above $4.50 as this will lead to $5 as the next resistance level.

If the pressure for buyers remains strong, CAKE’s short-term trajectory could be a sweet one.

CAKE total market cap at $676 million on the daily chart | Source: TradingView.com

Featured image from Cryptopolitan, Chart: TradingView.com

Uniswap Price Watch: UNI Registers 16% Rally In Last 7 Days

Uniswap (UNI) token holders have plenty of reasons to celebrate now.

  • Uniswap is among the top gainers among cryptocurrencies, registering a 16.2% price increase over the past week
  • The token is now on a falling channel pattern but is expected to make a bullish run
  • Lowest possible support price for Uniswap is $4.8

The digital asset is one of the biggest gainers not only for the last 24 hours, but for the past seven days.

As of this writing, tracking from CoinGecko shows the token is trading at $6.37, enjoying a 12.5% gain in value since same time yesterday and a 16.2% increase for the past week.

Unlike the rest of the crypto pack, the Uniswap token seems to be keeping its head above water during this period of uncertainty and volatility for the digital assets space.

This seems a rather odd development, considering the token was stuck in a steady decline during the past five weeks.

It also makes it a bit difficult to assess whether or not the crypto is under any kind of pressure.

Some experts feel it is.

Uniswap On A Falling Channel Pattern

The five weeks that was mentioned earlier when Uniswap token was on a decline isn’t just a simple “period of red” for the crypto.

It was a falling channel pattern which is characterized by a bullish rally following the breaking of the overhead trend line.

Source: TradingView

While the token is enjoying significant gains with its current trading price, there is no clear guarantee that the anticipated bullish trend is already happening.

What is clear though is that 70% of all the gains the Uniswap token have made during its last recovery rally was obliterated by the recent crypto market correction.

It has put the cryptocurrency in a position where local support price stood at $5.27.

Where Is Uniswap Token Headed?

As of this writing, data indicate that Uniswap token’s hourly trading is on a small range. If the trend continues, there could be strong movement on its price on the coming days.

The crypto’s support range could consolidate at $5.00 to $4.8 while its resistance level could be seen to be from $6.9 to $8.1.

In crypto space, “support” refers to the level at which an asset’s price stops falling. “Resistance” refers to the range when an assets price stops increasing.

It is important to note that while a bullish rally can easily put Uniswap trading price to the $7 mark, the token is also at risk of hitting a price range below $5.

With that, it is now a waiting game for interested buyers who should keep a sharp eye for the pattern breakout.

UNI total market cap at $4.9 billion on the daily chart | Source: TradingView.com

Featured image from Cointribune, Chart: TradingView.com

ETH Struggles To Break Past $1,300 Resistance – Back To $1K?

ETH, post-merge, has taken traders and investors on a thrilling adventure. The value of Ethereum has decreased by a stunning 26.36 percent since the much-hyped Merge.

The token’s recovery from June to August was fully erased by this decrease and the market catastrophe on September 13.

Fears of a further decline for the token are palpable as the price struggles to break through the 61.80 Fib level, currently at $1,329, following the U.S. Federal Reserve’s interest rate hike announcement. This might indicate that prices will continue to fall.

ETH On A Downward Trajectory

There was a precipitous drop in ETH’s price from September 13-19, fairly dissimilar to the drop in May and June but far lower in magnitude.

The result is the same, though; a dramatic drop in investor trust in both the token and the ecosystem as a whole.

The ETH TVL hasn’t improved much after the switch to proof-of-stake. It fell from $34.63 billion to $30.38 billion between September 13th and 19th, the same time period as last year, which is a massive decline of 12.27%.

As of this writing, the price of the coin oscillates above and below the $1,300 area. This can be understood as a continual conflict between bulls and bears.

Additionally, ETH encountered a rejection wick earlier today, September 26. However, this bearish trend could be short-lived.

Likelihood Of A Positive Price Momentum

ETH has shown indicators of possible positive momentum on the micro and macro levels as of today. This can serve as a glimmer of optimism for ETH traders and investors.

The Stoch relative strength index has been increasing from oversold area. This indicates that the bulls are gathering momentum, which could propel ETH past the $1,300 price resistance.

ETH has already accomplished this on both the micro and macro scales as of this writing.

On the 1-hour chart, Ethereum bulls are currently attempting to consolidate their position above the indicated resistance in order to convert it into a support. he momentum indicator is trending upwards.

However, this is likely merely a tiny pump-in cost. As the price fell 4.04% between the end of September 25 and the beginning of September 26, traders may be buying the dip.

This price decline may give day traders with an investment opportunity.

ETH total market cap at $162 billion on the daily chart | Source: TradingView.com

Featured image from CryptoMode, Chart: TradingView.com

Polkadot Price Watch: What A Drop In This Key Area Can Mean For DOT?

OK

Polkadot (DOT) – which is seen to be on a winning streak in terms of social media metrics and development activity  – has been on a retreat recently.

  • DOT social media metrics nosedives 
  • Polkadot’s decline in developer activity could leave a bad taste in the mouth of investors
  • DOT’s NFT volume off to as high as 1.64 million on September 24

 Is this sudden drop in both metrics just a temporary hiccup or could be a warning signal to investors?

Judging by the chart below, DOT price was seen to have nosedived in terms of development activity in the past few days. It’s surprising as Polkadot has been outpacing other cryptocurrencies over the past week but seems to be losing steam now.

DOT Social Volume Down, Bearish Movement Looms

The reduction in terms of development activity hints at the lack of developers working on Github. Evidently, this lack of development activity could leave a negative impression on investors.

DOT’s social volume has capsized which could likely trigger an enhanced bearish movement. Notably, there is also a drop in DOT’s social media engagement in the past few days. The social metrics of Polkadot are seen to have nosedived by 12.6% as seen in the past month. More so, its weighted sentiment has also dropped below 0. These on-chain metrics show the increasingly negative sentiment circling DOT.

Despite DOT looking intensely bearish, the crypto has seen a massive improvement in terms of NFT. With that being said, DOT’s NFT volume has grown a lot from $364,250 as spotted on August 26 to as high as $1.64 million on September 24.

According to CoinMarketCap, DOT price has spiked by 4.17% or trading at $6.50 as of press time.

Chart: Santiment
Polkadot Collaborates With Tether, Others

Polkadot is also ramping up in terms of collaborations such as with Tether. On September 23, Tether announced that they will be rolling out USDT right on Polkadot. These collaborations are in pursuit of the legalization of DOT’s operations.

More so, Polkadot also recently adopted Chainlink allowing Polkadot projects to employ the data price feed of Chainlink. On the other hand, even if these collaborations are bound to fuel growth and scalability for DOT, still the price could go down in the short term.

On the brighter side, DOT’s declining volume which has dropped by 82.34% in the past week signifies that DOT’s price could be bound for immediate recovery.

DOT total market cap at $7.28 billion on the daily chart | Source: TradingView.com

Featured image from Cryptopolitan, Chart: TradingView.com

TRON Showing Hints Of A Major Rebound After A Week Of Rout

Tron (TRX) holders have been on rough terrain since August with the bears dominating the market. The tables might be turning though in favor of the bulls as shown on the charts. 

  • TRX bulls hint at a comeback after a long period of takeover by the bears
  • TRX price down by 0.87%
  • RSI divergence hints at increased investor optimism

According to CoinMarketCap, TRX’s price has plunged by 0.87% or trading at $0.0596 as of this writing. Apparently, Tron is trying to bounce back from its weekly low that registered at $0.056.

It seems that the token is still traversing in the same range which validates a strong rebound from that level. 

TRON Market Demand Waning?

Hence, there is evidently poor demand for TRX in the market which is normal whenever crypto tries to switch lanes from bearish to bullish. 

Whale activity looks to be insufficient at this point and not gaining enough traction. Regardless, the supply of TRX has increased for the whales.

There is hope as investor optimism ought to be amplified with the recent developments happening for Tron. 

Tron’s weighted sentiment index has shown no significant changes in the market. TRX is still stuck in its lower monthly range which explains the failed uptrend happening over the weekend.

On the other hand, there are a couple of signals that promise the possibility of the bulls pivoting in the coming days. 

TRX Bulls Waiting For The Next Big Wave

TRX price might prevail and rebound from the support zone as further validated by its RSI. The RSI divergence shows increased optimism that the price may escalate in terms of buying pressure.

On-chain metrics for Tron also feature the increase in demand over the derivatives markets as seen in the past couple of days. 

Chart: TradingView.com

Observation of the funding rates provides critical data because it validates the change in the derivatives market. These observations are usually tied up to the spot market. 

While there are signals that hint at a bullish uptrend, the market sentiments reveal that the TRX bulls are on the sidelines and just waiting for the right timing to jump in when the crypto market improves. 

On TRX price predictions, although the stablecoin is making progress, it still continues to drop which could go on for the next couple of trading sessions. 

Tron’s price may hover below the $0.054 level before September ends. More so, there is also a possibility that TRX’s price could slide below the $0.045 range.

With the crypto market currently struggling, TRX prices could also move in the same direction. The bearish thesis will only be proven wrong if and when the price shoot above the $0.066 mark. 

TRX total market cap at $5.5 billion on the daily chart | Source: TradingView.com

Featured image from CCN.com, Chart: TradingView.com

Algorand: ALGO Price All Go With Nearly 30% Rally In Last 7 Days

In only the past week, ALGO has grown by a whopping 30%. Some may not be surprised by this development, as Algorand collaborated with FIFA to create FIFA+ Collect, a platform where fans can buy digital collectibles in the form of NFTs. There has been a dramatic impact on the environment as a result of this alliance.

A tweet from @intotheblack shows that the number of unique addresses that have completed their first transaction for ALGO has increased from 5,000 to 20,000.

There has been an increase in the cost of ALGO because to the increased number of transactions using unique addresses. As of this writing, the price of one coin is somewhere between the 23.60 and 38.20 Fibonacci retracement levels, or about $0.3949 and $0.3724.

There is no denying the ripple impact that this collaboration has on all of Algorand. But will the agreement lead to additional price increases, or is this simply a temporary boost?

Image: NFTgators
ALGO Gets Boost From FIFA+ Collect

The price of ALGO increased by 31.18% in a matter of hours on the press day of the FIFA+ Collect release. To sum up, the coin is up 27.54% from September 22nd when trading began till today, September 26th.

As of this writing, ALGO is trading at $0.3662, down 5.8 percent in the last 24 hours, data from Coingecko show, Monday

Information provided by Santiment suggests that the cooperation has an impact beyond only the pricing.

Algorand’s NFT sector has witnessed a dramatic increase in activity. From September 21 to September 22, the total volume of NFT trades surged from $186,000 to a staggering $606,000.

This is not the only positive development for the ALGO token and the Algorand ecosystem in general.

The TVL of ALGO observed an increase in staked tokens. From September 22-24, the TVL increased from $234 million to $263.69 million. The Algorand ecosystem also had a significant overhaul.

Additionally, the ecosystem implemented the State Proof procedure. This version provides an additional layer of protection against quantum threats and enables the development of “decentralized bridges” to connect Algorand to other blockchains.

ALGO Bullish Momentum Subsiding?

At the time of writing, the coin’s price has already reached above the double-bottom support level at $0.3687.

This may indicate that the bullish momentum has waned and the bears are currently taking the driver’s seat.

Considering this, ALGO can fall to a relatively secure position near the 50 Fib level. This level will serve as the token’s support. However, it cannot fall below the indicated Fibonacci level, as this would indicate a bottom on September 22.

ALGO total market cap at $2.25 billion on the daily chart | Source: TradingView.com

Featured image from Forkast, Chart: TradingView.com

Litecoin Price Watch: Why Only 15% of LTC Holders Are Making Profit

Litecoin has made it to the list of the best altcoins to buy in 2022. But for the past 24 hours, the crypto has fallen prey to the volatility that is currently wrecking havoc in crypto space.

As of this writing, Litecoin (LTC) is trading at $52.43, down nearly 1.1 percent in the last seven days, and losing 2.5 percent in the last 24 hours, data from Coingecko show, Monday.

At a glance, it can be said that LTC is on the same boat with Ethereum, the world’s second biggest crypto by market cap.

But when taking into consideration the percentage of its holders that are making profit, a great disparity can be seen.

Litecoin Holders In Tough Spot, Profit-Wise

TipRanks, an online data provider, revealed on September 25 that only 15% of the total holders of Litecoin are making profit and 12% are on status quo, leaving 74% dealing with tremendous losses. This was before the altcoin started to hit below the $53 mark.

In comparison, Ethereum is doing better than its fellow digital coin. Data shows 51% of its holders are in profit while 46% incurred losses. The remaining 3% are breaking even.

The huge difference between the percentages of holders of the two altcoins enjoying profit is not much of a surprise as Ethereum is pushing for a bullish streak following the initiatives to improve its network.

Litecoin, on the other hand, was left to deal with momentum-derailing losses.

Network’s Stagnant State Causing LTC Decline

Litecoin’s network has little to no activity at all and that is one of the reasons why it is failing to catch up with the likes of Ethereum.

With its stagnant state, Litecoin is forced into a bearish outlook along with the majority of the cryptocurrency market.

Over the past weeks, the crypto space continued to bleed and that trend is still continuing up to this date.

Ethereum, meanwhile, despite showing some struggle to maintain trading price of $1,500, is the subject of excitement of the crypto community as it recently transitioned into proof-of-stake (PoS) mechanism with what the space is calling “The Merge.”

While the historic event failed to deliver the rally that was expected of the king of all altcoins, it gave holders and investors something to look forward to.

LTC total market cap at $3.7 billion on the daily chart | Source: TradingView.com

Featured image from Cryptotelegram, chart from TradingView.com

Shiba Inu Adds Nearly 36,000 Holders Since June Despite Crypto Market Turmoil

The price trend of Shiba Inu has been following the rest of the cryptocurrency market and remains negative. Notably, SHIB is still seeking to reclaim the high points it reached last year, when the value and popularity of the meme coin surged.

As of this writing, SHIB is trading at $0.00001145, down 4.5% in the last seven days, data from Coingecko show, Sunday.

Despite the crypto market’s sluggish condition, a portion of the dog-themed coin’s investors are optimistic that the asset will recover and are boosting their coin purchases while ignoring the market’s weakness.

According to data from CoinMarketCap, as of September 24, SHIB has 1,226,031 holding addresses, representing an increase of around 35,835 new holdings over the course of three months. The new holders represent a 3% increase from the 1,190,195 who were registered on June 26.

Shiba Inu: Increasing Use Case

In addition to the prospect that new SHIB holders may wager on the coin’s appreciation, investors are likely drawn by SHIB’s rising utility. It is worth mentioning that interest in meme-based cryptocurrencies waned as a result of unfavorable publicity around the coins’ supposed lack of utility.

Since June, Shiba Inu’s value has been on a roller-coaster ride, but the price has mostly remained low. The coin’s three-month high price was $0.000017 on August 15, and as of the time of writing, it had gained about 5% in the last 24 hours.

Previously, the majority of retail investors liquidated around the price and then sought entry points as the memetoken approached $0.00001.

Due to the massive concentration of tokens in the hands of small and medium-sized whales, Shiba Inu faces a significant increase in selling pressure whenever it succeeds to breach past local resistance barriers.

Holding On To The Meme Coin

Meanwhile, around 30% of SHIB investors have held the asset for more than a year, according to statistics from Into The Block. Despite the ongoing bear market, investors have generally abstained from disposing of their coins.

These holders are fostering a bullish mood among investors while aiming to eliminate SHIB as a quick-profit asset.

As of the time of writing, the trading volume of Shiba Inu is still declining, hence the token’s volatility remains high. The decline in trade volume is unfavorable for a coin that heavily depends on speculative appeal.

As the number of SHIB holders increases, it appears that interest in the coin is waning. Google Trends data indicates that global searches for the keyword “Shiba Inu” decreased to their lowest level in the past 12 months, suggesting that SHIB could be losing its most avid fans.

SHIB total market cap at $6.27 billion on the daily chart | Source: TradingView.com

Featured image from Daily Pets Care, chart from TradingView.com

Can WAVES Flow Back From Its Low Ebb And Reclaim $4.6?

The month of September for WAVES didn’t look good as the coin registered a sharp downward pattern. The market is looking bearish as WAVES slipped below the key $4.6 level.

  • Crypto market looking bearish for WAVES
  •  WAVES key support retests the $4.3 zone
  • OBV shows a weakening in selling volume

Bitcoin, the king of crypto, climbed to $19.8K, forcing the retreat of the bears and allowing the bulls to recharge.

In the event that Bitcoin nosedives lower than $19K, this could inevitably pull the other cryptocurrencies down with it.

On the other hand, WAVES has shown some improvement as it dashes above the $4 zone in the last two days.  

Waves is a multi-purpose blockchain platform which supports different types of use cases including decentralized applications and smart contracts.

The blockchain platform’s native token is WAVES, an uncapped supply coin used for payments such as block rewards.

$4.3 Revisited As Key Resistance Zone

Based on the 4-hour chart, WAVES was able to recover and jump to the $4.3 level following its recent correction.

In the next days, WAVES price is seen to bounce back in the $4.5-$4.6 range. A couple of days ago, the key support found at $4.3 have been revisited as a key resistance zone.

Source: TradingView.com

Earlier, its price has once again dropped below the $4 range. On the 1-hour chart, it retreated once again or back to the $4.3 level following its latest setback.

The price on the higher timeframes is seen to be massively bearish than bullish. Additionally, the market is now leaning toward the sellers as noted in the past few weeks.

WAVES was aiming to hit the $4.3 mark a few days ago but was barred and pushed towards the $3.9 mark instead.

With that being said, going long in the $4.02 support level wouldn’t be a wise move, especially with the risks involved.

With the token unable to clutch strongly on the $4 zone, this led to the bears gaining enough traction to dominate. Additionally, a selling opportunity is predicted to occur once a retest is done on the $4 mark.

WAVES RSI Falls Below 50

According to CoinMarketCap, WAVES price is up by 2.53% or trading at $4.01 as of press time.

The Fibonacci retracement levels at the $4.0 and $4.09 range can hinder the buyers’ intent to press on the gas in terms of prices.

The token’s relative strength index is seen to have traversed below 50 further strengthening the validation of bearish momentum.

Also, the CMF is seen to have dropped beneath the -0.06 level showing the rapid loss of capital. In terms of On Balance Volume, the token seems to signify weakened selling as seen in the past few days. More so, the OBV also shows that there is no indication of a sharp pullback.

The price is seen to have plunged below the $4 mark. It was seen to pause at the $3.94 level which means a retest at the $4 mark could tick off a selling opportunity.

Crypto total market cap at $902 billion on the daily chart | Source: TradingView.com

Featured image from The Coin Republic, Chart: TradingView.com

(The analysis represents the author’s personal views and should not be construed as investment advice).

Dogecoin (DOGE) On Top Of Whales Menu – Here’s Why

There has been a massive sell-off in the cryptocurrency market, and during this period, whales have been focusing on Dogecoin (DOGE) and the general negative attitude in the cryptocurrency industry.

There was a 5.34 percent increase in the number of addresses owning between 100 million and 1 billion DOGE, as revealed by @bull bnb.

For Dogecoin, the percentage of wallets with between 100 million and one billion Dogecoin has grown by 5.13 percent in the last week. About six additional whales have joined the network, bringing in an additional 620 million DOGE.

In light of this, @bull bnb recently tweeted, “I’m about to scoop a fresh brand new bag of #DOGE.”

Recent whale activity has come as a huge surprise to DOGE holders and investors. What, then, compelled the whales to seek out DOGE?

Is This The Time To Purchase The dip?

As you may be aware, the present market climate is extremely negative for cryptocurrencies. Fear sparked by the CPI report’s release and the U.S. Federal Reserve’s interest rate hike triggered a widespread selling off in the stock and cryptocurrency markets.

The USD followed this decline. At the time of publication, the memecoin has fallen 9.94 percent from its September 12 peak. Even if DOGE showed signals of bullishness, it was not enough to prevent a 9.56 percent decline on September 18.

This decline may have prompted whales to seek accumulation rather than selling their DOGE supply. Now that whale activity has increased, what does this signify for DOGE?

Dogecoin Bullish Behavior 

DOGE’s bullishness came as a surprise as the cryptocurrency market continues to decline, particularly Bitcoin and Ethereum.

This increase in price can be ascribed to the whales’ recent buying binge in DOGE. A As at the time of writing, DOGE was trading at $0.066041, up 9.4% in the last seven days, data from Coingecko show.

This implies that the memecoin is leading the crypto market, giving the entire crypto market hope that respite is on the horizon. But investors and traders must ask whether this is really a flash in the pan or a persistent bull trend.

As of the time of writing, the token’s resistance level was tested at the 0% Fib level. This was answered with a lengthy wick of rejection, followed by a red candle. This could be the beginning of a short corrective period for DOGE, which will result in a slight price decline.

In the coming days, we can anticipate receiving additional information.

DOGE total market cap at $8.7 billion on the daily chart | Source: TradingView.com

Featured image from Cryptory, Chart: TradingView.com

How XRP Pulled Off A 33% Rally Over The Past 7 Days

Ripple (XRP) price has registered an impressive 33% advance above the key resistance zone as seen in the past week.

  •         XRP notably spikes by 10% on September 22
  •         Ripple confident to win legal feud against SEC

The token also skyrocketed 10% as seen on September 22, as the crypto market plunged in a sea of red.

Although a bit of improvement with Bitcoin raking up gains by 4.9% and Ethereum spiking by 7.3%, XRP was still leading that day.

According to CoinMarketCap, XRP price is up by 4.47% or trading at $0.5051 as of this writing.

Update On Legal Feud With SEC Raises Investor Optimism

XRP price demonstrates a surge of over 45% as seen since August. Reportedly, Ripple Labs has recently filed a motion for summary judgment on September 18 which involves allowing the court to wrap it up and make a final decision based on the facts presented in line with whether XRP is to be considered a security.

The recent update on the legal proceedings has stirred some optimism and pumped up investor sentiment regarding the long-term haul of XRP. More so, the open interest of XRP has notably improved as it has increased to $575 million from just $310 million in the past week.

Traders who are looking to get in should wait for the 200-day EMA set at $0.48 to see if it would swing to support in the coming days.

As of press time, XRP’s total market capitalization is at $25.14 billion as it climbed by $3 billion the previous day.

Image: CoinMarketCap
XRP Seen With Strong Bullish Strides

On the daily chart, the XRP price is noted to have bounced back after it dropped and is now enjoying a bull run. The bulls are targeting to breach the key resistance spotted at $0.4306 and once this is done, XRP could shoot for $0.49 next.

Amid the optimism shown by XRP, a breach targeted at the key support zone of $0.392 will reveal signs of buyer weakness. More so, this will also invalidate the bullish thesis and give the power back to the bears. If this happens, the XRP price could plunge and revisit the key support zone at $0.38.

XRP is seen to move with strong strides despite the hurdles experienced by the broader crypto market. The bullish streak is associated with the robust developments happening in the legal battle between Ripple and SEC.

Although both SEC and Ripple agreed to a summary judgment, Ripple seems to be more confident that they’ll win following several tweets by Stuart Alderoty, Ripple’s legal counsel, saying that SEC wasn’t able to satiate the Howey Test set by the Supreme Court. The Howey Test helps regulators assess and categorize an asset as a security.

More so, Brad Garlinghouse, Ripple CEO, firmly believes that SEC may not be keen on abiding by the law but would want to remake it.

XRP total market cap at $24.3 billion on the daily chart | Source: TradingView.com

Featured image from Crypto Daily, Chart: TradingView.com

Polkadot Suffers 10% Weekly Loss On Hawkish Fed – Time To Buy DOT?

To shed light on the protocol’s successes, Polkadot insiders have been providing key data. As it stands, these accomplishments are very helpful to the overall ‘well-being’ of DOT. However, the coin’s value has been down alongside the rest of the crypto and financial market.

Is this downturn going to be a great chance to buy for investors?

Markets are under intense selling pressure. The worry that the year-on-year inflation news on September 13 caused is still with us today.

The overall market cap for DOT fell by 15.3 percent, from $8.75 billion to $7.44 billion. Polkadot has shed 10% weekly loss on the heels of the U.S. central bank’s not so rosy inflation assessment. As of this writing, DOT is trading at $6.33, down 8.6 percent in the last seven days, data from Coingecko show.

These figures are not the only ones affecting market prices. Inevitably, the current interest rate hike of 0.75 percent by the Federal Reserve is seen to have a negative effect on the pricing. If things get much worse, this will have a negative impact on the value of DOT.

How Soon Will The Price Rally Occur?

Is there any way for DOT to recover quickly despite the general gloom in the financial markets?

If one looks at the daily tick indicators, one can see that DOT has been met with resistance around the $8.06 mark.

The price drop on September 13th is consistent with this. Once again, the price was rejected after reaching the $7.07 price resistance, sending it tumbling to the $6.12 support level.

Here’s Where Polkadot Rally May Be Seen

Indicators have suggested that the $6.12 support is generating positive momentum. Any significant momentum generated during this period can help the bulls break past the $7.07 resistance level.

The increasing optimistic forecast may suggest that Polkadot’s recent accomplishments are influencing investor confidence.

Chart: TradingView.com

The positive reversal on indicators aligns with recent tweets from @PolkadotInsider. The amount of investment projects on the protocol is one of Polkadot’s ecosystem’s most remarkable achievements.

DFG Global led the list with 52 projects, followed by AU21 Capital with 39 and Hypersphere with 35.

This tweet was recently published on September 22. Following this, the price rose to a $6.44 high close. As of this writing, it appears that DOT is preparing a relief rally.

Upon detailed examination of the data, the token’s last settlement occurred at $6.48, its previous peak. This growing trend is reflected in the sentiment of investors.

Together, the momentum indicator, the commodities channel index, and the Stoch RSI are currently rising. This inclining behavior suggests that investor sentiment is rather upbeat, even in volatile circumstances such as the present.

DOT’s prior market activity likewise matched the XABCD harmonic pattern, which can advise investors and traders to buy the dip.

DOT total market cap at $6.9 billion on the daily chart | Source: TradingView.com

Featured image from The Daily Hodl, Chart: TradingView.com

Shiba Inu Eternity Update Awaited – Will This Lift SHIB’s Price?

There may be a Shiba Inu (SHIB) rally coming soon.

Recent events have sparked widespread interest in the Shiba Inu project and its native cryptocurrency. On Thursday, the company’s founder and chief programmer, Shytoshi Kusama, informed the SHIB Army that the company’s development team is working on a burn mechanism that will have implications for the entire Shiba Inu ecosystem.

SHIB holders can’t help but be giddy about the future, what with the community’s official Twitter account teasing yet another major update.

Shiba Inu ‘Eternity’ Excitement  

A lot has happened since the Australian release of Shiba Eternity. All of this excitement and eagerness is only heightened by the latest statement made by the official account tweet.

The Shiba Inu team just announced via the Twitter Space Event “Shiba Eternity Community Update” the official date for the global debut of the Shiba Inu Collectible Card Game.

According to the announcement, Shiba Eternity will launch on October 1. The Shiba Inu Community will celebrate the release as “Download Day” while simultaneously breaking the Android and iOS App Stores.

There was consequently a lot of excitement about the coin and the overall ecosystem.

There is additional good news for the ecosystem. As of this writing, the development team is still putting the last touches to Shibarium, the upcoming update that is anticipated to debut on or about September 30.

That Much-Needed Scalability

Supposedly, this upgrade will provide scalability to the Shiba Inu ecosystem and cut gas expenses for everyone, particularly on the gaming side.

Will this, however, be sufficient for the coin to rally?

Currently, the coin’s value is between $0.000000957 and $0.00001230. This indicates that the currency is trading within its June price range, which is a less favorable period for cryptocurrencies.

Chart: TradingView.com

This decline in price, which followed a progressive climb from June to August, is the result of larger market factors.

The recent 0.75 percent increase in interest rates and the news of worsening year-over-year inflation caused investors and traders to feel dread. The price decreased by a stunning 25.06 percent from its latest peak on September 10.

SHIB Seen Rising To The Occasion

Nevertheless, it has risen to the $0.00001038 price range from its bottom on September 21. This range of prices will support the token’s expected relief rally.

The last decline at $0.00001192 represents the resistance. This level is critical since bulls can easily exploit any breakthroughs towards the 78.60 Fib level.

Due to the fact that the SHIB token is based on Ethereum, its value might be affected by the Ethereum ecosystem. The current market conditions can magnify the coin’s volatility that may lead to a crash.

If the larger financial markets rebound from the decline on September 13, we can anticipate SHIB to ride the tide of recovery.

SHIB total market cap at $5.8 billion on the daily chart | Source: TradingView.com

Featured image from Coin Culture, Chart: TradingView.com

Will Polkadot Network Progress Give An Ailing DOT Renewed Vigor?

Polkadot has proven successful in a number of areas recently. Data from Santiment shows that there has been a dramatic increase in development on Polkadot.

But does this mean a brighter future for Polkadot? Data shows that the highest amount of transfers occurred on September 16.

In addition, there’s even better news. Parallel chaining is likewise very active. The volume of transactions using these secondary chains on the Polkadot main chain is an indicator of this action.

The GLMR token from Moonbeam and the MOVR token from Moonrivers are two of the most well-known.

Chart: TradingView.com

Polkadot Investors Up In Numbers

Investments on Polkadot are also at an all-time high, with DFG coming in first place with 52 active projects.

While these claims certainly sound promising, how will they impact DOT’s market presence? The coin’s performance on the market has improved, thanks to recent changes.

Investor confidence in Polkadot’s ecosystem and native token DOT can increase if the crypto market recovers with the broader financial markets.

Both the DeFi and the more conventional financial markets are experiencing unfavorable market circumstances that make price changes unlikely. The recent increase in interest rates by 0.75 percent exacerbates the already intense selling pressure.

DOT Challenged By Adverse Market Conditions

Fear caused by recent CPI data is still evident on the charts as bears continue to test the lower part of the Donchian channel. Even though bulls are attempting to gain momentum, adverse market conditions continue to outweigh them.

DOT is trading at $6.48 as of this writing, down 6.5 percent in the last seven days, data from Coingecko show. However, DOT is expected to receive excellent news from the charts.

The critical support at $6.04 has slowed the price’s precipitous decline. It bolsters the strengthening bullish trend, which is more evident on the 4-hour to 1-hour tick indicators.

The price has settled between $6.04 and $6.83 near the center channel. After a sharp rejection candle at the opening of today’s trading session, the bulls may be able to penetrate and consolidate above the immediate resistance level of $6.57 if there is less volatility around these price levels.

The current price movement according to the XABCD harmonic pattern indicates that investors and traders should buy the dip, so propelling the price into an uptrend.

DOT total market cap at $7.15 billion on the daily chart | Source: TradingView.com

Featured image from VOI.id, chart from TradingView.com

What Ethereum Can Bring On The Table For ETH Investors In Q4

As expected, Ethereum has been doing poorly since the much-touted Merge event. This was a groundbreaking moment for the crypto industry.

Although the Merge was anticipated to boost investor confidence, it occurred at the worst possible time.

The Merge took place at an interesting point in crypto history. The update went up on September 15—just two days after the United States CPI data was made public.

There was a widespread selloff in the stock markets because of the Federal Reserve’s interest rate increase, reporting its annual inflation rate hike of 0.1%, and affecting the cryptocurrency market.

On the day of publication, Bitcoin dropped 12.71 percent, and Ethereum fell 12.67 percent. The timing of the Merge’s launch was a last-ditch effort to maintain or perhaps boost investors’ trust. However, that did not actually occur.

Ethereum (ETH) Price Down 21%

When everything was said and done, the Ether’s price had dropped by 21.1% compared to its 7-day moving average, as measured by CoinGecko. But @CryptoGucci, a Twitter user, disputes this.

One Twitter user explained why the recent price decline shouldn’t be worrying. The increasing prevalence of Ethereum validators on the blockchain is a prime example.

This increase in validators can improve the Ethereum blockchain’s overall efficiency.

Additionally, the state of Colorado has accepted ETH as a payment method through PayPal. However, this payment method is exclusive to personal PayPal accounts and not commercial ones. Nonetheless, this will undoubtedly aid the adoption of the ETH ecosystem.

Is An ETH Recovery Imminent?

Recent data indicate that ETH is witnessing a positive price increase. After a near-freefall to $1,243, the price has rebounded and is currently trading between $1,221 and $1,323.

Multiple indicators also depict a strengthening bullish momentum. Since the decline to the critical support level, stochastic relative strength index (RSI) values have risen, indicating that investor confidence is rebounding after a dreadful few days.

But are new changes sufficient to halt the current 0.75 percent interest rate increase? As the cryptocurrency market closely mirrors the broader financial environment, the recent movements may be temporary.

Wall Street’s indices have declined by a few percentage points as of this writing, and this decline can have a significant impact on the cryptocurrency market. As the third fiscal quarter draws to a close, Ethereum may experience a slow but gradual comeback.

ETH total market cap at $163.7 billion on the daily chart | Source: TradingView.com

Featured image from CryptoMode, Chart: TradingView.com
(The analysis represents the author’s personal views and should not be construed as investment advice).

Polygon (MATIC) Downward Trajectory Faces Resistance At $0.94 Level

Even with the encouraging reports of Polygon closing agreements and becoming one of the most acquired tokens by ETH whales, the future of its native token, MATIC, is not looking very bright.

From September 13 onward, it fell in line with the rest of the cryptocurrency market. The 7–12 September rise was ultimately denied by bears at the $0.9403 resistance area.

With the same 5-day time frame since then, the token’s value has plummeted by a staggering 20.65 percent. At the time of writing, the token’s price was hovering around the 78.60 Fibonacci retracement level, between $0.6898 and $0.7770.

Traders should keep an eye on both the 61.80 Fib level (now at $0.6989) and the 0.7185 support level. These two factors have counteracted the downward trend and given the upward momentum at the hourly marks some much-needed support.

Chart: TradingView.com
Polygon Bullish Momentum Hints At Demand

Also, bullish momentum appears to be building around the 1-hour time frame. Increases in the Stoch RSI value indicate that demand for the cryptocurrency is increasing.

In addition, the momentum indicator shows that the trend is rising. A larger amount of momentum produced here, though, can have a major impact on the wider picture.

This minor rising trend may be attributable to the expanding development activities in the Polygon chain.  This increase in development activity may indicate that the team is integrating new features or patching existing ones, according to a recent analysis.

This further increases investor and trader confidence. As the crypto market recovers after the 13 September sell-off, however, the recently announced partnership between Polygon and Flipkart may accelerate the acceptance of MATIC and contribute to the expansion of the Polygon ecosystem.

MATIC Price: Potential Buy Pressure 

In light of this, might recent advancements at Polygon inspire confidence? Indeed, it accomplished exactly that. However, recent advancements were not the primary cause of the price increase.

As the price declined, the indications also pointed to a strong buy signal. The bull-bear indicator reveals the same information. As bulls gain momentum, the Stoch RSI will also rise, indicating a major increase in buy pressure.

This may have an effect on MATIC’s total recuperation. If the bulls are able to stabilize at the 71.80 Fibonacci level, another bullish rise may be conceivable to support the price’s upward momentum.

The price range of $0.7395 represents the primary level of resistance on this chart. If the bulls gain pace and break through this level of resistance, the MATIC token could be on the verge of a recovery.

MATIC total market cap at $5.9 billion on the daily chart | Source: TradingView.com

Featured image from Coincu News, Chart: TradingView.com

Aave (AAVE) Attracting Whales Over Past Few Months – Will It Spur Price Rally?

The number of “whale” addresses in AAVE has recently increased. Whale addresses are digital currency addresses that store 1 million or more of a particular coin. AAVE is currently riding a wave of whale-like popularity.

AAVE is currently riding a wave of whale-like popularity. A 55 percent of the AAVE coins are held by addresses with 1,000 to one million tokens, per Santiment. That’s a big jump from the 48% investors saw in the first half of June.

This increase in whale addresses may be attributable to new AAVE features. AAVE recently tweeted on the company’s recent achievements in the present DeFi industry.

We may expect an increase in the number of services that make use of the AAVE ecosystem over the coming years, as funding has been awarded to more than 26 different beneficiaries.

Staking the token on the ecosystem can now generate instant returns thanks to the company’s cooperation with Flashstake.

AAVE TVL Increasing As Well

Using the governance token, users may lend and borrow cryptocurrencies and real-world assets (RWAs) directly from one another, cutting out the need for a trusted third party. Investors gain interest when lending money and lose it while borrowing money.

The TVL of the system has increased to $1.17 billion, from $1.09 billion on September 14th, since tweets describing current changes in the ecosystem were released.

When the TVL number goes up, trade volume goes up with it. The token’s 24-hour trading volume increased from $74,494,475 on September 18 to $145,288,857 on September 20, according to publicly available data. This represents a massive growth of nearly 49 percent.

As of the time of writing, this figure decreased by 19.5 percent to $116,733,735. Although the long-term outlook for AAVE may be favorable, the short-term outlook is not promising.

Despite the significance of the advancements, the token is still subject to market conditions. The token has already lost 14 percent of its September 17 gains.

Positive Developments Help The Token Recover

The price decline can be attributed to the deteriorating macroeconomic conditions in the first half of September. Due to the market’s climate of dread, the crypto winter will persist until the end of the year before conditions improve.

Recent economic developments will influence the broader financial markets, particularly the cryptocurrency market. But recent developments can assist AAVE in recouping its losses.

Recently, NASDAQ announced its entry into the cryptocurrency market. Their justification was that institutional investors’ interest in digital assets has increased.

Despite the fact that their approach is still cautious because crypto exists in a legal murky area, this is still a big milestone in the crypto industry.

AAVE has been a part of the cryptocurrency market as a lending and borrowing platform. As the crypto winter persists, services such as AAVE will become indispensable for surviving the current market conditions.

AAVE total market cap at $1.02 billion on the daily chart | Source: TradingView.com

Featured image from The Coin Republic, Chart: TradingView.com

(The analysis represents the author’s personal views and should not be construed as investment advice).

Optimism Analysis: Latest Figures Could Induce Investor Trust

Optimism is a layer 2 network that operates on top of the Ethereum main chain. Since its launch in June, it has been the focus of investors and buyers due to its steady increase in value.

Despite the fact that the coin’s value is currently below the $1 level and falling as this is written, price fluctuations may be neutralized by recent developments.

Optimism (OP) is currently trading at $0.922285, up 3.5% in the last 24 hours, data from Coingecko show, Wednesday.

The development team has produced a report highlighting the progress made over the past month. From its low point in August, when there were just 563 million OP tokens staked, the TVL, or total locked value, has increased by 6 percent. At present, there are 872 million in TVL.

Optimism Latest Data May Spark Confidence In OP

Despite the fact that this is a decline from the 1.18 billion total value frozen OP tokens on August 7, any rise can boost investor trust in the OP token given the present market conditions.

The Token House Governance Fund is a critical component of the Optimism Network as a whole.

The primary objective of this fund is to finance network-related initiatives. Recent research puts this figure around $40 million. The earlier expansion of the system’s TVL can be partly attributed to this figure.

This expansion is accompanied by mixed news about user data. According to recent data, the first token airdrop in June 2022 generated a considerable increase in the network’s number of new users and transaction volume.

Then, in step with the broader crypto crisis, this figure plummeted.

Optimism: The Governance Fund Incentives 

According to the cited analysis, however, it leveled out, indicating that the network retained the majority of its users even as the crypto market declined. The Governance Fund Incentives contribute to the retention of users.

How will this network’s expansion affect the trading of the token? According to publicly available information, not much. The coin trades between $1.005 and $0.844 per piece. It follows the adverse market trend of the entire cryptocurrency market at present.

This volatility is regarded typical relative to recent crypto market fluctuations. Although current market conditions outside of Optimism Network are difficult, the same cannot be true for the network itself.

The transparency of the Optimism Network to its users has contributed to its good growth. This transparent outlook and democratized proposal system make it one of the most decentralized currencies on the market, if not the most decentralized.

Optimism can be confident that additional users will come to them as a result of the increasing number of DeFi believers.

Crypto total market cap at $896 trillion on the daily chart | Source: TradingView.com

Featured image from Motivation Grid, Chart: TradingView.com

(The analysis represents the author’s personal views and should not be construed as investment advice).

Ethereum: Can The Top Altcoin End Bitcoin’s Dominance Post Merge?

Ethereum (ETH), dubbed as the ‘leader of all altcoins’ has long carried the burden and pressure of supplanting Bitcoin (BTC) as the king of all cryptocurrencies.

To this date, it hasn’t succeeded or has come close into completing that mission. Not even The Merge could catapult Ethereum to the top and frankly, it hasn’t been able to even just leave a dent on the wall that was built by Bitcoin to keep its position.

In terms of price, there is considerable gap between the two crypto assets. Tracking from CoinGecko shows that as of this writing, Bitcoin is trading at $19,003 while Ethereum is at $1,338. Both currencies experienced price drop for the last seven days, 5.8% and 14.9%, respectively.

Image: Zipmex
Misplaced Confidence And Hopes With Merge

Last July during an interview, Ethereum Researcher Vivek Raman expressed confidence that The Merge will enable to altcoin alpha to finally topple the biggest of its hurdles and surpass Bitcoin, becoming the new most prominent cryptocurrency.

The Merge refers to an upgrade that was completed this September that will put Ethereum to a proof-of-stake (PoS) system. It was also deemed to change the network’s monetary policy, making it more environmentally friendly while reducing ETH supply.

But since the migration, Ethereum hasn’t been able to respond with an appropriate bullish run. Instead, along with Bitcoin and all other altcoins, it continues to deal with plummeting prices.

A Moment Of Victory For Ethereum

While it still fails to rise in the same level of prominence as that of Bitcoin’s, Ethereum did have a moment of victory against the crypto king after The Merge, courtesy of a rather strange observed trend reversal in crypto market. 

Bitcoin’s trading dominance came to an abrupt end after ETH trading volume soared to greater heights and ultimately hit an all-time high.

Experts, however, believe that this effect of The Merge to Bitcoin is minimal and there will be resultant price movements, it will be transient. This is because the shift to a proof-of-stake mechanism has always been part of the plan for Ethereum since day one.

Hiro CEO Alex Miller said Bitcoin has already established itself as “the core asset,” calling the crypto “the digital gold.” For that matter, he believes Ethereum surpassing its rival in terms of market capitalization remains improbable as of this time.

ETH total market cap at $165 billion on the daily chart | Source: TradingView.com

Featured image Coinpedia, Chart: TradingView.com
(The analysis represents the author’s personal views and should not be construed as investment advice).