Bitcoin Funding Rates Fall Flat For Weeks As Market Takes Pause

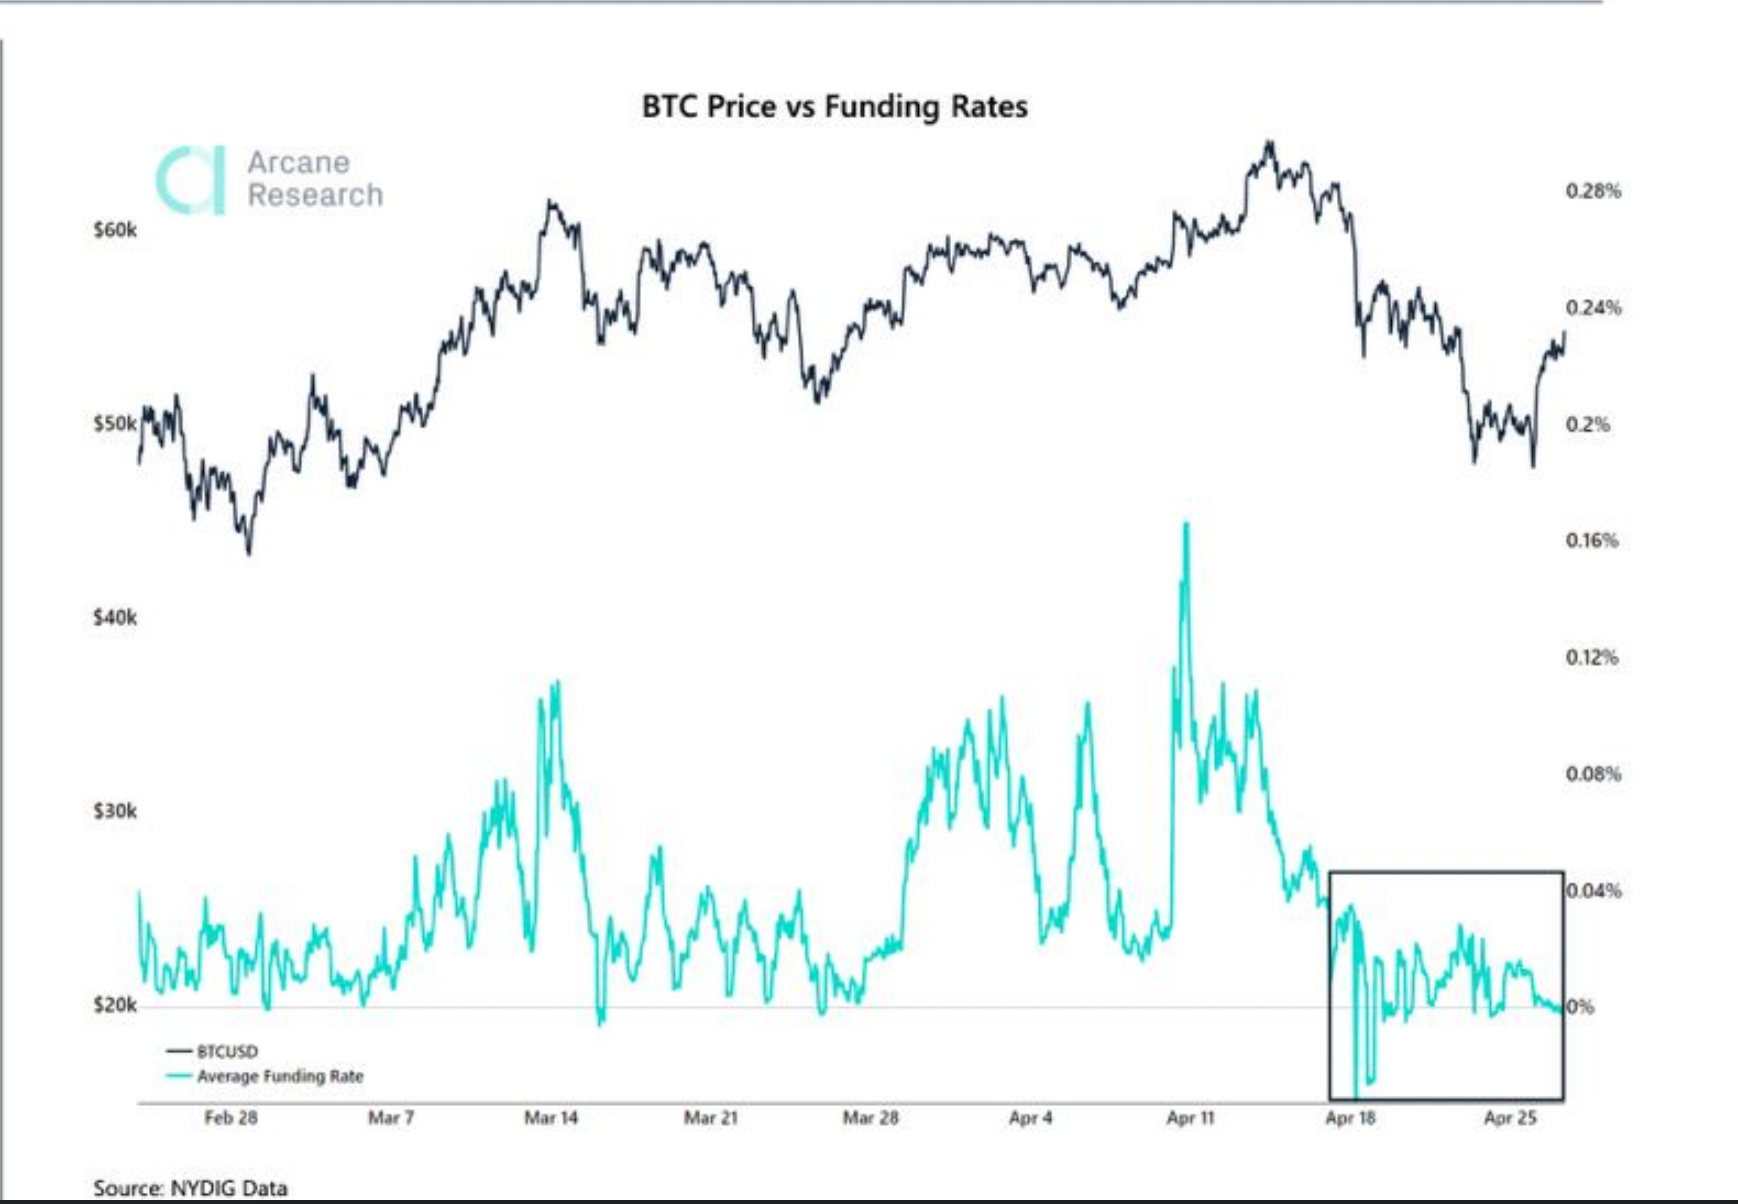
The funding rates for Bitcoin have recovered from their September 2020 lows, insomuch that they are now trending sideways since April 18.

Many analysts watch Bitcoin Funding Rates because of their potential to predict the upcoming trends in the flagship cryptocurrency market. In retrospect, they signify periodic payments that traders with open short positions pay to the ones with open long positions, all based on the difference between the perpetual contract market and spot price.

A positive funding rate reflects traders’ bullish bias, showing that long traders pay short traders in a market that appears heavily skewed to the upside. Similarly, when the Bitcoin funding rate becomes negative, it implies that traders are bearish, which means short traders pay long traders.

But…

…based on Arcane Research’s report, the funding rates have gone neutral for more than a week. The research and analysis firm added that the short-term bias conflict between bears and bulls would eventually favor the latter, given the Bitcoin price’s incredible recovery at the beginning of this week.

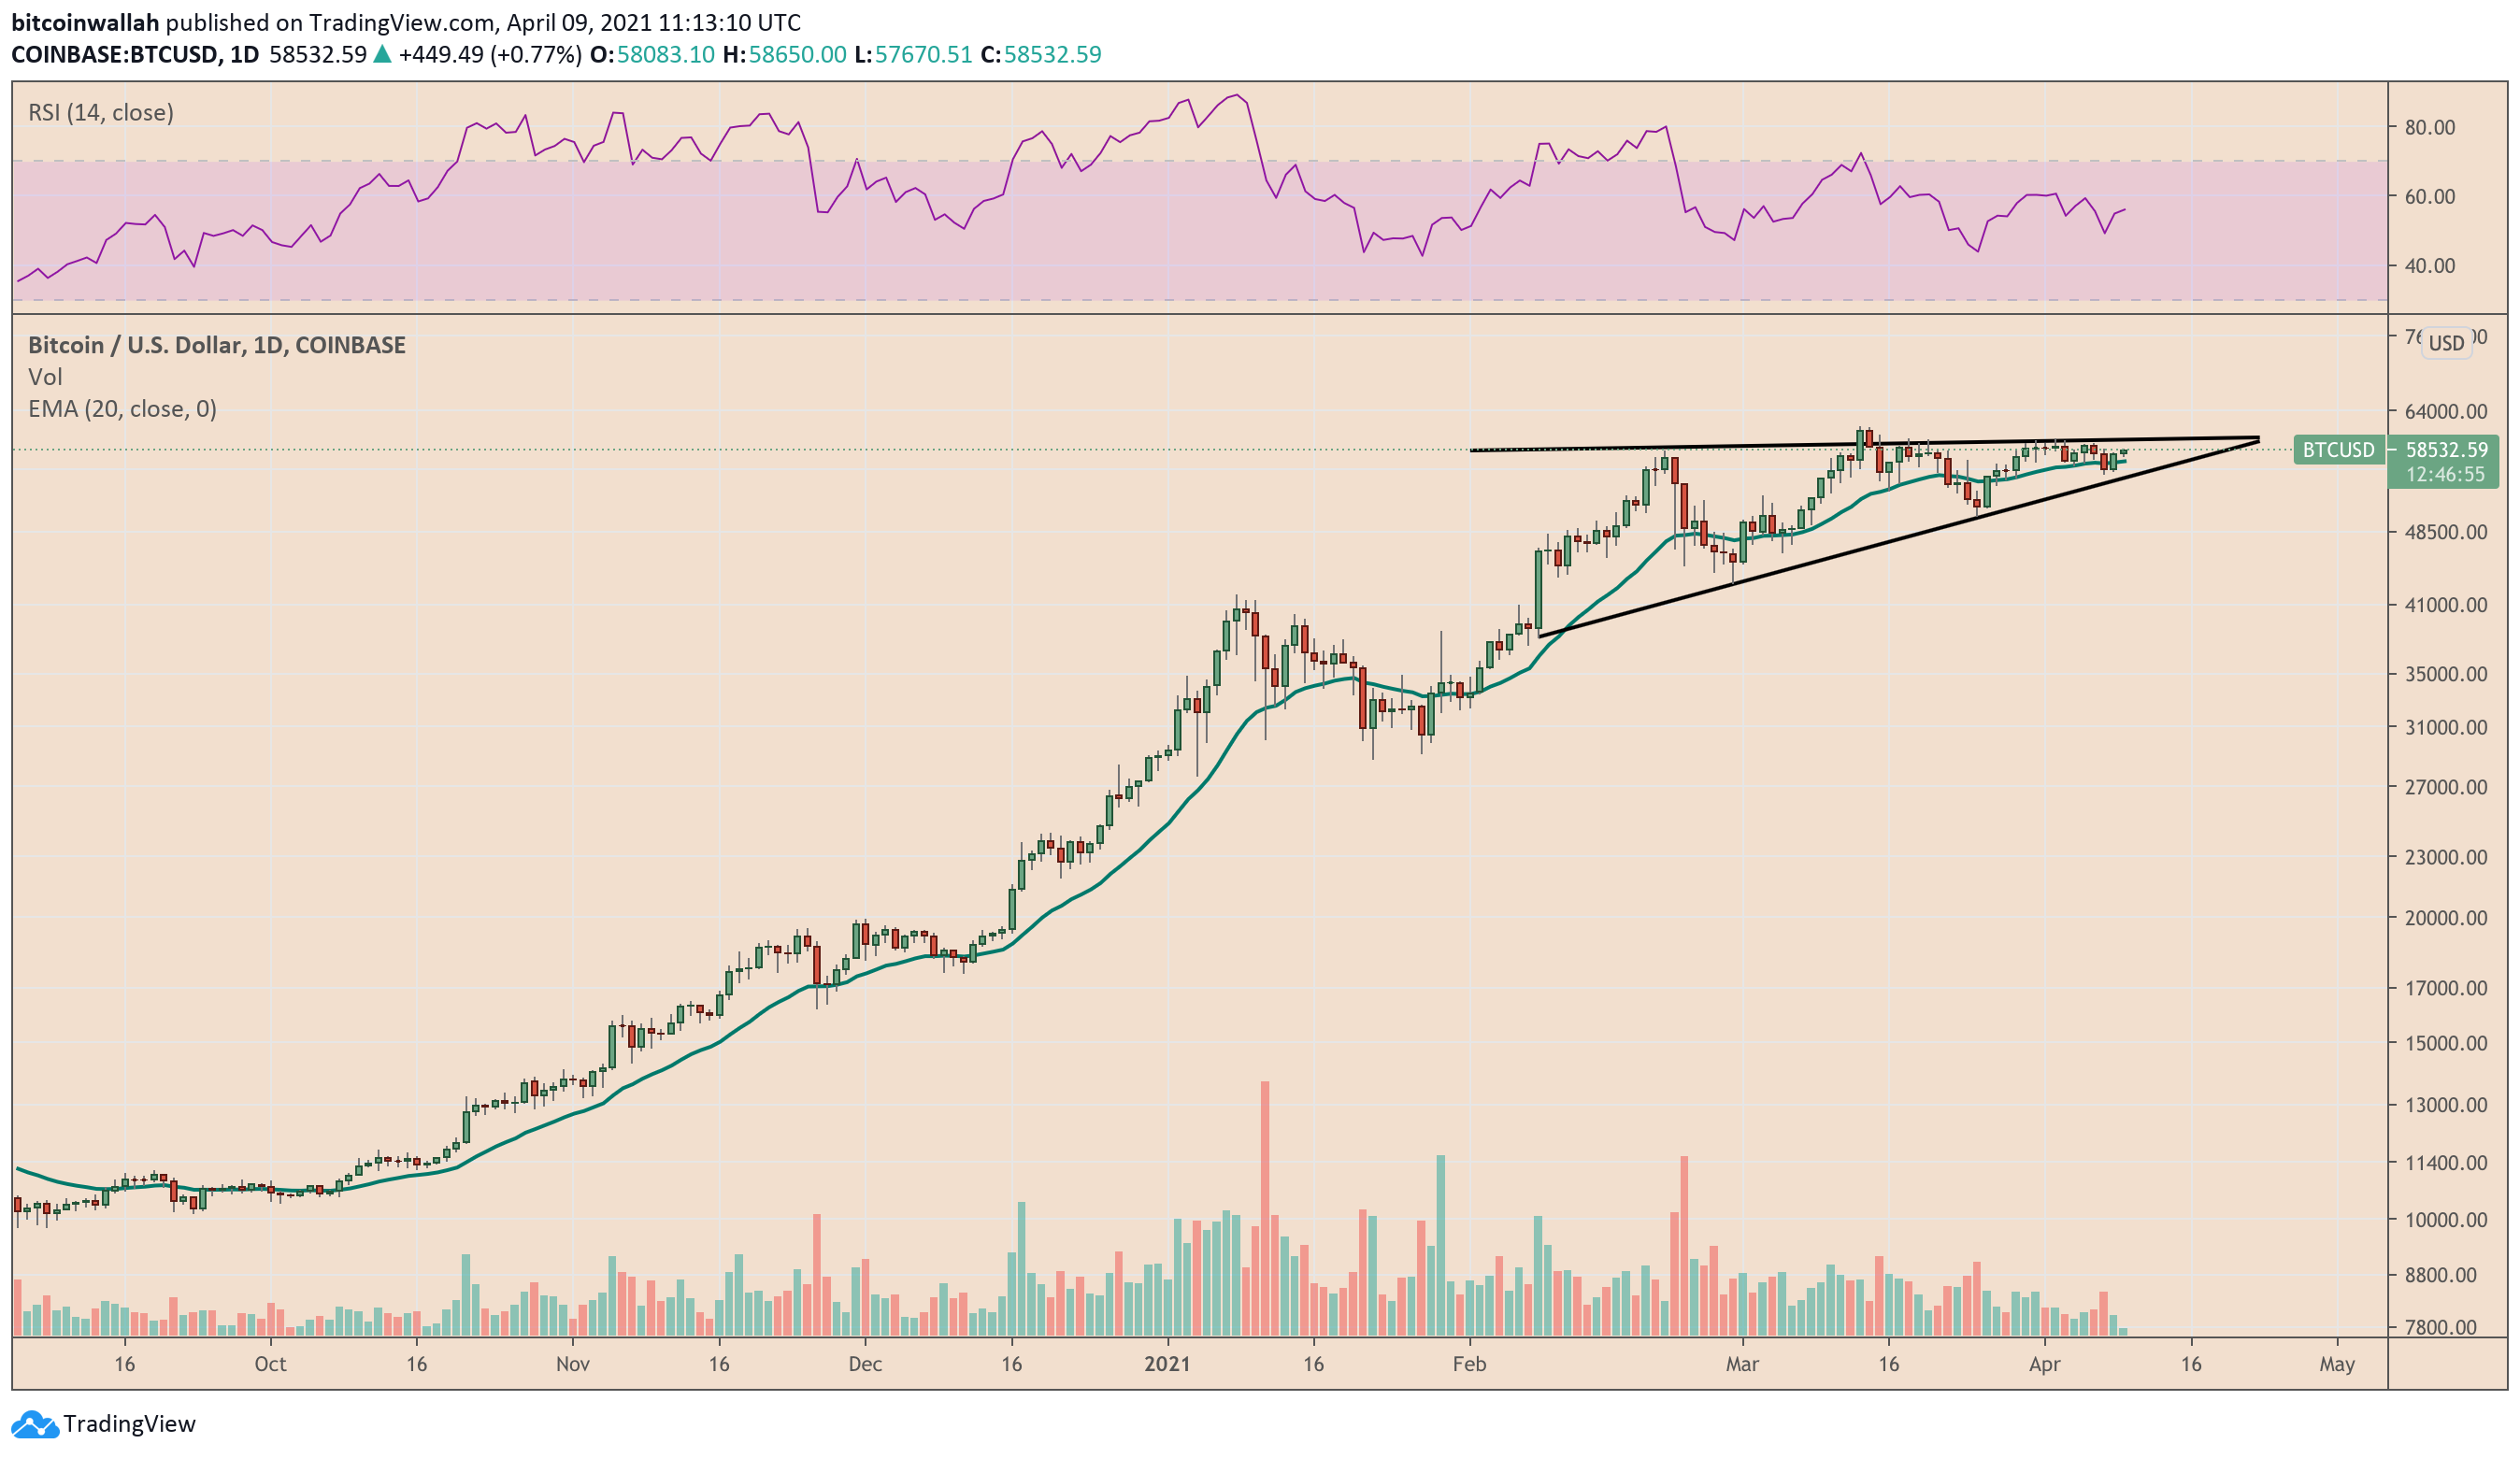
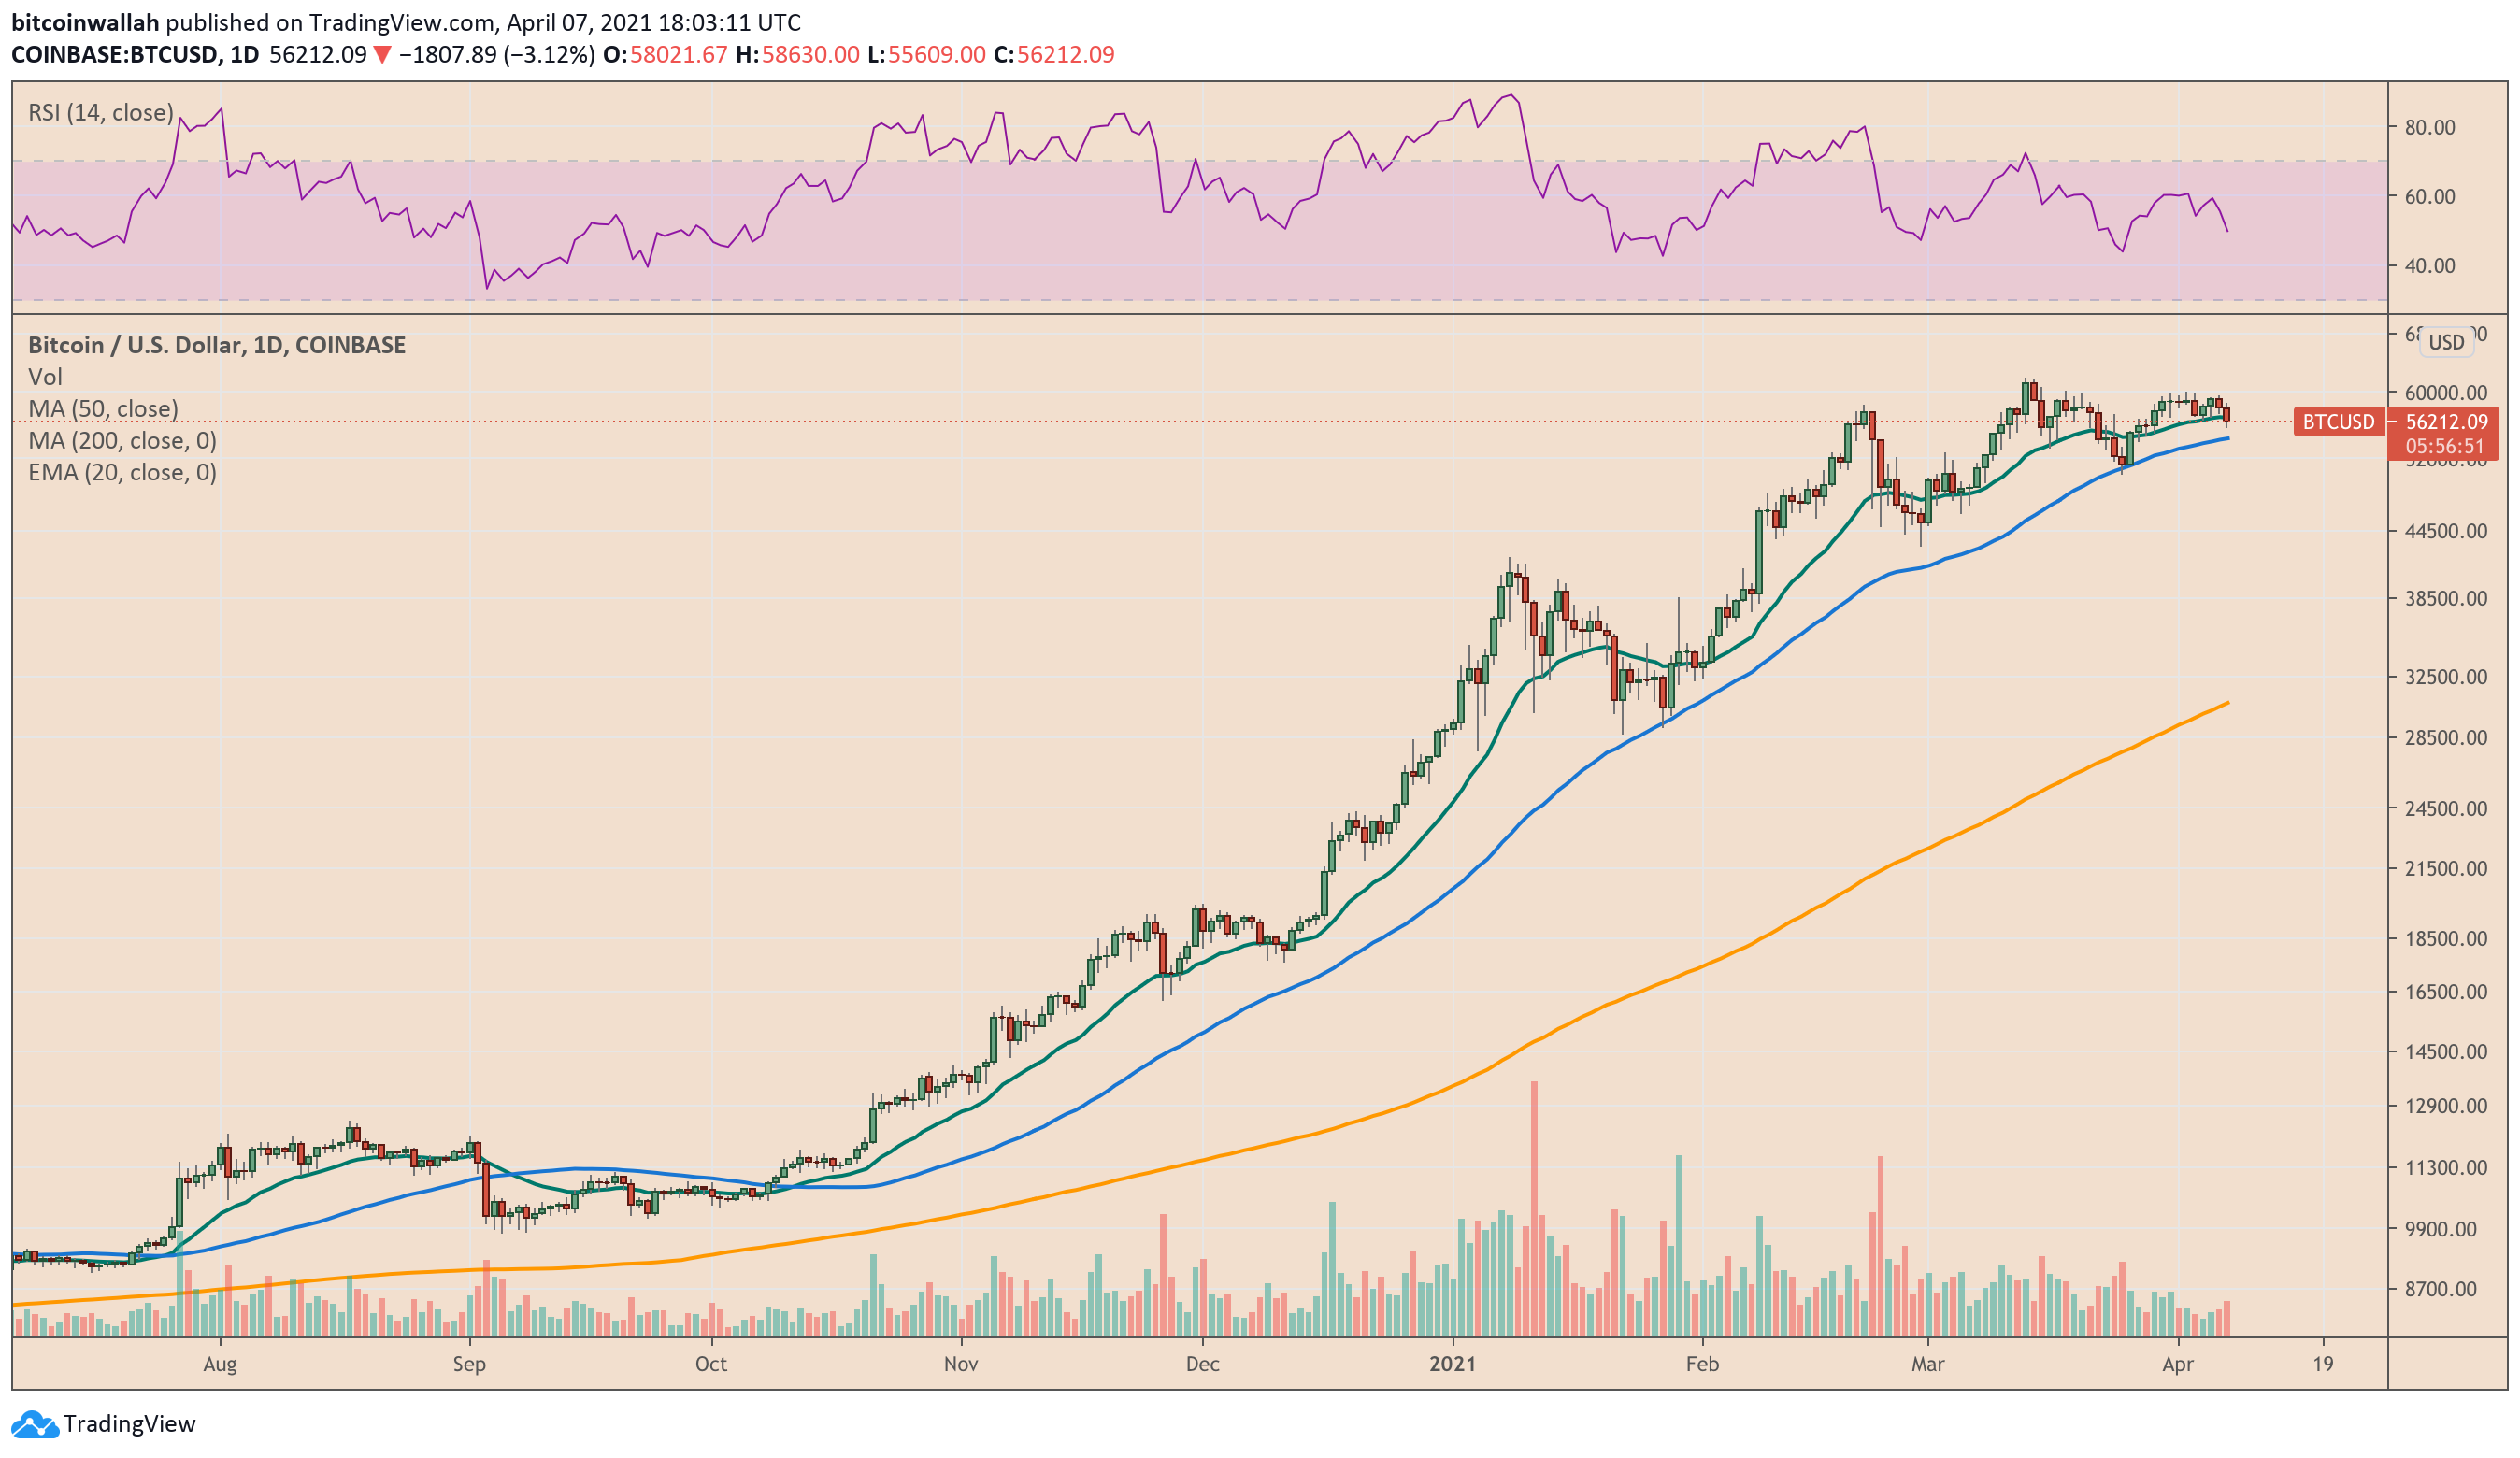
The BTC/USD exchange rate dropped by more than 27 percent after establishing its record high of $64,899 on April 14. It was only until this Monday that the pair showed any signs of recovery. Its rebound went as far as 12 percent on a week-to-date timeframe, coinciding with its neutralizing funding rates.

“The fact that the funding rate has remained neutral amid Bitcoin’s strong recovery yesterday is a healthy sign going forward,” wrote Arcane Research.

Bitcoin Price vs Funding Rates. Source: Arcane Research
Bitcoin Price vs. Funding Rates. Source: Arcane Research

More bullish tailwinds for Bitcoin came from its declining open interest. Arcane Research cited derivatives market data from April 27 session, noting that unsettled BTCUSD contracts reached their lowest levels since March 8. That reflected more cautious sentiment in the derivative market. It also meant that the ongoing Bitcoin price recovery entirely took cues from spot markets.

“It makes the current price action more sustainable,” added Arcane Research.

Part of the reason Arcane Research appeared bullish is the ability of the derivatives market to drive bitcoin prices wildly. Traders typically open highly leveraged trades as they anticipate maximum returns from precarious positions. Nevertheless, when their bets fail, it increases their tendency to sell their real bitcoin assets to cover their margin positions. That overall fuels selling pressure in the market.

What’s Next for Bitcoin?

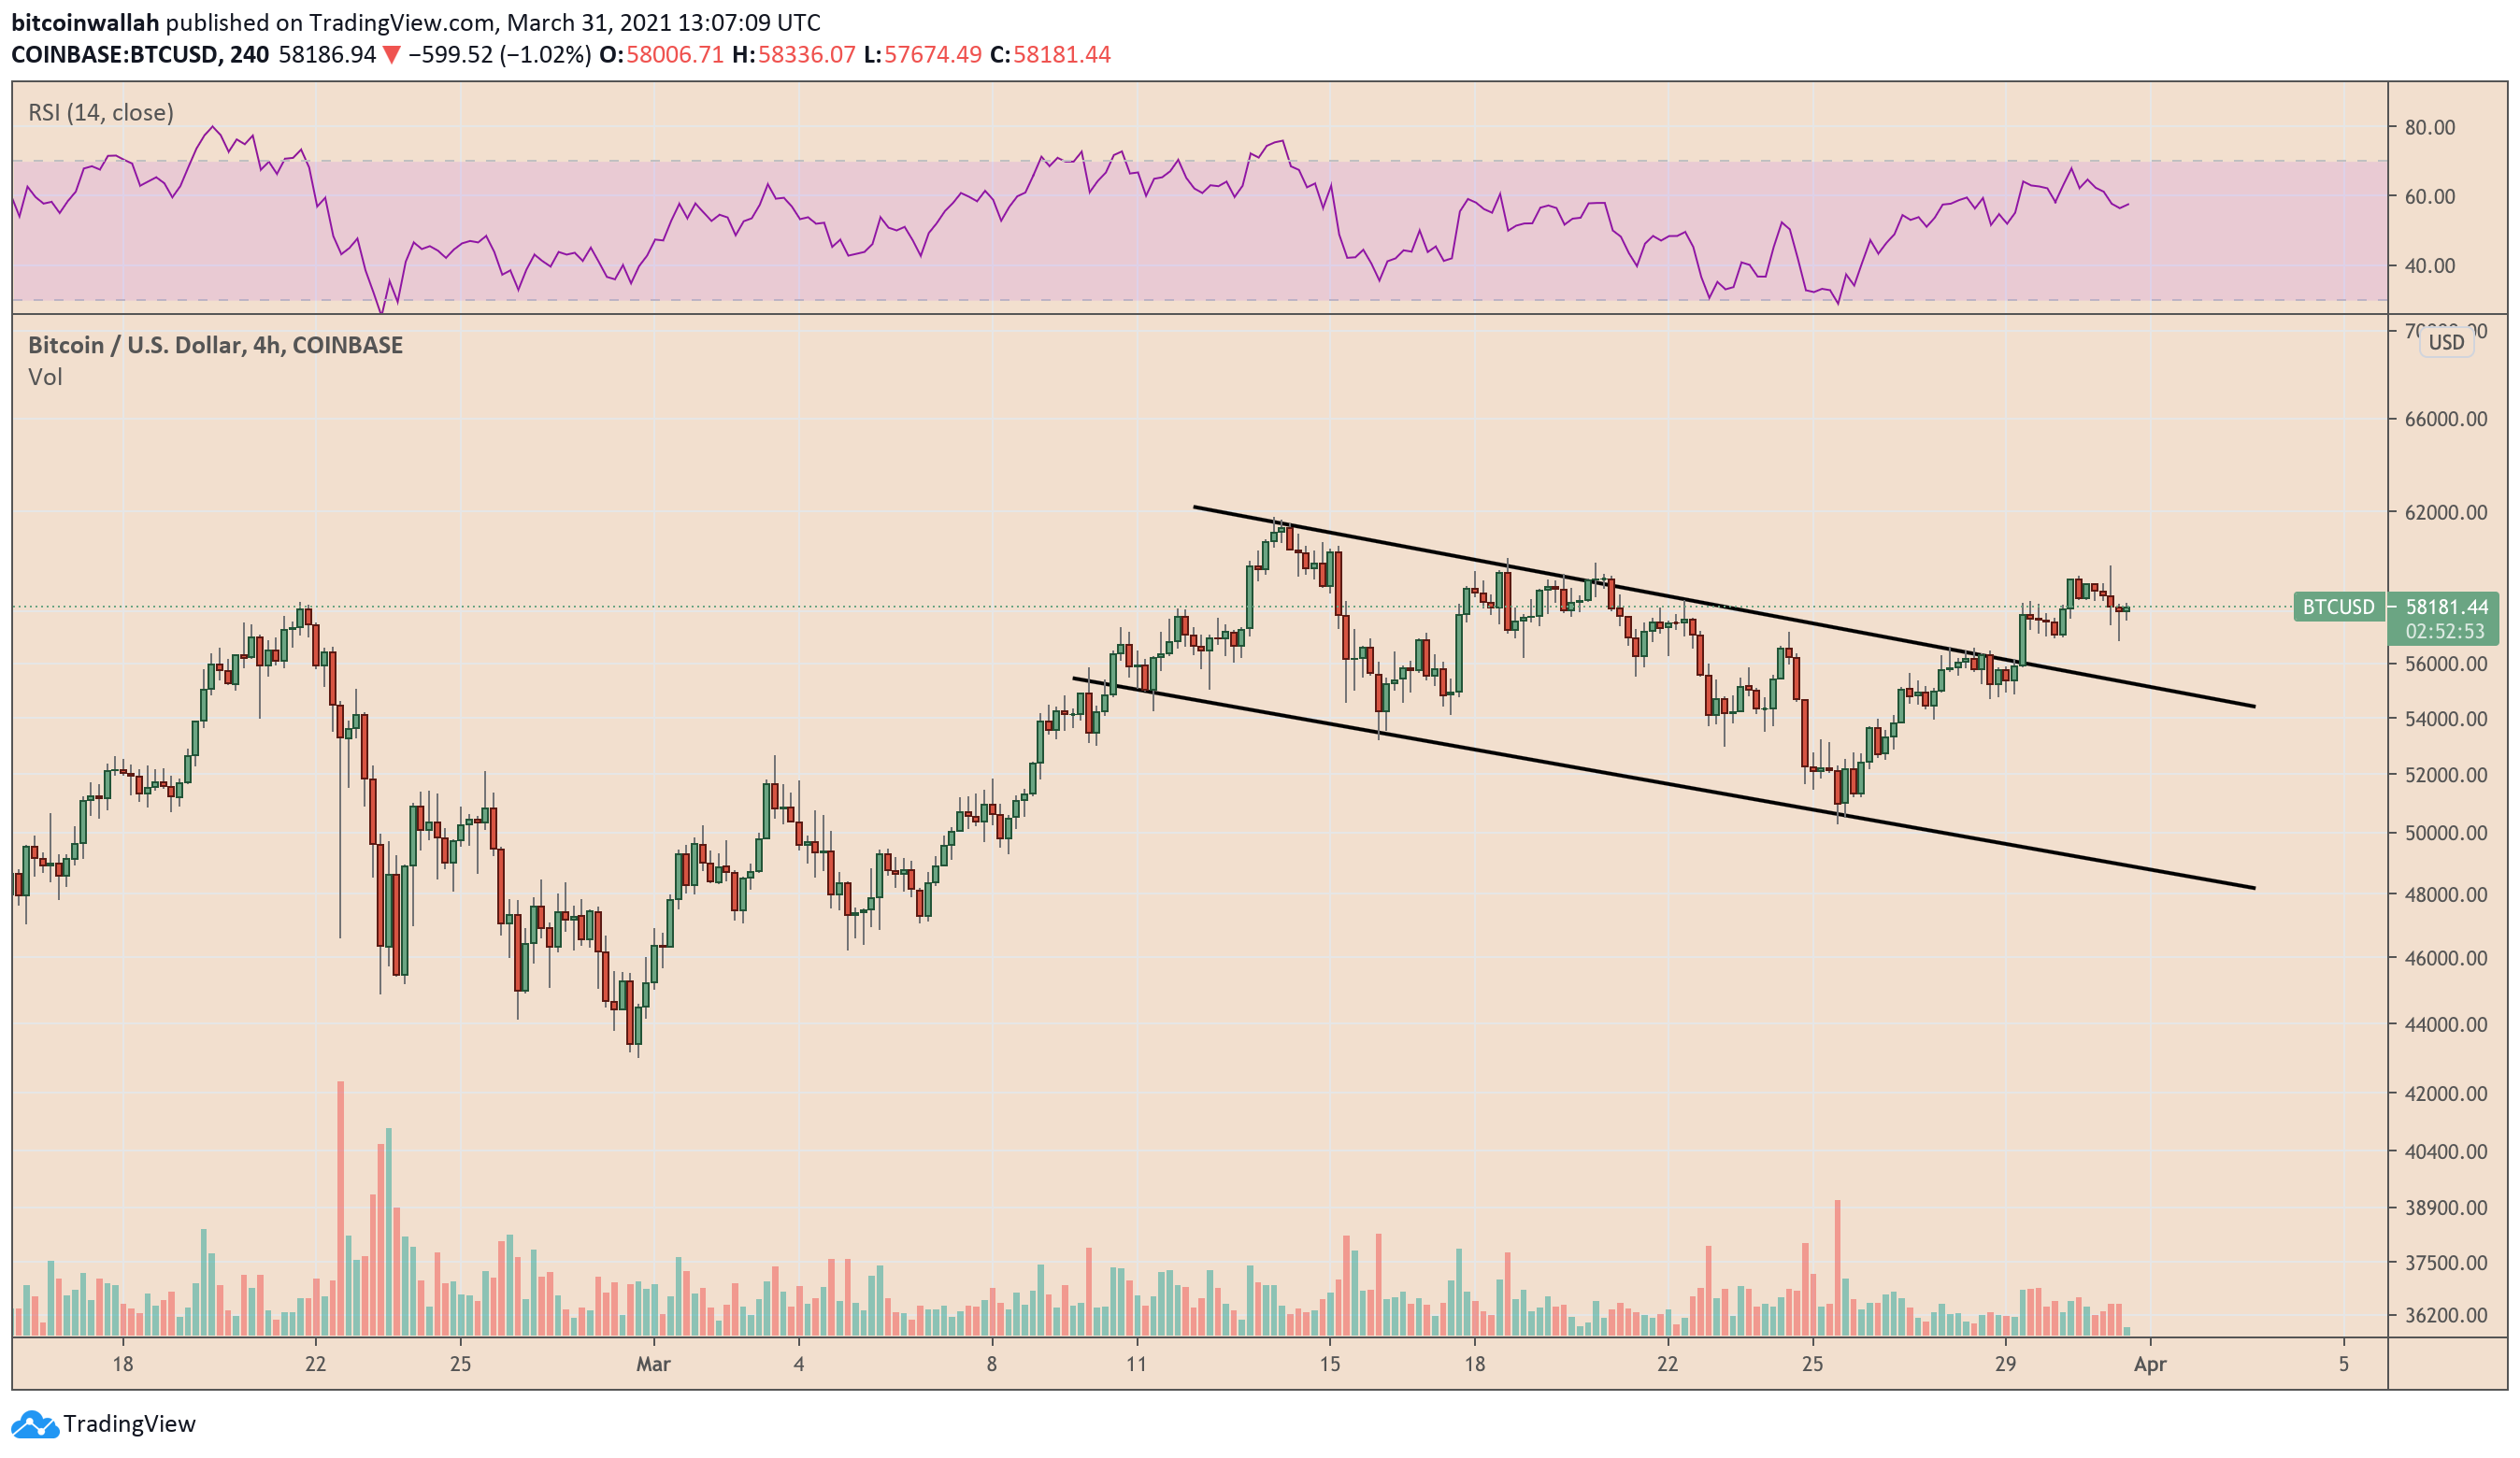
According to ByBt.com, the bitcoin options contract expiring on April 28 has a majority strike price target near $52,000. That increases the pressure on bulls to protect the market from potential bearish assaults. Should they fail, one can expect a breakdown towards the said lower level.

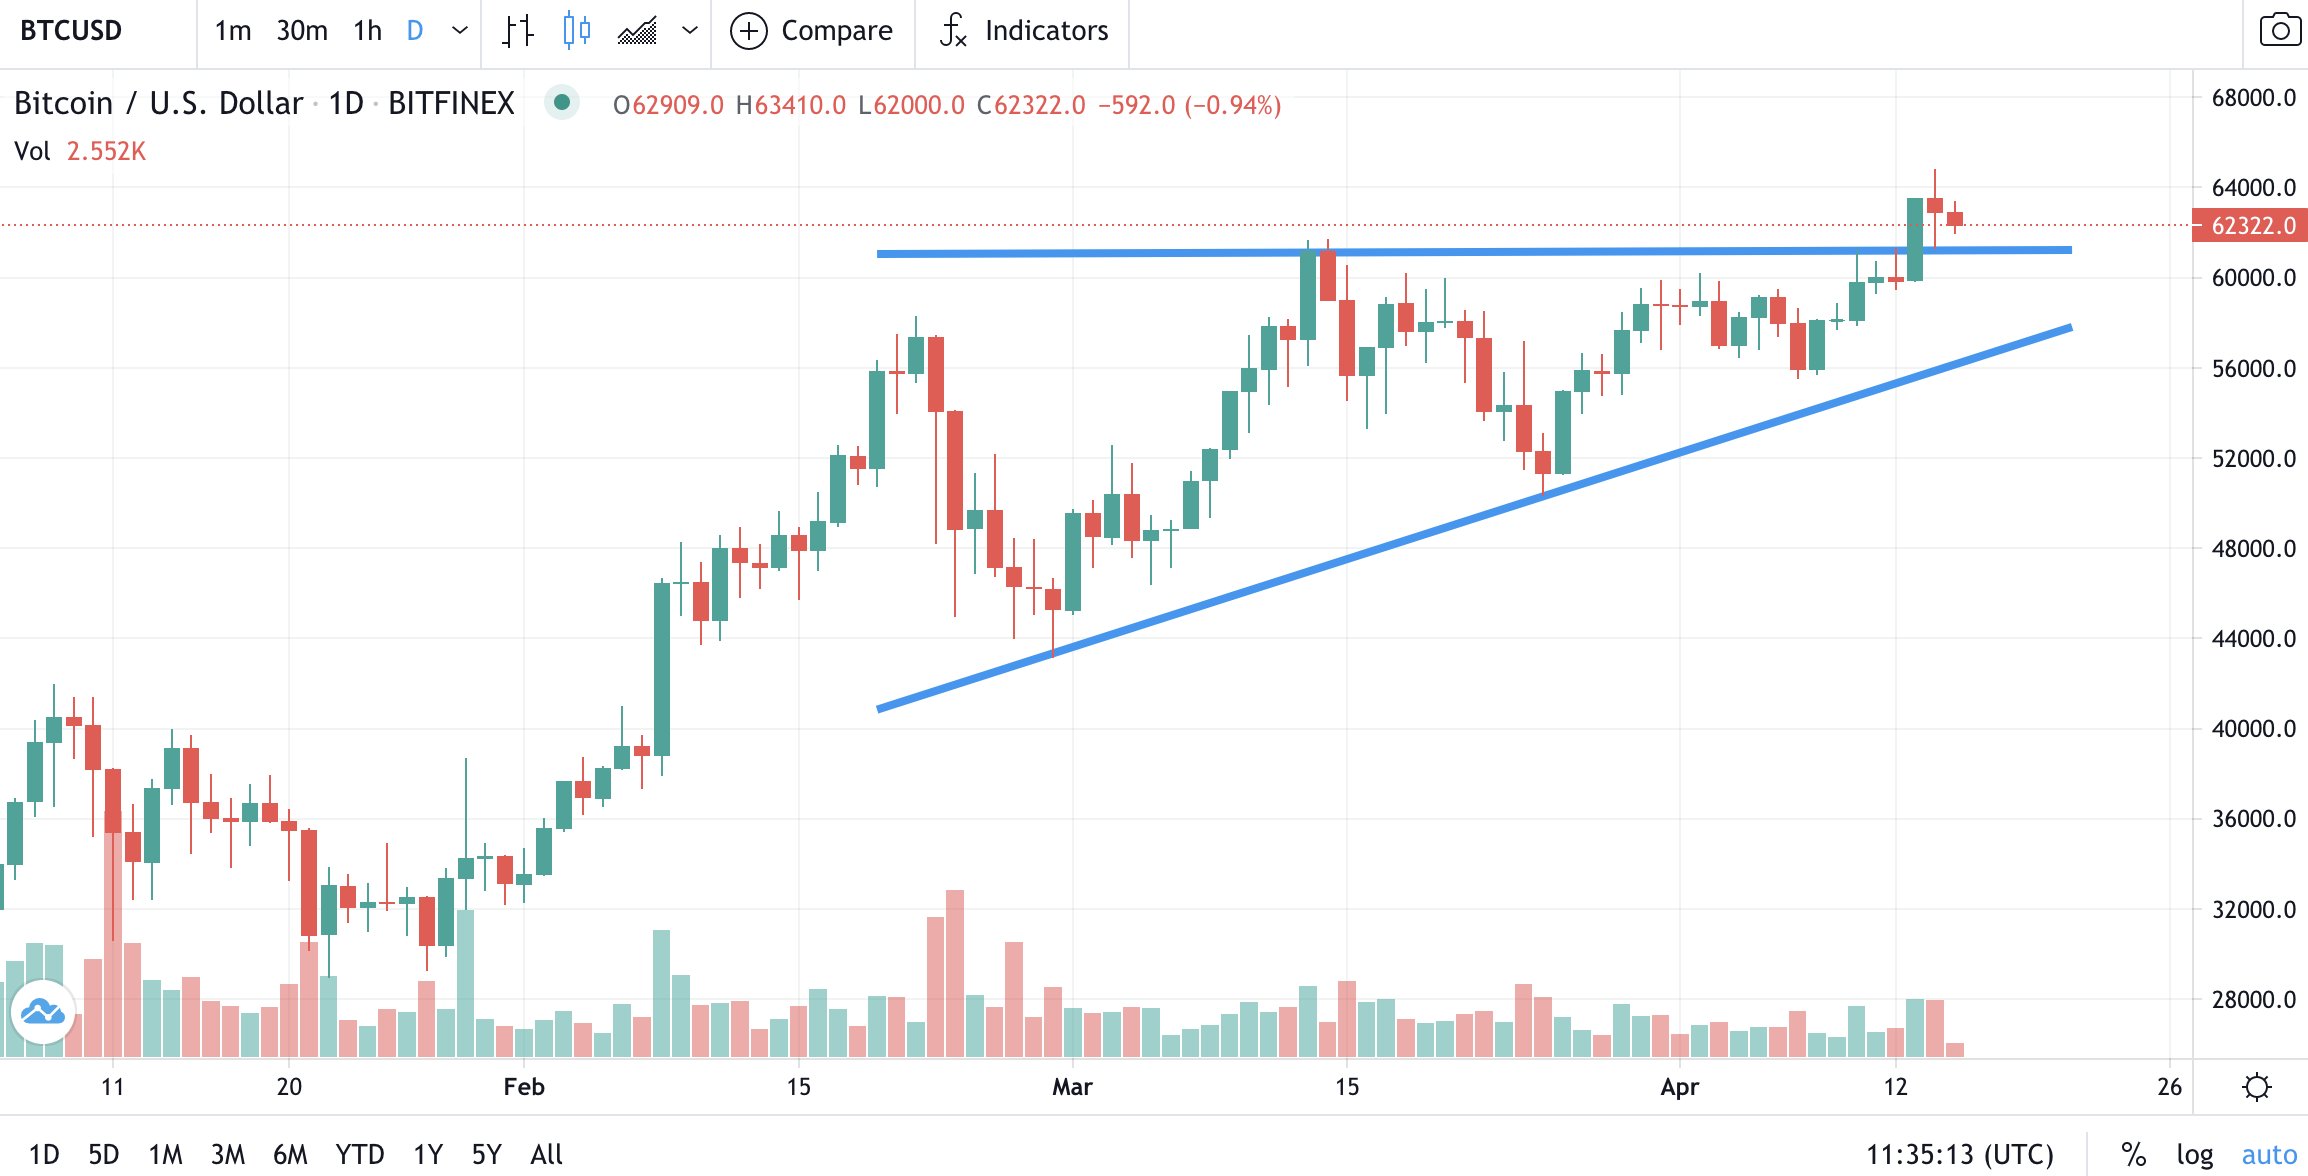
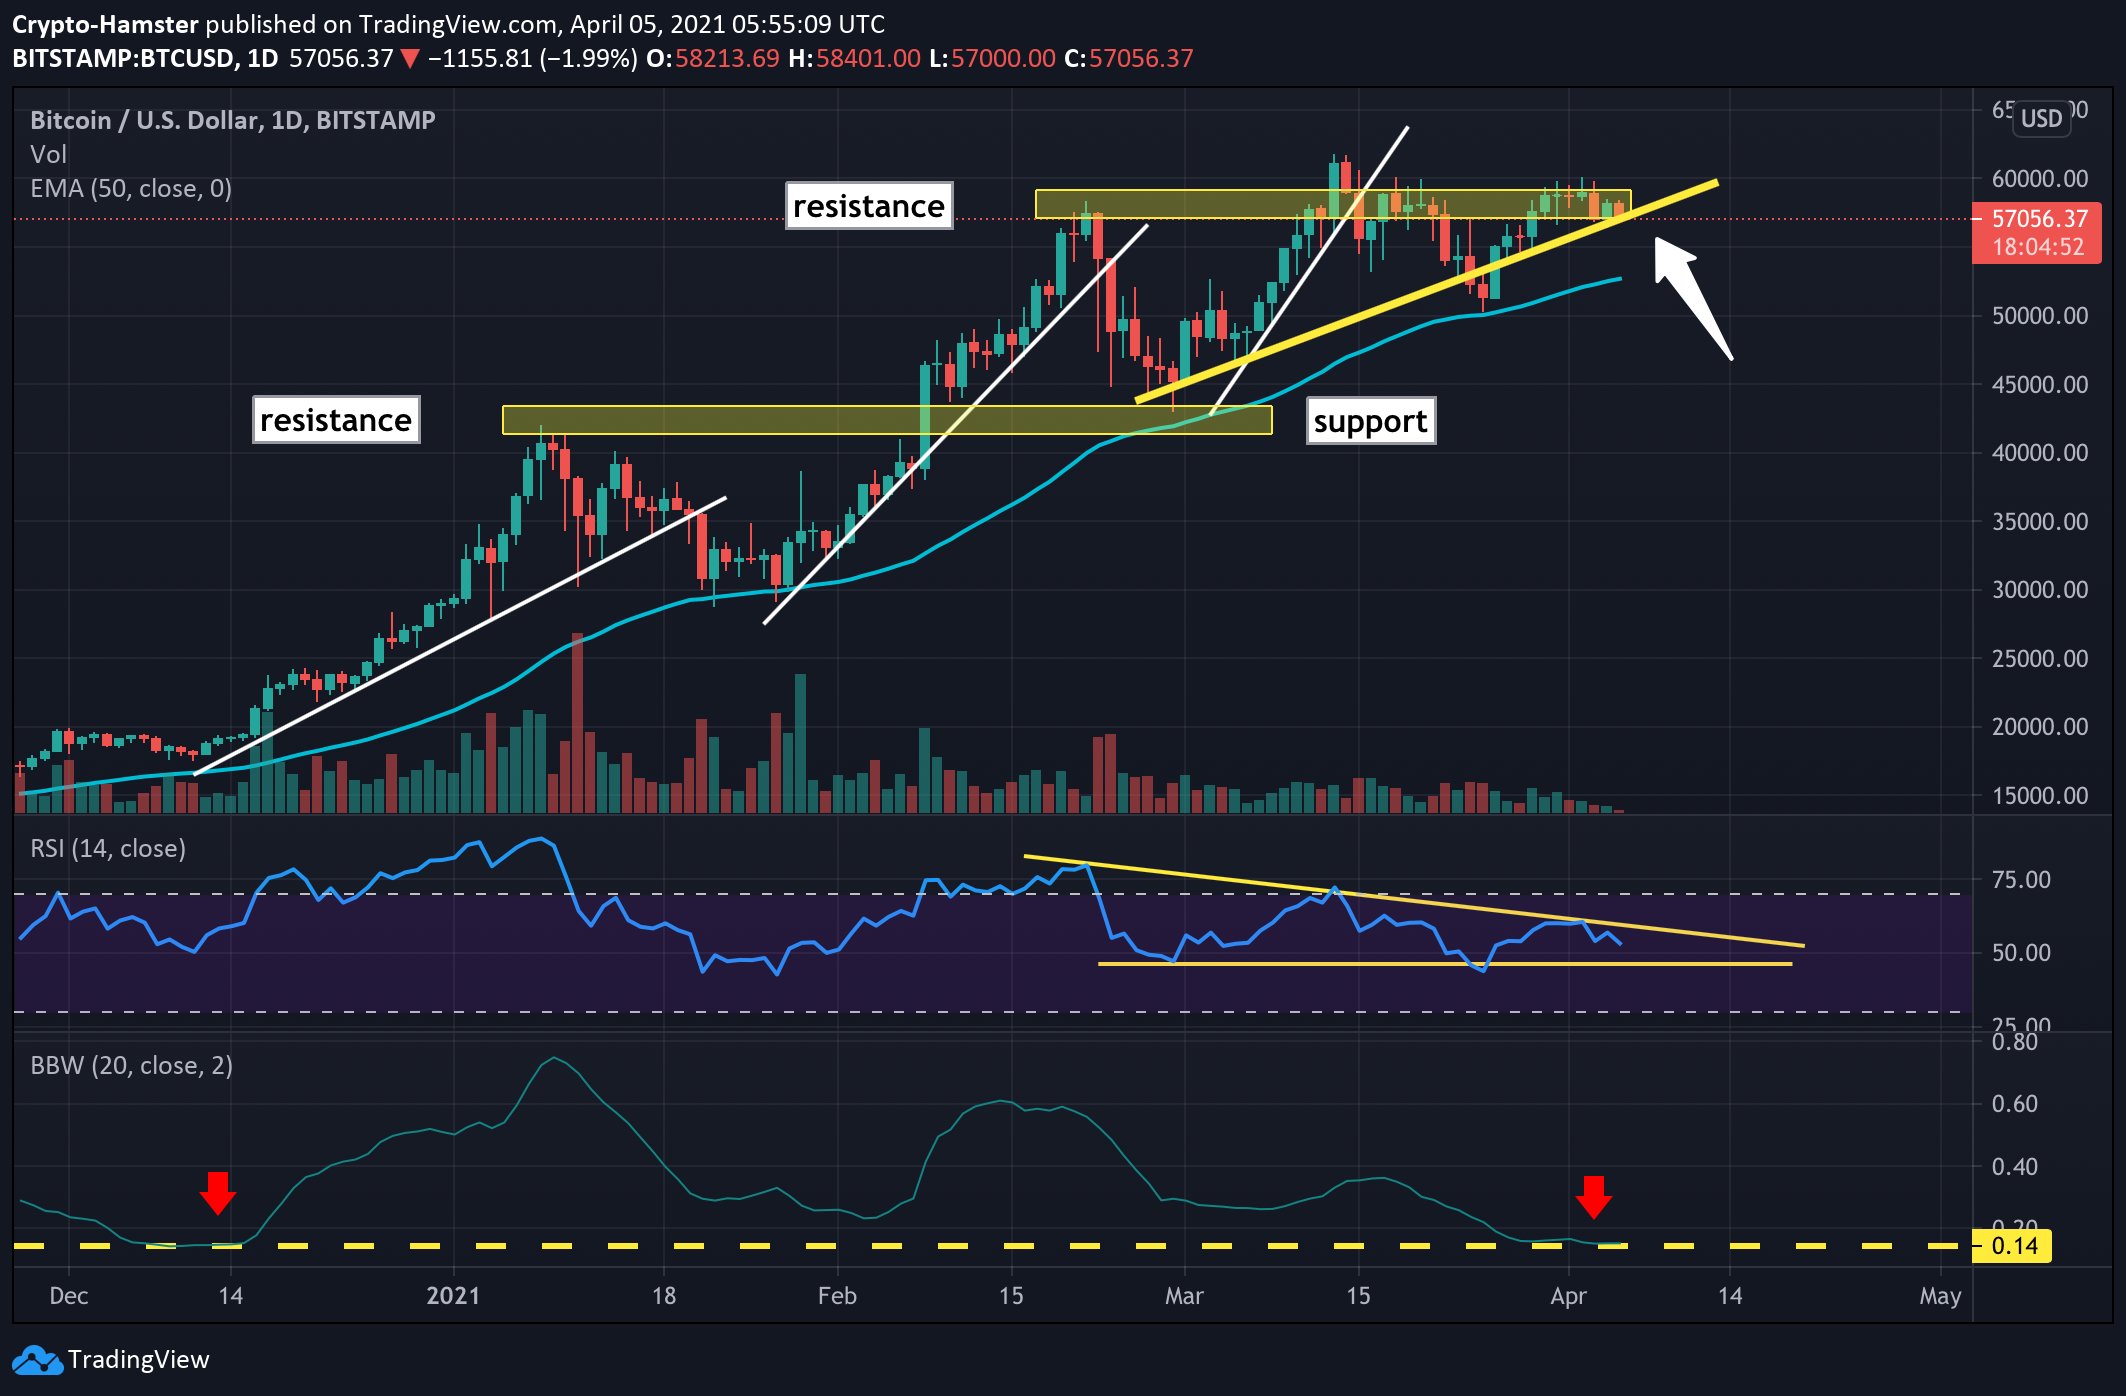
It also coincides with the 100-day simple moving average, which served as support to the ongoing Bitcoin price rebound.

Bitcoin bounces off the purple wave (100-DMA). Source: BTCUSD on TradingView.com

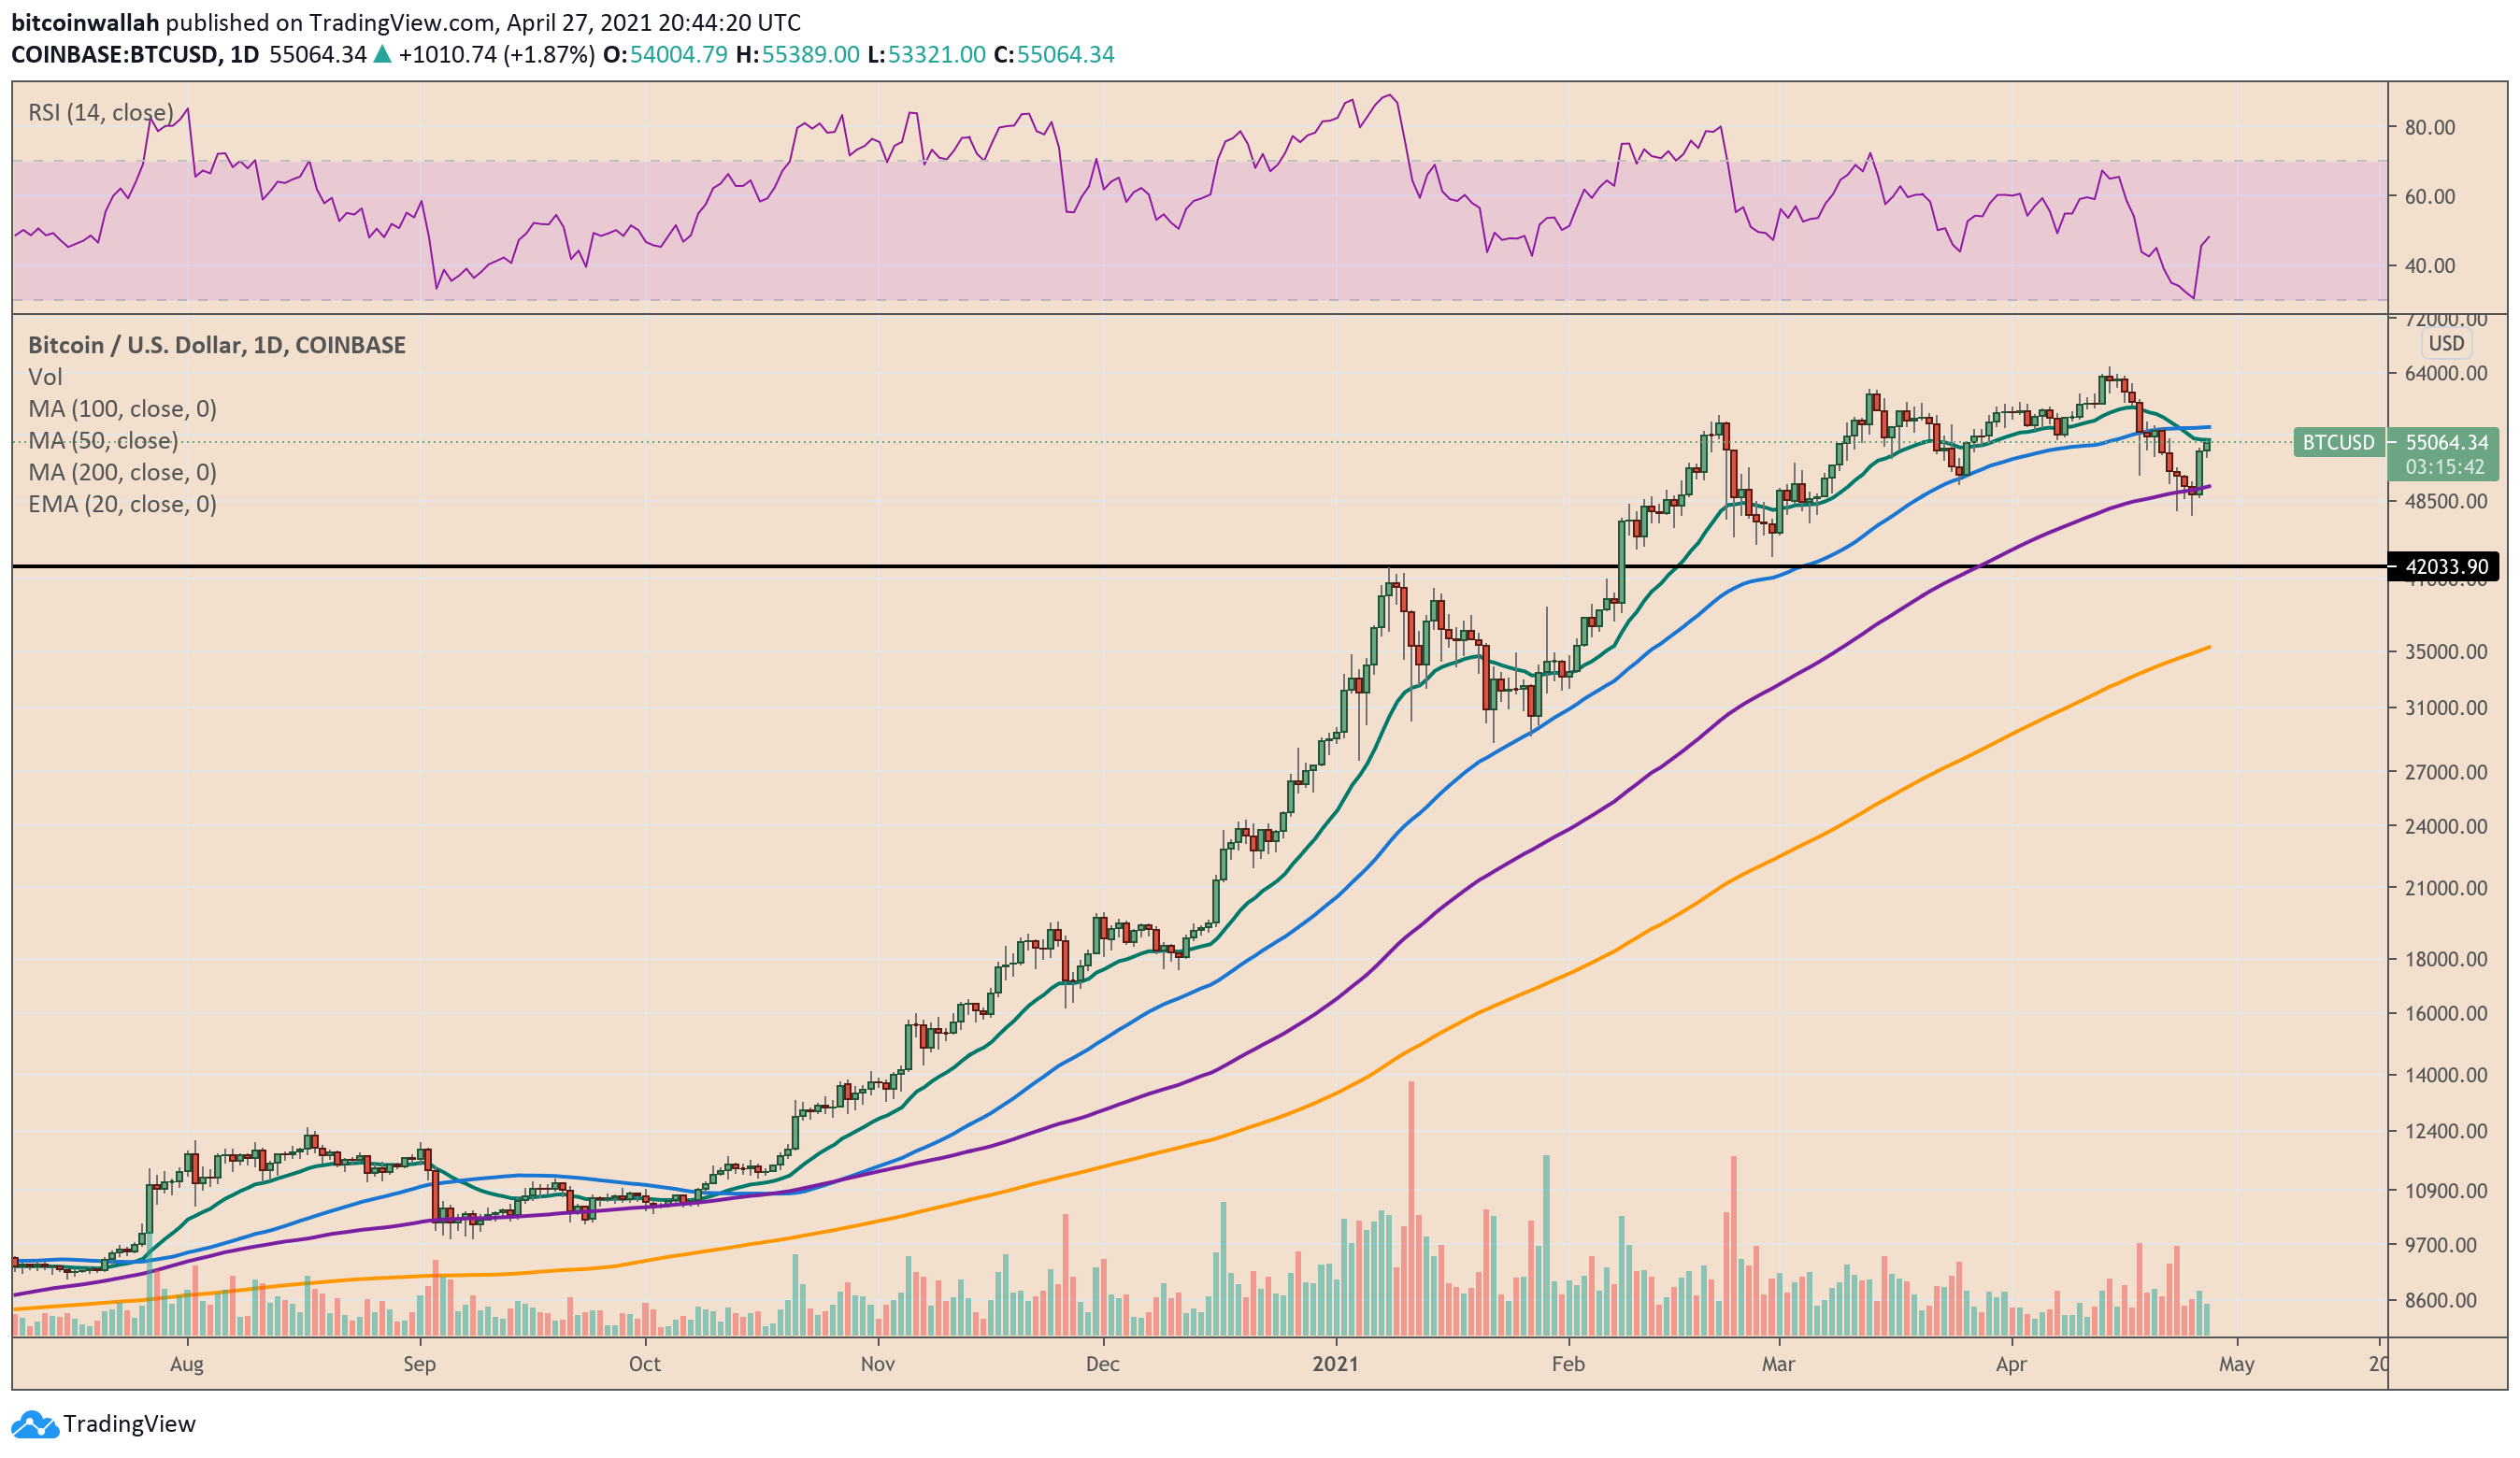
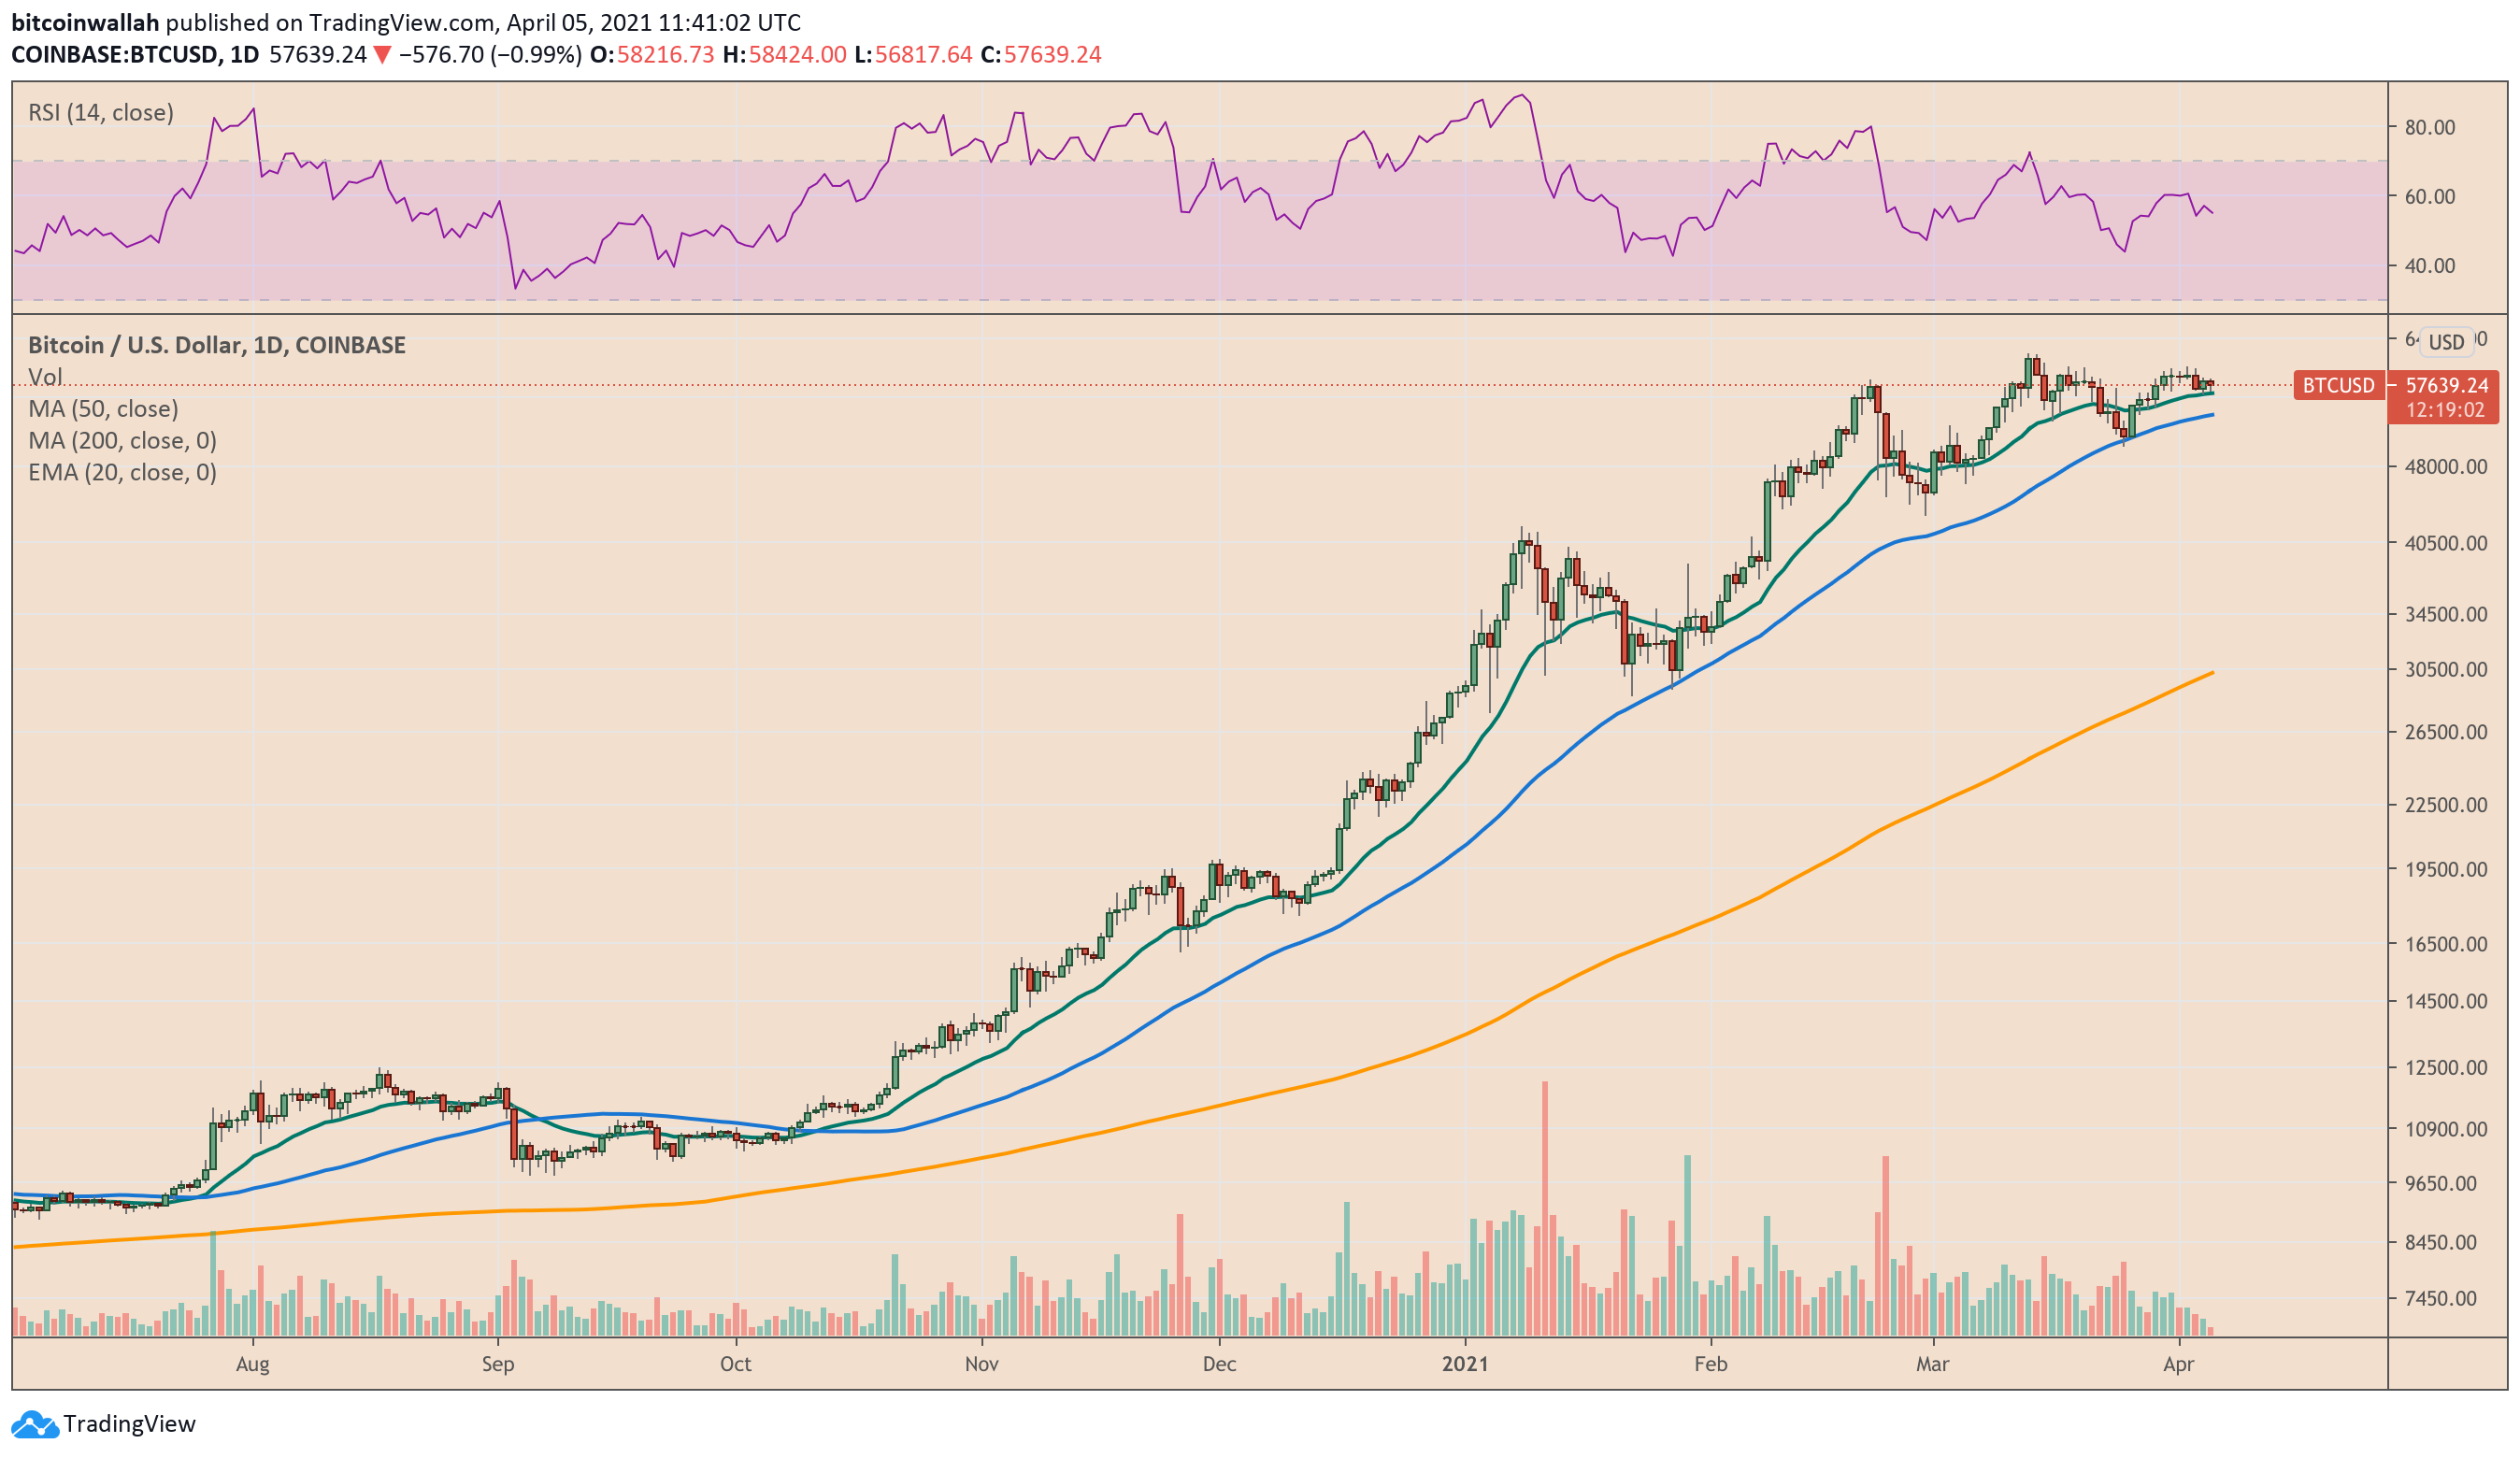
As of now, the BTC/USD exchange rate is looking to break above its 20-day exponential moving average (20-DMA).

Image by Marcel Langthim from Pixabay 

Latest Bitcoin Dip Did Little In Offsetting “Wildly Bullish” Bias; Here’s Why

Bitcoin dropped immensely after setting up a record high of $64,896.75 as some traders decided to secure short-term profits.

The correction nevertheless did little in offsetting the benchmark cryptocurrency’s upside bias. Analysts remained convinced that the BTC/USD exchange rate would rebound from its sessional lows to pursue its uptrend as it was. One of them is Dr. Jess Ross.

The founder/chief executive at Vailshire Capital tweeted earlier Thursday that Bitcoin remains “wildly bullish,” citing an ascending triangle to back his upside sentiment. In retrospect, the BTC/USD exchange rate was trading inside the bullish continuation pattern, with the area between $60,000 and $61,000 serving as its interim resistance.

Bitcoin broke out of the Ascending Triangle pattern earlier this week. Source: BTCUSD on TradingView.com

Earlier this week, the pair broke above the price ceiling range on supportive macroeconomic sentiments. Coinbase, the US’s largest cryptocurrency exchange, debuted on the Nasdaq Stock Market following a landmark direct listing. Traders used the Wall Street-oriented signal to raise their bitcoin bids, insomuch that the price surged by more than $5,000 in the hours leading up to the Coinbase share (Ticker: COIN) listing.

The news helped Bitcoin break above the $60,000-61,000 range after testing it for weeks. But its effect started wearing off New York mid-afternoon session Wednesday. The wild fluctuations in the COIN market rattled traders inside the spot Bitcoin one. The price fell, as a result, leaving traders guessing about the next potential bias in the cryptocurrency market.

Bitcoin to $80,000 Next?

Dr. Ross noted that bitcoin bulls should wait for the price to drop towards the previous price ceiling of ~$61,250 before buying the cryptocurrency or placing a bet on its upside move. He added that BTC/USD would surge higher after testing the flipped resistance level.

“Great opportunity to buy before next leg higher,” he tweeted.

As NewsBTC also covered, Ascending Triangle breakouts typically shoot the price upward by as much as maximum length between the pattern’s upper and lower trendlines. That puts Bitcoin’s breakout target at nearly $80,000.

Photo by Macau Photo Agency on Unsplash 

Bitcoin Price To Hit $70,000 by April-End? This Analyst Thinks So

Bitcoin is preparing for a supersonic bull run towards $70,000 in April.

So believes Nick Spanos, co-founder of Zap.org — a decentralized oracle data feed startup. In an email interview, the market analyst said that he sees the bitcoin price higher due to two very supportive developments in the cryptocurrency market.

First, Mr. Spanos noted, the much-publicized direct listing of Coinbase Global Inc. shares on the Nasdaq Stock Market would propel the bitcoin prices upward. The Coinbase stock (Ticker: COIN) would serve as a gateway to more conservative investors to embrace the cryptocurrency and other digital assets.

“The upcoming public debut of Coinbase is particularly exciting to mainstream market investors,” Mr. Spanos told NewsBTC. “They will have a more direct opportunity to buy the shares of a company that plays a central role in Bitcoin and crypto space.”

ETF-ETF

Last, the analyst noted a recent spike in the number of companies seeking a bitcoin-enabled exchange-traded fund approval from the US Securities and Exchange Commission. The agency so far has denied every crypto ETF proposal that came to its table, citing concerns related to regulatory uncertainty and price manipulation.

Nevertheless, many believe that the US might see its first Bitcoin ETF, especially after Gary Gensler’s nomination for the SEC’s chairman position. Mr. Gensler taught courses on cryptocurrencies and appear to be softer on the sector, on the whole, than his predecessor Jay Clayton. Mr. Clayton is notorious for dragging many initial coin offering projects under the SEC’s controversial securities law, including Ripple Labs’ XRP token.

Matt Hougan, the chief investment officer of Bitwise Asset Management, which has sought to launch a Bitcoin ETF, believes the new derivative class could bring a lot more capital into the cryptocurrency market. North America’s first Bitcoin ETF in Canada has already amassed more than $1 billion in assets since its launch in February.

Mr. Spanos built his bullish narrative on a similar narrative, stating that the increasing count of companies seeking an ETF could Bitcoin to a new high of $70,000 by the end of April.

Bitcoin Technical Outlook

Technical indicators also point to a sustained rally towards $70,000 or beyond. One of them is Ascending Triangle, a bullish continuation pattern that is now in the process of logging a breakout move to the upside. The chart below shows the triangle.

Bitcoin shows signs of breaking out of triangle pattern. Source: BTCUSD on TradingView.com
Bitcoin shows signs of breaking out of the triangle pattern. Source: BTCUSD on TradingView.com

Anticipations are high about a breakout move above the Triangle’s upper trendline that would at least send the price to $70,000. Its overall upside target remains at $80,000, equal to the maximum distance between Triangle’s upper and lower trendline.

Photo by Waldemar Brandt on Unsplash 

Key XRP Technical Indicator Disagrees With Parabolic Price Rally

XRP, the Ripple blockchain’s native token, is up more than 600 percent in 2021 even though it remains in a tense court battle with the US Securities and Exchange Commission over its legal status.

The world’s fourth-largest cryptocurrency by market cap now, XRP has continued its climb, entering the second quarter. According to data provided by Messari, the token has surged around 194 percent in April alone. In comparison, its top rivals, Bitcoin and Ethereum, are up almost 6.5 percent and 12.5 percent, respectively.

If XRP’s upside acceleration continues, it can replace Binance exchange’s BNB token to become the third-largest cryptocurrency by market cap. BNB is up 65 percent quarter-to-date.

Bearish Divergence

But the rally in the Ripple token market comes on the heels of bearish alerts. One of the primary reasons XRP/USD could undergo a strong downside correction is a bearish divergence between its rising bids and decreasing momentum.

In retrospect, the Relative Strength Indicator (RSI) on XRP’s four-hour chart has formed a sequence of lower highs after topping out on April 5. On the other hand, its price has logged higher highs. Together, they indicate weakness in XRP’s uptrend, a phenomenon otherwise known as bearish divergence.

XRP is breaking of a Bullish Wedge pattern. Source: XRPUSD on TradingView.com

Bulls remain enthusiastic, nonetheless, partially because Ripple Labs, the San Francisco blockchain company behind XRP, has walked unharmed so far in an ongoing lawsuit filed against it by the SEC. That includes a recent court ruling that stopped the US agency from looking into the personal accounts of Ripple Labs’ chief executive Brad Garlinghouse and co-founder Chris Larsen.

Meanwhile, Ripple Labs recently won another court battle against one of its early-stage investors, Tetragon Financial Group. According to James K. Filan, a defense lawyer in the US, the ruling could serve as the basis to fight the SEC’s allegation against Ripple Labs. The agency alleges that the Ripple management sold illegal securities in the form of XRP tokens.

Technical Outlook

But technically, it is time for bullish traders to be proactive about risk assessment. That means using tighter stops, protecting options, or just reviewing their portfolio with assets that offset XRP’s overvaluation risks. It also looks ideal to short the XRP market by buying put options as a form of hedging exercise.

Ripple Labs has walked closer to beating the SEC, but the legal battle could go on for a while. Any uncertainty over XRP’s legal status — whether or not it’s a security token — would increase downside risks in the token’s market.

Bitcoin May Hit $100,000 Soon on “Wildly Bullish” Sentiment: Analyst

A flurry of optimistic updates hitting the Bitcoin market this Monday has prompted one analyst to see a speedier price rally towards $100,000.

Dr. Jeff Rose, the founder/CIO of Vailshire Capital Management, envisioned the flagship cryptocurrency at the six-digit valuation. At the core of his bullish analogy was a classic technical pattern brewing up on the BTC/USD daily chart. Nonetheless, Dr. Ross’s tweet arrived on the heels of other positive fundamental updates.

Why $100,000?

Based on the analyst’s technical outlook, Bitcoin trades inside a consolidation wedge, a pattern that developed after the cryptocurrency started trading sideways upon logging a massive move upside. He added that BTC/USD could hit a fresh record high within the next two weeks. Then, the pair would continue moving towards $100,000. Excerpts from his tweet:

“The two-month consolidation wedge continues with stable weekend price action. Macro view: Wildly bullish. On-chain analytics: Wildly bullish. Opinion: Break-out to new all-time highs likely within 1-2 weeks. Then blue skies until the $100k milestone.”

Bitcoin tests $60,000-61,000 area for a breakout move upward. Source: BTCUSD on TradingView.com

The upside outlook surfaced on the day that saw investors waiting eagerly for the launch of Coinbase Global Inc shares on the Nasdaq Stock Market. Coinbase is one of the world’s leading cryptocurrency firms, involved in the custodianship and trading services related to Bitcoin and other forms of digital assets.

A $3T Market Cap for Crypto Market

Many analysts see the direct listing as a free advertisement of cryptocurrencies on Wall Street, especially as the nascent assets continue to project themselves as alternatives to low-yielding traditional investments like the US dollar and government bonds. In return, many Wall Street firms have embraced or are in the process of embracing cryptocurrencies, with Morgan Stanley and Goldman Sachs offering their rich clients access to bitcoin investment funds.

The two-way communication has helped Coinbase to gain a private listing on Nasdaq. Investors who do not want direct exposure in the cryptocurrency market would tend to purchase the Coinbase stock (Ticker: COIN) to rather speculate on its trading fee-based earnings. That would mean institutional investors remain interested in the bitcoin price performance on the whole. More trading means more revenues for Coinbase. And a better revenue means better stock valuation.

“You got to buy $COIN when that deal comes,” said Jim Cramer. “This is a $2T market maybe going to $3T.”

MicroStrategy’s Another Bitcoin Bet

Atop the Coinbase news, MicroStrategy has further increased its exposure in the Bitcoin market by deciding to pay its board members in the cryptocurrency. The Nasdaq-listed business intelligence firm, which holds more than 91,000 BTC, announced Monday morning:

“In approving bitcoin as a form of compensation for Board service, the Board cited its commitment to bitcoin given its ability to serve as a store of value, supported by a robust and public open-source architecture, untethered to sovereign monetary policy.”

Bitcoin prices were trading just shy of $60,000 at the time of this press.

Photo by Thought Catalog on Unsplash 

Ethereum Institutional Interest is Rapidly Growing; Here’s What On-Chain Data is Showing

Ethereum is not getting flipped by Binance Smart Chain anytime sooner, shows on-chain indicators.

Blockchain analytics platform IntoTheBlock gathered data on Ethereum transactions with volumes greater than $100,000. The portal noted that the second-largest blockchain network processed $20.68 billion worth of transactions in the week ending April 11, leading to a record high volume transfer of $68.87 billion.

“These large transactions are representing over 77% of the daily on-chain volume,” it added.

Ethereum transaction volume in the US dollar. Source: IntoTheBlock

Increasing volumes on a blockchain point to its growth as a public ledger. Meanwhile, transactions carrying a larger capital points to transfers between wealthy entities. They could be exchanges, wallet services, and even institutional investors.

The last few weeks have witnessed Ethereum walking out of the shadows of Bitcoin as an alternative cryptocurrency and creating a niche of its own among institutional entities. The biggest example among all was Visa’s first stablecoin transaction via USDC, a token built atop the Ethereum blockchain.

A report published by CoinShares also noted that ETH-based investment products attracted $4.2 billion worth of capital inflows in the first quarter. Meanwhile, Grayscale Investments, a New York-based crypto-focused investment firm, increased its Ethereum holdings from 2.94 million ETH at the start of this year to 3.17 million ETH this April 12.

Ethereum Supply Crisis

Market sentiment analytics portal Santiment noted that increasing demand from “whales” — entities that hold a larger amount of cryptocurrency wealth — led to a supply crisis in Ethereum markets. Now, wealthy investors hold 68 percent of the total ETH supply in circulation. On the other hand, the number of Ethereum wallets holding anywhere between 10-10,000 ETH dropped to its lowest since September 2017.

Ethereum price trades above $2,100. Source: ETHUSD on TradingView.com

Santiment also noted constant ETH inflows into the liquidity pools of decentralized finance projects. It also noted declines in the amount of Ethereum tokens sitting inside exchange wallets. It pointed at a brewing supply crisis in the Ethereum market while its prices achieve a new historic high above $2,000.

“Another aspect that contributed to Ethereum‘s all-time this weekend was the fact that average fees have dropped back to a 5-week low,” added Santiment. “With fees back to an average of $11.08, this is the lowest since March 5th, allowing for an increased ETH utility.”

Ethereum transaction fees turns lower. Source: Santiment
Ethereum transaction fees turn lower. Source: Santiment

Some bottleneck catalysts continue to pressure Ethereum lower, such as the Binance Smart Chain’s increasing control over the blockchain space. Its native token BNB surged towards $650 on Monday, up more than 1,100 percent on a year-to-date timeframe.

Meanwhile, Ethereum’s extremely positive correlation with Bitcoin continues to pose risks to its decline under the top cryptocurrency’s influence. Bitcoin’s uptrend has paused near $60,000 against the prospect of a stronger US dollar.

Photo by Nick Chong on Unsplash 

Bitcoin Selling Pressure is Declining, Hints Key Glassnode Indicator

Even as the bitcoin market shows signs of bullish exhaustion after logging a 1,500-percent-plus upside move in the previous 13 months, all is not lost. Investors with a long-term growth outlook still want to hold onto the flagship digital asset, iterating their expansive bullish stance on it.

The analogy appears out of a chart from Glassnode, a blockchain analytics firm that determines Bitcoin’s market bias based on on-chain indicators. One of its benchmark offerings is a tracking tool that studies Bitcoin wallets based on their net position holdings. In retrospect, the lesser the wallet owners spend their bitcoin, the higher their bullish bias is.

Green Red Green

Lex Moskovski, the chief investment officer at Moskovski Capital, spotted the said tool — dubbed as Bitcoin Long-Term Holder Net Position Change — and noted that it flipped from red to green for the first time since October 2020.

Bitcoin Long-Term Holder Net Position Change. Source: Glassnode

The red bars in the chart above reflect higher transactional volume from holders’ wallets than to those who let the cryptocurrency sit ideal in their wallets. On the other hand, a green bar shows that more people prefer to hold bitcoin instead of transferring them to other addresses.

“Selling pressure is decreasing,” the analyst ruled out after studying the pattern.

“Taken at the face value this chart means compared to a month ago more coins have been added to LTH UTXO than have left them. I’d say this is bullish,” he added.

Why HODL Bitcoin?

The statements appeared as the Bitcoin price struggled to follow up to its previous parabolic move above $60,000. Rising US bond yields sapped investors’ short-term appetite for safe-haven assets and, in turn, made a beaten-down US dollar — a bitcoin nemesis — a more attractive asset to hold.

Bitcoin trades inside a bullish structure. Source: BTCUSD on TradingView.com

On the other hand, Bitcoin maintained its bullish bias even against a relatively stronger greenback. Its upside cues kept coming in the form of fresh institutional investments from MicroStrategy, a Nasdaq-listed business intelligence firm, and the foray of financial giants like Mastercard, PayPal, Visa, Bank of New York Mellon, Morgan Stanley, and Goldman Sachs into the cryptocurrency services sector.

Investors also anticipated growth in the Bitcoin sector after Coinbase, a US-based cryptocurrency exchange, received regulatory approval from the Securities and Exchange Commission to go public via a direct listing Nasdaq. That ensured further exposure for Bitcoin on Wall Street, leading many analysts to say that the cryptocurrency would rise to $100,000 by the end of this year.

Photo by Chris Liverani on Unsplash 

Bitcoin Reclaims $58K After Fed Underscores Continued Recovery Support

Bitcoin rallied on Thursday after the Federal Reserve vowed to support the economic recovery in the United States.

The benchmark cryptocurrency jumped 3.80 percent to $58,083 after declining two days in a row. Meanwhile, its rivals across the crypto space, including the second-largest token Ethereum and its runner-up Binance Coin, also surged higher. Almost all alternative cryptocurrencies have a positive correlation with Bitcoin.

Dovish Fed

Traders started flocking into the cryptocurrency sector after minutes from the Federal Reserve’s March meeting, released on Wednesday, which showed the central bank officials are optimistic about a sustained rebound in inflation. They committed to keep their easy monetary policies unchanged until employment recovers fully from the pandemic-led economic aftermath.

“Those big mental readjustments by the market contemplating the growth outlook and what that would mean for inflation have been fully digested,” said April LaRusse, head of investment specialists at Insight Investment.

The US dollar index, which tracks the greenback’s strength against six major foreign currencies, was initially firm to the Fed’s continued dovish stance. Nevertheless, it fell by 0.38 percent on Thursday, raising fears that the dollar might resume its downtrend after inching higher so far into 2021.

US dollar index turns lower after Fed commits loose monetary policies. Source: DXY on TradingView.com

Bitcoin, which does well when the dollar underperforms, rose inversely to the greenback’s performance in the previous 48 hours.  Tom Jessop, president of Fidelity Investments’ digital assets wing, noted that the cryptocurrency has now matured as a global investment asset, which might continue to get better in coming years.

“I think we continue to see adoption at an accelerated pace for a host of reasons,” he said at an event hosted by MarketWatch and Barron’s this Wednesday.

Bitcoin Technical Outlook

The BTC/USD exchange rate showed possibilities of breaking bullish above $60,000.

Bitcoin eyes ascending channel breakout. Source: BTCUSD on TradingView.com

The pair trades inside an ascending triangle, which is technically a bullish continuation pattern in an uptrend. Its breakout target sits as high as the maximum distance between its upper and lower trendline. Therefore, if bitcoin breaks bullish above the Triangle’s upper trendline resistance (around $60,000), it would target at least $70,000 as its next upside target.

Why This Trader Expects a Huge Binance Coin (BNB) Uptrend Forming

Binance Coin (BNB/USD) is bracing for a massive bullish move in the sessions ahead, a trend that could see the exchange token rise above $450.

The analogy comes from an independent analyst on Twitter, operating under the pseudonym of Crypto Kaleo to distribute day-to-day cryptocurrency updates across its 142,000 followers. Kaleo predicts a wild upside rally in the BNB/BTC instrument as he compares the pair’s current price movements with those last month — that led a parallel instrument, the BNB/USD, to its current record high of $422.

The Breakout Mood

In February 2021, BNB/BTC reached a new high in a breakout move that followed a consolidating move below a descending trendline and pattern top (0.0032 satoshis). After hitting 0.0067 satoshis as its breakout target, the pair started consolidating again under a new descending trendline pattern. Only this time, bulls waited for days before pursuing an upside breakout.

Later, the BNB/BTC pair consolidated near the level coinciding with its descending trendline top at 0.0067 satoshis.

“The first one back in mid-February went nearly vertical afterward,” said Crypto Kaleo, mentioning the chart as shown below. “I expect something similar here, though probably a bit slower considering the higher market cap/longer accumulation period prior.”

Notice how both ATH breakouts had massive wicks / shakeout candles. Source: BNBBTC on TradingView.com
Notice how both ATH breakouts had massive wicks/shakeout candles. Source: BNBBTC on TradingView.com

The analysis appeared as the cryptocurrency market, on the whole, risked correcting lower under Bitcoin’s influence. The BTC/USD exchange rate again failed to log a breakout move above $60,000. Traders unwound their upside positions to secure short-term profits and dropped the pair to as low as $55,400 on Wednesday. It was attempting to rebound this Friday, albeit with weaker volumes.

BNB’s fundamentals typically take cues from the Bitcoin market. The correlation efficiency between the two assets currently sits near 0.75. The general market consensus for Bitcoin is bullish. It means Binance Coin also has a likelihood of tailing the flagship cryptocurrency to its gains.

BNB/USD

Kaleo spotted more similarities in the BNB/USD price movements in February 2021 and right now.

Binance Coin outlook from mid-Feb. Source: BNBUSD on TradingView.com

and in April 2021:

Binance Coin outlook in April 2021. Source: BNBUSD on TradingView.com

“Extremely similar also,” Kaleo stated, “both accumulated/accumulating slightly higher than the ATH they recently broke. “Continuing to play out like the time above. I’m expecting a surge out of this range to a new all-time high and price discovery any time now.”

Kimchi Premium Puts Bitcoin Lower Ahead of Fed Minutes; What’s Next?

Bitcoin prices dropped lost 3.12 percent in early trading Monday, while the rest of the crypto market followed suit, turning lower aggressively after their record-setting bull runs at the start of this week.

Bitcoin wobbles around $56,000. Source: BTCUSD on TradingView.com

At first, it appeared like a regular profit-taking exercise among western day-traders against overvaluation risks. Nevertheless, blockchain analytics platform CryptoQuant noted that the sell-off appeared out of South Korea-based crypto exchange Upbit Global. It happened after a so-called “Kimchi Premium” indicator reached its three-year peak.

What is Kimichi Premium?

In retrospect, Kimchi Premium a metric which represents the difference in the bitcoin prices on South Korean exchanges and other global trading avenues. Arcnae Research analysts note that when the indicator peaks, it somewhat ends up blowing up the bitcoin bullish bubbles. The metric reached 47 percent in January 2018 and 63 percent in 2017, and followed up with vast price corrections in the global bitcoin market.

Bitcoin Kimchi Premium plunges alongside global price. Source: CryptoQuant

Nevertheless, Kimchi Premium formed dwarfed peaks of 6.5 percent in January 2018 and 63 percent in May 2019 — also leading to major bitcoin price corrections lower. As of this week, the metric peaked around 18 percent, before dropping lower during the European session Wednesday, as shown in the chart above.

“It seems someone finally figured out how to arbitrage this Kimchi premium opportunity,” said Ki-Young Ju, the CEO of CryptoQuant. “The trading volume in 30min time frame on Upbit Global, the largest Korean exchange, was bigger than Binance‘s. This drop seems related to Kimchi pullback.

Mr. Ju also told CoinDesk that the Kimchi Premium won’t impact the Bitcoin market like the previous times, noting that South Korea’s volume compared to the global one has significantly reduced — from 7.9 percent in 2017 to 2 percent.

Fed Minutes

Bitcoin also dropped below $56,000 during the US session Monday as investors awaited minutes from the Federal Reserve’s meeting in March to look for clues on how central bankers view inflation and US economic recovery speed.

Some investors fear that vaccine rollout, easing coronavirus restrictions, and the latest $1.9 trillion stimulus package would pent-up consumer demand, leading to a higher inflation. In turn, it would prompt the Fed officials to hike interest rates from near-zero earlier than 2024.

“When you have all this money that has been pumped into the system and into people’s pockets, but that hasn’t been spent yet, then you know inflation is going to come at some point,” said Brian Walsh, Jr., senior financial adviser at Walsh & Nicholson Financial Group.

Higher inflation prospects make the US dollar more attractive to foreign investors. Meanwhile, the greenback’s weakness tends to benefit Bitcoin.

Rich Dad Poor Dad’s Kiyosaki is Buying More Bitcoin Today, But Why?

People usually buy Bitcoin in hopes that they would be able to sell it to others for higher profits. But for a celebrated financial expert like Robert Kiyosaki, Bitcoin is an opportunity to break away from government surveillance.

The ‘Rich Dad Poor Dad’ author delivered a tweet Wednesday morning in which he said that he would buy Bitcoin because of his anxieties over “digital yuan,” a federally-controlled version of Bitcoin, put to trial by the People’s Bank of China on Tuesday after taking years for developing it.

Bitcoin versus Digital Yuan Battle Heats Up

In retrospect, Digital Yuan falls in the category of central bank digital currencies, or CBDC, whose sole purpose is to put a national currency atop a private blockchain ledger. Bitcoin serves in contrast as a decentralized cryptocurrency, managed by not one but hundreds of thousands of entities — aka miners.

As usual, no government or central bank gains control over Bitcoin’s source code, making it more independent than a regular CBDC.

But with China’s involvement in the CBDC space, things have become more about gaining virtual control over people’s financial lives. In his statements to the Financial Times, a Wall Street banker noted that President Xi Jinping’s authoritative regime would use digital yuan or digital renminbi to bring people’s everyday transactions under its radar — a thing it is already doing via its strict internet policies.

“The [digital renminbi] is heavily about the [Chinese Communist] party’s ability to exercise control,” also said Samantha Hoffman, senior analyst at the Australian Strategic Policy Institute.

Such fears alone have prompted people to opt for Bitcoin. While every transaction on Bitcoin’s blockchain is traceable, its backers tend to hide behind gibberish alphanumeric identities, thus gaining a thin layer of security from regulatory watchdogs.

Snapshot of a live transaction on the Bitcoin network. Source: BTC.com

Nevertheless, they risk being traced if even one entity in their long chain of bitcoin transactions reveals itself either by using a wallet that has gone through a know-your-customer process or just by practicing human negligence.

But…

…despite its limitation, Bitcoin appears better than a digital yuan to many. Mr. Kiyosaki is one among them.

“I would rather have Bitcoin than government fake surveillance crypto,” he said Wednesday. “Buying more [of the cryptocurrency].”

Shark Tank investor and software entrepreneur Kevin O’Leary also said in an interview with CNBC that he would rather buy Bitcoin than China’s “blood money,” citing carbon issues related to the cryptocurrency mining process in the country.

Many also see Bitcoin as a de-facto Chinese currency. More than 65 percent of the cryptocurrency’s mining pools/companies operate from China, according to Statista, giving the Jinping regime unprecedented — and potential — access to its supply to the rest of the world.

According to Mr. O’Leary himself, investors remain concerned about China’s excessive control of Bitcoin. They remain put off by the cryptocurrency, he noted.

The cost of one Bitcoin has increased twofold in 2021 due to institutional interest. The cryptocurrency was trading shy of $57,000 at the time of this writing.

Déjà vu: Bitcoin Setup Near $60K Looks Similar to $20K-Breakout Delay

Bitcoin is stuck near $60,000. Some analysts think the cryptocurrency would break the level to the upside and establish a new record high. Meanwhile, a section believes that the price would crash back towards $50,000.

Amid the conflicting scenarios, Dr. Jeff Ross, the founder/CEO of Vailshire Capital Management ̦— a Colorado-based hedge fund, believes the hint lies in a recent market fractal from late 2020. The investment analyst noted that Bitcoin is consolidating near $60,000 in the same way it traded near $20,000 between mid-November and mid-December 2020.

Bitcoin in December 2020 versus April 2021. Source: BTCUSD on TradingView.com

In retrospect, the BTC/USD exchange rate struggled to break out above $20,000 due to its historical relevance as an all-time high before bulls reclaimed it in a rally after December 15, 2020.

The upside break in December 2020 came amid increased demand for bitcoin among institutional investors. Their bids for the emerging safe-haven asset went higher as the gold prices declined. Banking giant JPMorgan noted in its report that the precious metal’s derailment boosted inflows into the Bitcoin market.

More tailwinds for Bitcoin came from PayPal’s foray into the cryptocurrency sector. The global payment service behemoth announced that it would offer users the option to buy, sell, and store bitcoin in their PayPal-backed wallets. Meanwhile, bullish sentiment remained buoyed by fresh investments from MicroStrategy, Ruffer Investments, and Square.

Cut to April 2021…

…Bitcoin has tripled in value amid similar fundamentals. US carmaker Tesla has added $1.5 billion worth of BTC into its balance sheet. Meanwhile, MicroStrategy has upped its bitcoin holdings with repeated buyouts. PayPal has also introduced a crypto-checkout option in a follow-up to its November announcement.

The macroeconomic scenarios have changed, but they have not affected the policies that helped Bitcoin rise so far. President Joe Biden increased the net US debt by launching a $1.9 trillion stimulus package. The Federal Reserve announced that it would keep rates near zero until 2024.

Therefore, not just technicals, the fundamentals catalysts that pushed the bitcoin prices up by more than 1,500 percent from their mid-March nadir last year are the same. Dr. Jeff stressed:

“The current sub-$60k consolidation is a similar setup to the (equally frustrating) sub-$20k period from Nov-Dec 2020. Macro view: Wildly bullish. On-chain analytics: Wildly bullish. Opinion: Breakout coming soon… and with force. Accumulate and HODL!”

Bitcoin’s next interim price target is $65,000.

Photo by Sharon McCutcheon on Unsplash 

Follow Up: BitTorrent (BTT) Crashes 40% After Logging Milestone Price Rally

Traders who bought BitTorrent at its top, believing that the Justin Sun-backed token would keep on pumping, are now facing huge intraday losses.

The BTT/USD exchange rate crashed by more than 40 percent after setting up a record high of $0.0134, questioning catalysts that prompted BitTorrent’s explosive upside move in the first place. Earlier, NewsBTC has raised alarms about an absence of concrete fundamental factors that should have been backing the BTT’s price rally. Excerpts:

“Traders might unload a portion of their BTT holdings to secure maximum profits. That could push the token towards its next downside target that lurks near its 20-4H exponential moving average (the green wave). If profit-taking intensifies, BTT will fall towards the blue wave target — the 50-4H simple moving average. That would wipe out almost most of the BTT’s 2021 profits.”

BitTorrent dumps more than 40 percent from its record high level. Source: BTTUSD on TradingView.com

Except, one factor, the so-called altcoin season, or altseason, attempted to justify BTT’s gains to a certain degree. Altseasons point to a growth in digital assets that rival the top cryptocurrency, Bitcoin. BitTorrent, an alternative cryptocurrency, gained almost in sync with other altcoins, including Ethereum, Binance Coin, Litecoin, XRP, and others, indicating that bulls were merely riding the upside craze.

Is BitTorrent Still Bullish?

BitTorrent’s downside correction did little in offsetting its long-term bullish bias. The BTT/USD exchange rate was still up more than 3,000 percent on a year-to-date timeframe. While that made the pair extremely overvalued — according to its one-day Relative Strength Indicator readings, the ongoing craze in the altcoin market indicated that it would find sessional support in the short term.

The BitTorrent official Twitter channel attempted to underscore the BTT’s bullish bias by announcing a flurry of development updates. It noted that the BitTorrent File System would increase network decentralization by guarding testing on both client and server ends.

Nevertheless, the BTT/USD rate started heading lower hours after BitTorrent’s tweets.

What now appears possible is that BitTorrent finds support either in its 20-4H moving average or its 50-4H moving average. If the token manages to sustain above those levels, its possibility of bouncing back will remain higher. Else, it would risk falling to near $0.001, the Feb-March support level.

Photo by Sven tillack on Unsplash 

5 Critical Bitcoin Trading Takeaways for This Week as Price Falls

Bitcoin opened this week in negative territory as its price wobbled around a key support/resistance level of $57,000.

The benchmark cryptocurrency was down 0.97 percent, trading for $57,639 ahead of the New York opening bell Monday. Its move downhill came as a part of a broader bearish correction that started after the price crossed $60,000 late last week. From then to this press time, the bitcoin price fell roughly 4 percent.

Bitcoin struggles to post a breakout above $60,000. Source: BTCUSD on TradingView.com

The cryptocurrency’s latest correction downhill marked the second time its price rejected breakout attempts above $60,000. In March, the BTC/USD exchange rate had declined by more than 18.50 percent after logging a record high of $61,778 (data from Coinbase). That increased the prospect of Bitcoin heading lower after the latest upside rejection.

Nevertheless, a pseudonymous analyst called the $57,000 level an “important point” to determine the bitcoin market’s next bias. He listed five critical factors that traders should focus on to guess where the price would head next, listed as follows.

#1, #2, and #3: Resistance Area, Ascending Triangle, and 50-EMA

Three technical patterns join together to provide Bitcoin a bullish setup this week: a resistance area that has faced repeated breakout attempts since mid-March; an ascending triangle structure that expects to shoot prices upward; and a 50-day exponential moving average that provides support to the overall short-term bullish bias.

Bitcoin trade setup, as presented by CryptoHamster. Source: BTCUSD on TradingView.com

As the analyst presented, Bitcoin needs to hold its Ascending Triangle support.

If the cryptocurrency fails to do so, a decline towards the 50-EMA would still protect its upside bias. Meanwhile, the resistance area, which somewhat operates as an upper trendline area for the Ascending Triangle pattern, would ultimately give up for a breakout attempt, shooting the BTC/USD rates upward by as much as the Triangle’s maximum length.

That would put the pair en route to $70,000. But for now, it risks declining towards $54,000 to test the 50-EMA.

#4 and #5: Descending Triangle on Bitcoin RSI, BB Width

The analyst spotted two anti-bullish indicators: a descending triangle on Bitcoin one-day Relative Strength Indicator and a very squeezed Bollinger Bands Width.

A declining RSI against a rising price medium-term alerted about a potential bearish divergence. That means that bitcoin’s upside momentum is slowing down. Traders may express their bullish exhaustion down the road.

Meanwhile, with Bolinger Bands Width lowering, it reflects declining price volatility in the Bitcoin market. That typically leads to a sudden trend explosion to either end: uptrend or downtrend. Coupling that with the bearish divergence alert, the maximum risk appears to be on the downside.

Photo by Nadine Shaabana on Unsplash 

Overvaluation Risks Haunt BitTorrent As Price Explodes 164% QTD

BitTorrent turned alarmingly overvalued on Monday as its price popped higher by as much as 164 percent quarter-to-date.

The BTT/USD exchange rate surged to $0.013, its highest level on record, after rallying seven days in a row. Every sell-off attempt met with an equally aggressive accumulation, prompting more and more traders to buy the Justin Sun-backed asset at intraday highs. The volumes soared likewise.

BitTorrent rally looks overblown. Source: BTTUSD on TradingView.com

The strong upside move pushed BitTorrent’s Relative Strength Indicator to 94.95, a reading that pointed to an extremely overbought asset. Typically, a higher RSI reading prompts investors/traders to unwind their holdings. As they secure their profits, the asset tops out and falls lower to find its next local support. In a worst-case scenario, it just crashes.

Fundamentals

It isn’t easy to estimate what could happen to BTT/USD. Many analysts agree that the BitTorrent token’s rally has surfaced without any concrete catalyst.

But Joseph Young, an independent cryptocurrency analyst, pointed that Justin Sun’s acquisition of Poloniex crypto exchange alongside other partners, followed by the introduction of BTT staking on the platform, might have boosted the BTT prices. Mr. Sun backs BitTorrent via his key business, the Tron Foundation. The Tron blockchain supports BTT.

Staking takes active token supplies out of circulation. If the demand for the concerned cryptocurrency increases alongside, it tends to increase its bids across spot markets. Earlier, Ethereum’s native token Ether also surged twofold against a similar catalyst.

But BitTorrent is not Ethereum, the project that supports more than 80 percent of the alternative cryptocurrency space atop its blockchain, including decentralized exchange UniSwap and Tether’s stablecoin USDT. That leaves traders in conflict about BTT’s next direction.

Mr. Young also asserted that the BitTorrent price boom has “no clear fundamental catalyst.”

BitTorrent Price Outlook

The maximum risk for BitTorrent moving forward appears to the downside.

BitTorrent eyes correction towards its 20-4H moving average. Source: BTTUSD on TradingView.com

Traders might unload a portion of their BTT holdings to secure maximum profits. That could push the token towards its next downside target that lurks near its 20-4H exponential moving average (the green wave). If profit-taking intensifies, BTT will fall towards the blue wave target — the 50-4H simple moving average. That would wipe out almost most of the BTT’s 2021 profits.

Meanwhile, a continued pumping phase could risk turning BTT into a bubble that could hurt the latest buyers the most. For now, the token needs a vast correction downhill to neutralized its overbought sentiments.

Photo by Felipe Souza on Unsplash.

Filecoin (FIL) Sells Off After Delivering Grayscale-Driven Bumper Rally

Filecoin dropped ahead of hitting its previous record high, near $273.57, prompted by profit-taking among traders.

FIL Market Outlook

The FIL/USD exchange rate slipped closed Thursday down 2.82 percent despite logging its second-best historic level of $239.94 in the same session. Traders started securing their profits at the local top amid falling bids, leading to a 22.65 percent decline ahead of the session’s end.

Filecoin stabilizes near $180 after its recent rally. Source: FILUSD on TradingView.com

Friday was slightly better as Filecoin attempted a brief rebound. The coin managed to float above its newfound support area near $180 while pursuing a retest of its recent high of $239.94. Its revival following the overnight sell-off appeared as a part of a broader uptrend across the altcoin market.

Read further: TA: Ethereum Revisits $2K, Why The Bulls Are Not Done Yet.

The price action showed investors’ continued trust in the Filecoin ecosystem. In general, it is a platform that allows users to sell their excess digital space on an open platform. Storage providers and users conduct traders over its blockchain using FIL token.

Meanwhile, FIL has a limited supply cap of 2 billion tokens. About 600 million of those FILs stay with Filecoin’s parent company Protocol Labs (with 6-year linear vesting) and its team and investors (again, with a 6-month to 6-year linear vesting). Meanwhile, Filecoin has allocated about 2.5 percent of the total 600 million FIL to fund its fundraising or ecosystem development.

The rest of the FIL supply powers the supply storage trades atop the Filecoin protocol, thereby ensuring that the token has a concrete utility and long-term value.

Institutional Accumulation Brings Retailers

New York investment firm Grayscale Investments introduced a Filecoin trust in March to its range of similar crypto-enabled services. In retrospect, the firm enabled institutional investors to gain exposure in the FIL markets without purchasing or managing the token. That prompted Grayscale to increase its FIL reserves, reflecting that institutions showed interest in the Filecoin project.

Grayscale Filecoin Trust increases FIL holdings. Source: ByBt.com

Two weeks after its introduction, Grayscale Filecoin Trust added 45,550 FIL to its reserves. The firm continued to hold it, showing no concrete selling pressure from institutions. That shows that the latest FIL plunge surfaced from the retail market.

Wu Blockchain, a fintech journalist, based in China, said the demand for FIL tokens is coming from the mainland.

“China is crazy for Filecoin, with a 24h increase of more than 30%, reaching a maximum of $236. The 24h trading volume of FIL in Huobi, China’s largest exchange, reached $24.2b, nearly three times the volume of the second ETH $8.8b, Bitcoin was $7.8b. FILDOWN, a short-selling leveraged token in Binance FIL, plummeted by 53%, with a turnover of US$3.4 billion, indicating a large number of short FIL liquidation in Binance.”

Photo by kaleb tapp on Unsplash 

Bitcoin Analyst Warns About “Overheated Retail Action” as Price Hits $60K

Bitcoin prices climbed above $60,000 for the first time in two weeks, raising prospects that the cryptocurrency would keep rising into the new quarter after closing the previous one almost 100 percent higher.

Nevertheless, analyst Robbie Liu noted that the recent Bitcoin rally has resulted from “overheated retail action.” The OKEx researcher highlighted rising premiums for the quarterly contract BTCUSD0625 that jumped from $3,000, or 5.7 percent, last Friday to its current $5,200, or 8.7 percent. The level was almost the same last month when Bitcoin had established an all-time high above $61,000.

“Following the rise in premiums are the funding rates for perpetual swaps, which began to rise midweek and have now reached over 0.15% per eight hours,” explained Mr. Liu. “These figures are certainly entering a more dangerous range.”

“If the price does not break out to the upside in a short period of time, then traders attempting to chase the rally high with high leverage will have to close their positions, thus putting downward pressure on the price,” he added.

Bitcoin quarterly futures price, spot index price and the basis difference
Bitcoin quarterly futures price, spot index price, and the Basis difference. Source: OKEx

More clues for an imminent downside correction came from Bitcoin’s margin lending ratio.

In retrospect, it is spot market trading data showing the ratio between users borrowing USDT versus borrowing BTC in USDT value over a given period of time. This week, it fell from 9.5 to 8.2, which indicated that leveraged spot traders are beginning to unwind their positions after securing profits.

“The current overheated bullish sentiment is already visible in several indicators from OKEx trading data,” added Mr. Liu. “If price cannot break the $60,000 psychological mark quickly, it is likely to form a bearish divergence on the RSI indicator for the four-hour chart, prompting a correction.”

Bitcoin Market Outlook

The latest rise in the Bitcoin market indicated stabilization after a strong upside rally earlier this week.

Traders grappled with the prospect of Joe Biden’s new government spending plan worth $2 trillion. They also took cues from PayPal’s decision to add a crypto-checkout option on its legacy platform and Morgan Stanley’s SEC filings that showed the investment banking giant revealing that it might allocate 25 percent of its institutional funds’ portfolios to cash-settled bitcoin futures and Grayscale Bitcoin Trust.

Bitcoin corrects lower after testing $60,000 as resistance. Source: BTCUSD on TradingView.com

“The ~$57,500 area rejected BTC in February, but it looks like BTC turned this exact same level into support a couple of days ago,” said a pseudonymous market analyst. “Now it’s about follow-through from here. And we’re seeing some follow-through today.”

Dogecoin Rallies After Elon Musk Commits “Literal Moon” to DOGE Bulls

Dogecoin rallied on Thursday after Elon Musk committed that he would send the meme cryptocurrency to the moon — literally.

The billionaire entrepreneur tweeted that SpaceX, a space technology company he owns, would take a “literal Dogecoin to the literal moon.” The cryptic message ignored to dwell into the hows and whys, but it was strong enough to send a bullish signal across the Dogecoin market. As a result, the DOGE/USD price exploded.

As of 0800 UTC, the pair was trading at $0.071, up 33.94 percent from its intraday opening rate. It looked obvious that traders played a prank of themselves by blowing Mr. Musk’s tweet out of proportion, given it arrived on April Fools’ day.

Dogecoin price rallies on April Fool's Day. Source: DOGEUSD on TradingView.com
Dogecoin price rallies on April Fool’s Day. Source: DOGEUSD on TradingView.com

Dogecoin is notorious for undergoing massive upside rallies over good-for-nothing factors. Last year, in July, a viral TikTok video urged daytraders to pump DOGE/USD bids to $1. The shenanigans were able to take the pair as far as 0.005 after pumping it by up to 155 percent in just three days of trading. It crashed by more than 50 percent after the social media-led buying frenzy.

A similar viral campaign surfaced in late January 2021. Dogecoin bulls pushed the prices by a whopping 1,299 percent in just two days of trading in a copycat rally, inspired by Redditors-led GameStop stock-buying mania.

The intraday upside rally originated from the same prankster bulls — on the day that celebrates pranks.

Dogecoin Pump or Dump Ahead?

The April Fool’s Dogecoin rally carries massive risks for traders who want to enter the cryptocurrency market at its sessional highs. A clear lack of concrete upside catalyst, coupled with a potential liquidity crisis, hints at a heavy profit-taking scenario ahead. In short, only traders with braver risk appetites could tread Dogecoin’s waters.

Dogecoin starts crashing. Source: DOGEUSD on TradingView.com

As of this press time, DOGE/USD was crashing down from its intraday high. It slipped by up to 15.52 percent ahead of the US session, breaking below a flipped support level of $0.06 to turn it back into support. The next downside target appeared at the mid-March resistance level near $0.05.

Photo by Maciej Ruminkiewicz on Unsplash 

Chainlink Hits $30 as Grayscale Adds 115,570 LINK to Its Reserves

Chainlink prices climbed higher on Thursday, rising by as much as 5.10 percent on the prospects of higher institutional adoption.

The LINK/USD exchange rate reached its previous week’s high of $30 before correcting lower during the early London session. Its uptrend majorly came as a part of a broader bullish trend across the altcoin market. Meanwhile, LINK received an additional upward boost from New York-based Grayscale Investments’s overnight buying spree.

Grayscale Goes Shopping

Data fetched by ByBt.com shows that the crypto investment firm bought 115,570 LINK tokens for its Grayscale Chainlink Trust from March 17 until April 1. That includes a 65,570 LINK purchase on Thursday, which coincided with a price pump in the Chainlink market.

Grayscale LINK holdings shoot up dramatically overnight. Source: ByBt.com

Technical indicators on the LINK/USD four-hour chart showed the pair trading inside an ascending rising wedge. The bids oscillated between two diverging bullish lines, providing traders ample opportunities to generate interim profits on each bounce from the lower trendline and pullback from the upper trendline.

Chainlink hints bearish reversal on ascending broadening wedge formation. Source: LINKUSD on TradingView.com

Nevertheless, Ascending Rising Wedges are bearish reversal patterns. Central Charts notes that the bullish-looking structure leads to a downside breakout in 80 percent cases. Should it happen, the LINK price could fall to as low as $25.

A 37% Chainlink chaiBreakout Theory

An analysis shared by Akash Girimath on FXStreet.com shows Chainlink in an extemely bullish state. The analyst noted that LINK/USD now trades inside a symmetrical triangle structure, which raises the pair’s possibilities of logging a 37 percent bullish breakout move should it break above the pattern’s upper trendline resistance.

“A bullish breakout above $30.3 could push LINK to $41.6, but a breakdown of the lower trend line at $25 might result in a sell-off to $15.7,” noted Mr. Girimath.

Chainlink symmetrical triangle outlook, as presented by Akash Girimath. Source: LINKUSDT on TradingView.com

Other cryptocurrency analysts also presented a bullish outlook for Chainlink, with Michaël van de Poppe, a Netherlands-based stock trader, highlighting LINK’s growing strength against its top rival bitcoin. An asset’s value against the dollar tends to rise faster if it grows against bitcoin, as well.

Chainlink trade outlook against bitcoin, as explained by Michaël van de Poppe. Source: LINKBTC on TradingView.com

“LINK is most likely bottomed out in the BTC pair,” said Mr. Poppe.

More bullish tailwinds from on-chain data fetched by Santiment, a cryptocurrency sentiment tracking service. The platform noted that the number of rich Chainlink wallets hodling anywhere between 100 and 100,000 LINK tokens rose throoughout March, pointing to a higher buying sentiment.

“Chainlink knocked on the door of $30 for the first time in 11 days, climbing to $29.99 on Binance and still within close range. We’re keeping an eye on mid and large holders owning between 100 to 100k LINK, as they’ve accumulated greatly in March.”

Photo by Julian Hochgesang on Unsplash

Bitcoin Flash Crash Pauses as Goldman Sachs Announces Crypto Services

Bitcoin underwent a mini flash crash on Wednesday as its price fell from $59,400 to nearly $57,000 in just five minutes of trading.

Analysts blamed overleveraged long positions for the downside move, with the plunge liquidating about $600 million worth of extended bullish contracts across major futures exchanges. The wipeout followed up with a short sustainability period as Bitcoin maintained a short-term price floor at around $58,000.

Bitcoin vows to retest $60,000-breakout. Source: BTCUSD on TradingView.com

Heading into the US session, the flagship cryptocurrency mostly wobbled between profits and losses. Some respite to bulls came from Goldman Sachs, which announced that it would soon offer its first investment services for bitcoin and other cryptocurrencies to clients of its private wealth management group.

Anti-Inflation Narrative Picks Momentum

Mary Rich, global head of digital assets for Goldman’s private wealth management division, confirmed in an interview with CNBC that they would offer clients a “full-spectrum” of cryptocurrency investment services, “whether that’s through the physical bitcoin, derivatives, or traditional investment vehicles.”

The announcement followed a similar move by Morgan Stanley that earlier this month included three bitcoin funds to its list of investment services, enabling its wealthy clients to access the nascent cryptocurrency industry whose valuation has grown thousand-fold during the coronavirus pandemic.

Investors flocked to Bitcoin and similar assets owing to their promise to act as hedges against inflation caused by central banks’ ultra-loose monetary policies and governments’ ballooning debt problems. Many, including Tesla, equated bitcoin to a store of value like the US dollar, which lost more than 13 percent of its value last year.

“There’s a contingent of clients who are looking to this asset as a hedge against inflation, and the macro backdrop over the past year has certainly played into that,” Ms. Rich further explained. “There is also a large contingent of clients who feel like we’re sitting at the dawn of a new Internet in some ways and are looking for ways to participate in this space.”

What Bitcoin Analysts Think

Most calls that appeared after the Goldman Sachs story was bullish.

A pseudonymous investment analyst on Twitter noted that Bitcoin’s latest decline appeared as a pause before the cryptocurrency resumes its upward momentum.

“BTC experienced a -26% retrace after rejecting from ~$57500 in February,” he noted. “Then BTC experienced a -18% retrace after rejecting from ~$61K in mid-March. “Key takeaways: BTC is rallying higher after each retrace; [and] it enjoys shallower retraces upon rejection at higher prices.”

Bitcoin was inching back towards $60,000 in the early New York session.