The assets include a loan portfolio, mining rigs and infrastrsucture and cryptocurrency worth as much as $2 billion.
Algorand (ALGO) Price Turns Positive, Bulls Eyeing Further Gains?
Algorand (ALGO) has recovered from the bearish trend seen at the end of February 2023. From February 21 till May 8, ALGO recorded a loss of 45.13%, dropping to a low of $1.592. Despite the crash, buyers still pushed up the price of ALGO by more than 6% in the past few days.
Traders are optimistic and are eyeing the next move in the current trend, while the bears are slowing building momentum by holding their strong short position.
Will The Bulls Maintain This Current Bullish Momentum?
The sustainability of ALGO’s current price trend relies on several factors. Market conditions, such as supply and demand dynamics, overall economic factors, and external events, can generally influence the price.
However, the current market sentiment is bullish, while the Fear & Greed Index is 45, indicating neutral. This means the market’s state is stable, and the volatility is not high.
Within the last 24 hours, Algo’s general market cap gained 1.57%, rising to over $1 billion. The 24-hour trading volume surged by 15% overnight, rising to about $33 million.
Notably, at the time of writing, the ALGO token is trading at $0.1683 as bulls continue to have a good day with gains of 2.50%.
However, the recent increase in ALGO’s general market suggests increased demand for the asset. As more investors and traders buy the asset, the increased buying pressure can lead to a rise in its price. The increase in trading volume suggests improved liquidity for the asset, which tend to attract more investor to the market.
ALGO Technical Analysis
The price is below the 200-Day and 50-Day Simple Moving Averages (SMA). This suggests that ALGO market sentiment is still bearish; the selling momentum is stronger than the bull’s buying momentum.
However, the asset might rebound if the bulls increase their momentum, as green candles are showing today in the chart. The Relative Strength Index oscillator is showing 40.18. This means the asset is currently at neutral levels; the pressure from bulls and bears is normal.
Also, MACD is currently above the signal indicating a potential uptrend. The histogram confirms the bullish sentiment as its showing green candles and also above zero.

ALGO trades between its primary support and resistance levels of $0.1587 and $0.1853, respectively. The next key zones are the support level – $0.0992 and the resistance level – $0.2427.
Recent Development In The Algorand Ecosystem
Alogrand recently introduced a new plugin-based tool for enhancing Blockchain Data Access named Conduit. Conduit aims at providing improved access to blockchain data. It is an upgrade to the conventional one-size-fits-all Indexer, designed as a modular plugin-based tool.
This plugin empowers decentralized applications (DApps) by offering precise and tailored data retrieval capabilities, all while maintaining cost-effective deployment options. Such developments on the network could increase adoption and utility and, in time, boost ALGO’s price.
Featured image from Pixabay and chart from Tradingview.com
Algorand Foundation Among Creditors Opposing Restructuring of Troubled Crypto Exchange Hodlnaut
Several of the largest creditors of troubled Singaporean crypto exchange Holdnaut have indicated that the want the company to be placed in liquidation as opposed to a restructuring, according to an announcement.
Algorand Aims to Help Developers Transition to Web3 With AlgoKit
The tool suite was designed to be an easy onramp for web2 developers transitioning to web3 and developers from other chains who want to test out Algorand.
The Algorand Foundation Branches Out to India
Blockchain protocol Algorand (ALGO) has entered the world’s most populous country, India, with a project that aims to support the nation’s transformation from the back office of the Web2 world to the innovation hub of the Web3 world.
Coinbase and Algorand give divergent reasons for staking reward suspension

Algorand Foundation CEO said the crypto exchange is evaluating its products and services after receiving a Wells Notice. Coinbase denies the claim.
Crypto Exchange Coinbase Suspends Algorand Staking Rewards
Coinbase did not give a specific reason for terminating the rewards.
Algodex reveals wallet infiltrated by ‘malicious’ actor as MyAlgo renews warning: Withdraw now


Crypto exchange Algodex and wallet provider MyAlgo have both suffered security breaches in the last few weeks.
Layer 1 Blockchain Protocol Algorand Hires Its First CFO

The new CFO, Matthew Commons, had several years of crypto and TradFi experiences.
Algorand Wallet MyAlgo Struck by $9.6M Exploit

MyAlgo, a wallet for blockchain protocol Algorand, has advised users to withdraw funds it was struck by an exploit last week.
MyAlgo users urged to withdraw as cause of $9.2M hack remains unknown


The Algorand wallet provider said it still hasn’t determined the cause of the attack, urging users to withdraw funds from wallets created with a seed phrase.
Algorand to drive Web3 adoption in India through key partnerships


Algorand has partnered with several educational institutions and schools to create programs for faculty members, students and businesses looking to jump into Web3.
Bitcoin, Ethereum and select altcoins set to resume rally despite February slump


Bitcoin and select altcoins such as ETH, OKB, ALGO, and THETA may extend their up-move after a brief correction.
Algorand TVL Hits $177 Million As Altcoin Rally Continues – Can ALGO Sustain This Push?
Algorand is one of the fastest growing crypto in terms of gains. According to CoinGecko, the token has appreciated by 30% in the last two weeks. With the broader crypto market rallying as Bitcoin breaks its crucial $21,000 resistance, ALGO is set to gain more in the next few days.
The Total Value Locked department is where the ecosystem gained the most. According to DeFiLlama, Algorand’s TVL yesterday hit $177 million in value. This uptick in TVL is a bullish indicator that the ecosystem still has the momentum to reach new milestones.
However, the token might be on shaky ground as the bears test its current support at $0.2275.

Algorand Developments On-Chain
Algorand’s G6 governance commitment period ended yesterday, January 16. According to Algorand blockchain explorer, AlgoExplorer, more than 4.1 billion ALGO is staked by over 31,763 governors.

The ecosystem would pay back the governors with an annual return rate of 6.52%. This way of governance makes the Algorand ecosystem stay true to the tenets of decentralized finance. To add to this bullishness, the ecosystem also processed its 1 billionth transaction.
With the ecosystem able to handle more than 2,881 swaps on-chain, Algorand is expected to continue growing in popularity.
Did you know Algorand can handle over 10x the number of AMM swaps per second relative to #solana #Avalanche #polygon #bsc #celo #ethereum? $sol $matic $algo $bsc $eth
pic.twitter.com/7hBmduanfM
— Axetrax (@Axetrax22) January 14, 2023
Can ALGO Continue Its Climb?
The token is currently trading at $0.2329, a nearly 1% decrease from yesterday’s $0.2341 price. The rejection at $0.2418 would delay ALGO’s recovery. With the token’s support at $0.2365 broken, ALGO investors should be able to buy the current dip in price as analysts are still bullish with the token’s price movement.
With improving macro trends, investors and traders are more likely to enter riskier assets like cryptocurrencies. Not to mention that Bitcoin, the face of the crypto market, has broken through crucial resistance at $21k. With ALGO’s high correlation to BTC, ALGO can ride Bitcoin’s rally to reach higher highs.
Investors and traders should watch the current market situation of ALGO as the token’s current price position as the ecosystem has been having trouble maintaining a social presence.
ALGO holders should also watch Bitcoin’s price rise in the next few days or weeks. The $21k resistance break wiped out the lost ground following the collapse of FTX. If BTC continues its bullish recovery in the next few weeks or days, ALGO can ride the upward wave.
But with the token facing a slight correction, this bullish break might be delayed as the bears retest the current support at $0.2275. If the bears win the struggle, the token’s recovery will inevitably be delayed.
Featured image from ThoughtCo
Hodlnaut creditors reject the restructuring plan, prefer liquidation


Hodlnaut downplayed its exposure to the Terra ecosystem, but an investigation into the embattled crypto lender shows it lost $190 million in the Terra crash.
What’s Next For Algorand Price As Coin Continues Downtrend?

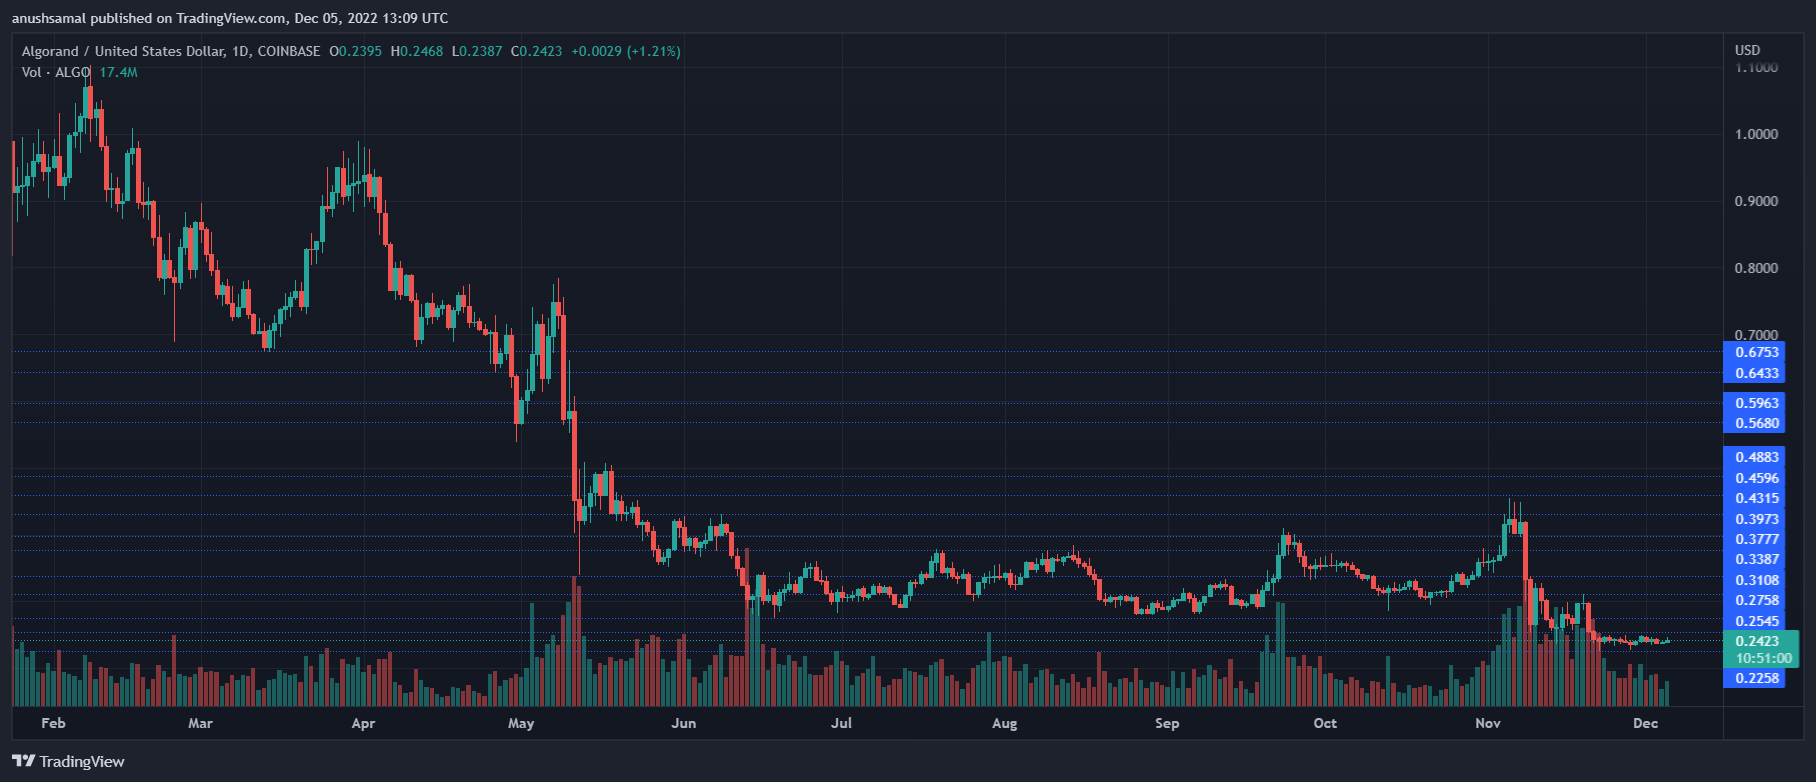
The Algorand price has been downward for quite a few months now. The coin has fallen by 1.8% over the last 24 hours. The coin has lost over 4.7% of its market value in the past week. Algorand had been consolidating on its chart over the last few weeks, but the consistent lateral trading has pushed the bulls out of the market.
The technical outlook has sided with the bears, with no clear indication of the price turning around in the coming trading sessions. Ever since ALGO lost the $0.28 price level, the coin has been unable to stop its downtrend. The aforementioned price floor acted as a crucial level for the altcoin. The Algorand price has also remained unaffected by positive changes in major market movers’ prices.
Since the altcoin was rangebound for a while, buyers lost interest and rushed to sell the altcoin. Algorand has lost over 30% in the month of December itself. At the time of writing, the ALGO price is 96% below its all-time high from 2021. The market capitalization of Algorand has witnessed a considerable decline, indicating that sellers have completely taken over the market.
Algorand Price Analysis: One-Day Chart
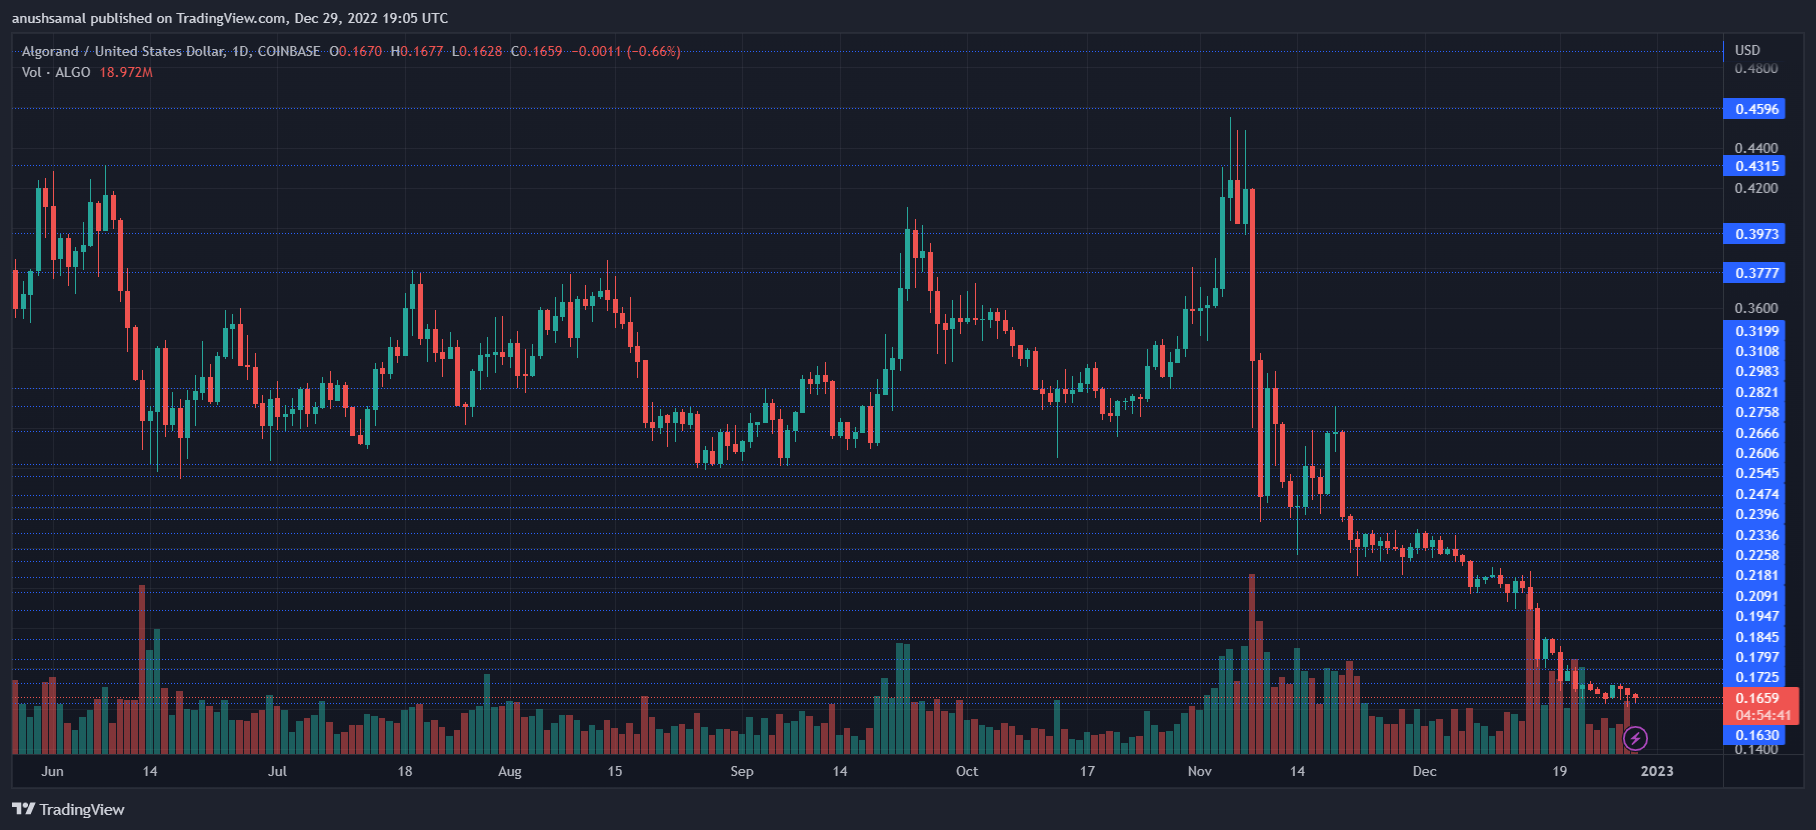
ALGO was auctioned for $0.166 at press time. The immediate resistance for the altcoin was at $0.172. The coin has attempted to test the overhead price ceiling, but the bearish strength has taken over the market. Since demand for Algorand has fallen substantially, the altcoin can fall to $0.163 before the price reverses itself.
This could present traders with a shorting opportunity. Two crucial resistance levels were at $0.177 and then at $0.181. Moving above the $0.181 mark will help the coin target the $0.20 price. On the flip side, a fall from the present price level will bring the Algorand price to the $0.15 zone. The amount of ALGO traded in the last session was red, indicating a high selling volume at the time of writing.
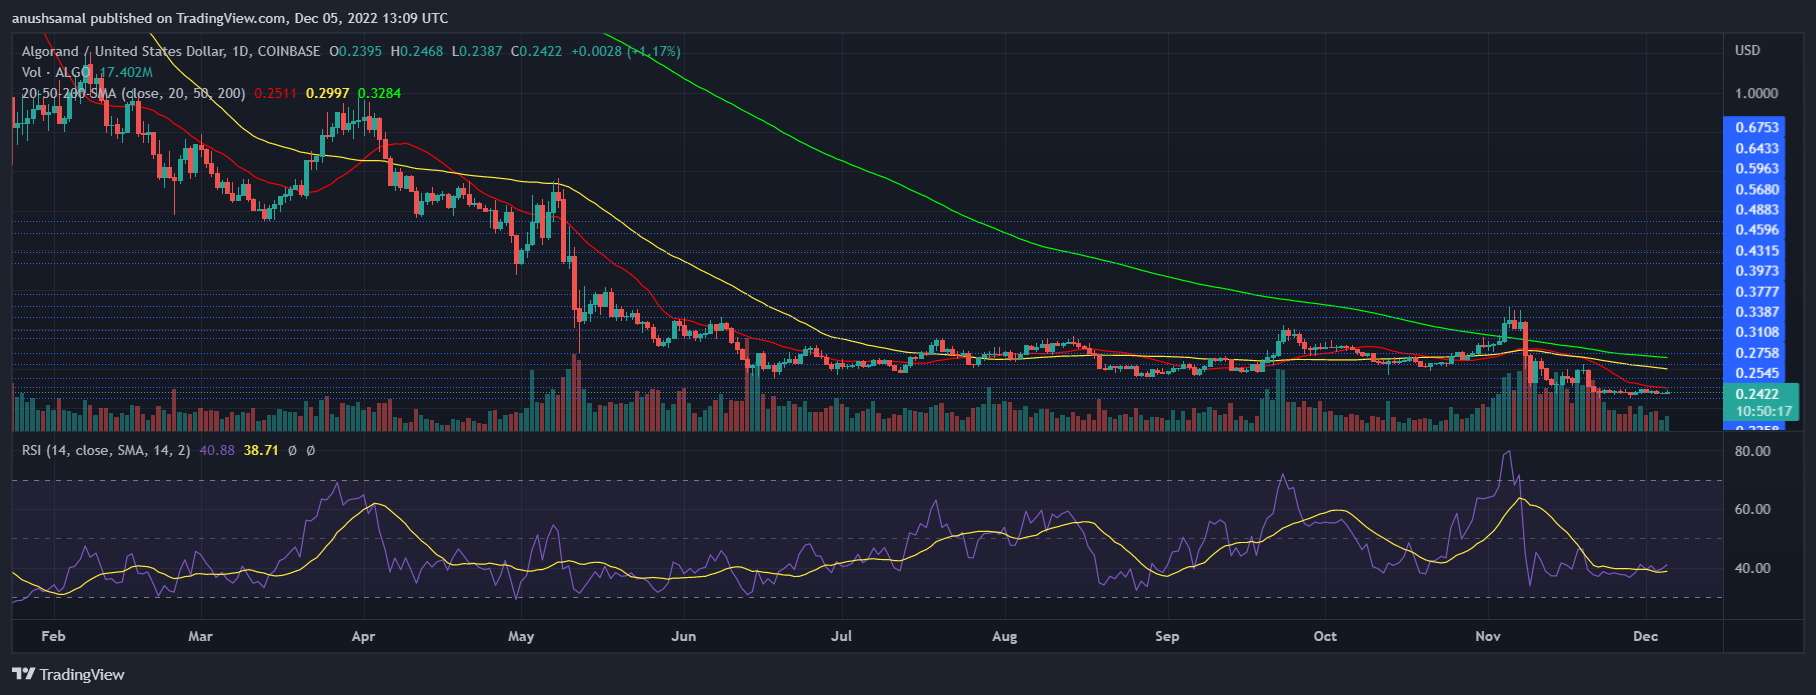
Technical Analysis
The altcoin has depicted a death cross at the end of November, which is an extremely bearish signal. A death cross occurs when the long-term moving average moves above the short-term moving average.
In the case of the Algorand price, the 50-Simple Moving Average (SMA) had crossed over the 20-SMA line. Ever since the death cross, ALGO has been under the grasp of sellers.
The Relative Strength Index stood on the 30-line, a sign of the asset being oversold and undervalued. Similarly, the Algorand price was below the 20-SMA line as sellers continued to drive the price momentum in the market.
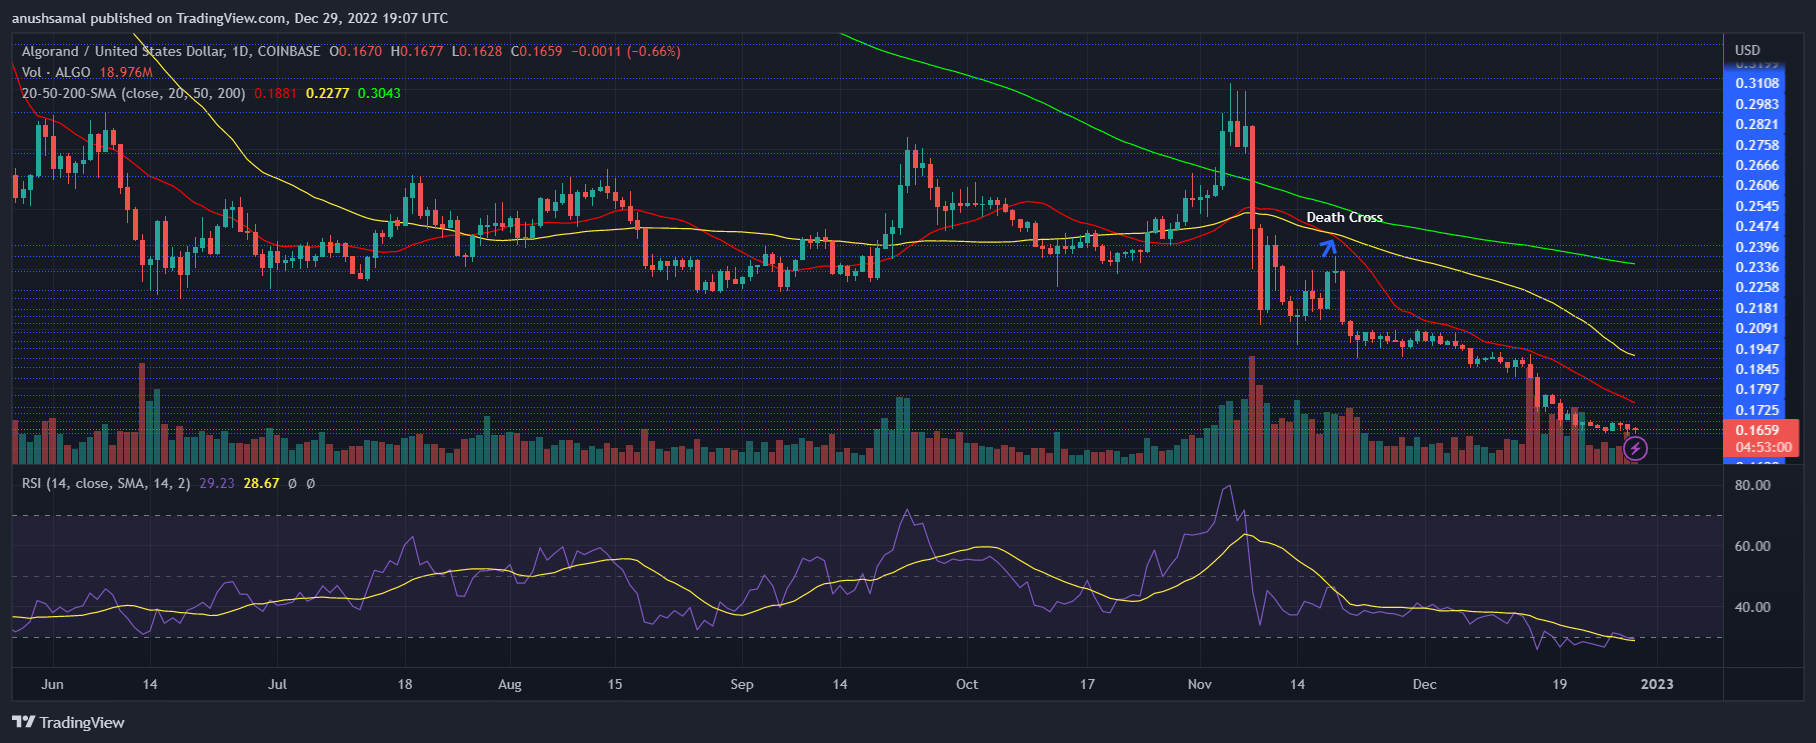
Although all indicators pointed toward bearish strength, the Moving Average Convergence Divergence (MACD) indicator displayed green signal bars. MACD indicates price momentum and reversals; the green signal bar was tied to buy signals.
This could mean buyers can re-enter the market now as ALGO could reverse its price. However, it is completely uncertain if ALGO will recover soon. The Parabolic SAR suggests the price direction. The indicator formed dotted lines above the candlesticks, which meant a continued downtrend for the asset.
Why ALGO Has Been Stagnant In Last 10 Days And Still At The Mercy Of Bears
ALGO, an altcoin by the Algorand blockchain with a market cap of $1.18 billion, continues to feel the effects of the intense selling pressure that caused its price to crash last month.
After trading within a narrow region from May to November that saw it establish $0.28 as its range low, the cryptocurrency devalued by 34% in December and found itself going all the way down to $0.163 – a marker that ended up being the asset’s current support zone.
ALGO, which has not made any significant increase in price in the last 10 days, is at the mercy of bears that are in control right now, threatening to push the digital coin’s value to $0.15 or even lower.
Technical indicators such as Relative Strength Index (RSI) and On-Balance Volume (OBV) are also currently favoring sellers, indicating that Algorand is headed into another bearish trajectory.
Algorand Paints Its Charts In Red
At the time of writing, investors and holders of the crypto asset has no reason to be happy as it remains in the “red zone” in all its price gauges.
According to latest tracking from Coingecko, ALGO is changing hands at $0.165, nearing its newly found support zone of $0.163.
Over the last 24 hours, the altcoin has gone down by almost 3% and is looking at a weekly decline of 4.7%.
On longer time frames, Algorand has declined significantly, dumping 25.6% of its value during the last two weeks and also losing 30.4% over the last 30 days.
Indeed, the cryptocurrency was among the many altcoins that struggled to gain their momentum back following the effects of the market-crashing collapse of the FTX cryptocurrency exchange.
ALGO A Viable Investment?
Guy, the pseudonymous host of Coin Bureau was recently interviewed and asked about the top digital coins that could prove to be a profitable for investors during a recession.
The host named Algorand as one, saying that its blockchain has put itself in a very good and strong position for the highly anticipated coming of the next crypto bull market.
“Algorand is a really interesting play for the next bull market. I think we could see a lot of really cool, interesting, really successful projects develop in its ecosystem during that time,” said Guy.
The Coin Bureau personality also noticed that there seems to be many developments in the asset’s network and there is a strong community backing it.
Meanwhile, Cosmos (ATOM), Arweave (AR), Osmosis (OSMO), Juno (JUNO) and Aave (AAVE) were also picked by Guy as potentially good investment in times of a recession.
–
Featured image: Forkast News
AVAX Eyes The Next Resistance, Is It Time To Go Long?

The Avalanche (AVAX) price has been undetermined for quite a number of weeks now. The altcoin is now logging gains on the daily chart as it rose over 3% in that time frame. The coin shows signs of optimism ever since it moved up from the $12.90 support mark.
The technical outlook for AVAX displayed signs of demand and buy signals for traders. If demand continues to rise and buying sentiment increases over the immediate trading sessions, the chance of AVAX piercing through other resistance levels will strengthen further.
As the coin continues to secure higher highs and higher lows, the bulls still remain in charge of the asset. However, if AVAX starts to consolidate below the $13 price level, then the altcoin can register depreciation.
Progressive price momentum demands AVAX breach the $14.30 resistance mark. Once AVAX successfully manages to challenge that level, the bulls will stick around for longer. The market capitalisation of the altcoin already registered an upsurge which is tied to an increase in accumulation.
Avalanche Price Analysis: One-Day Chart
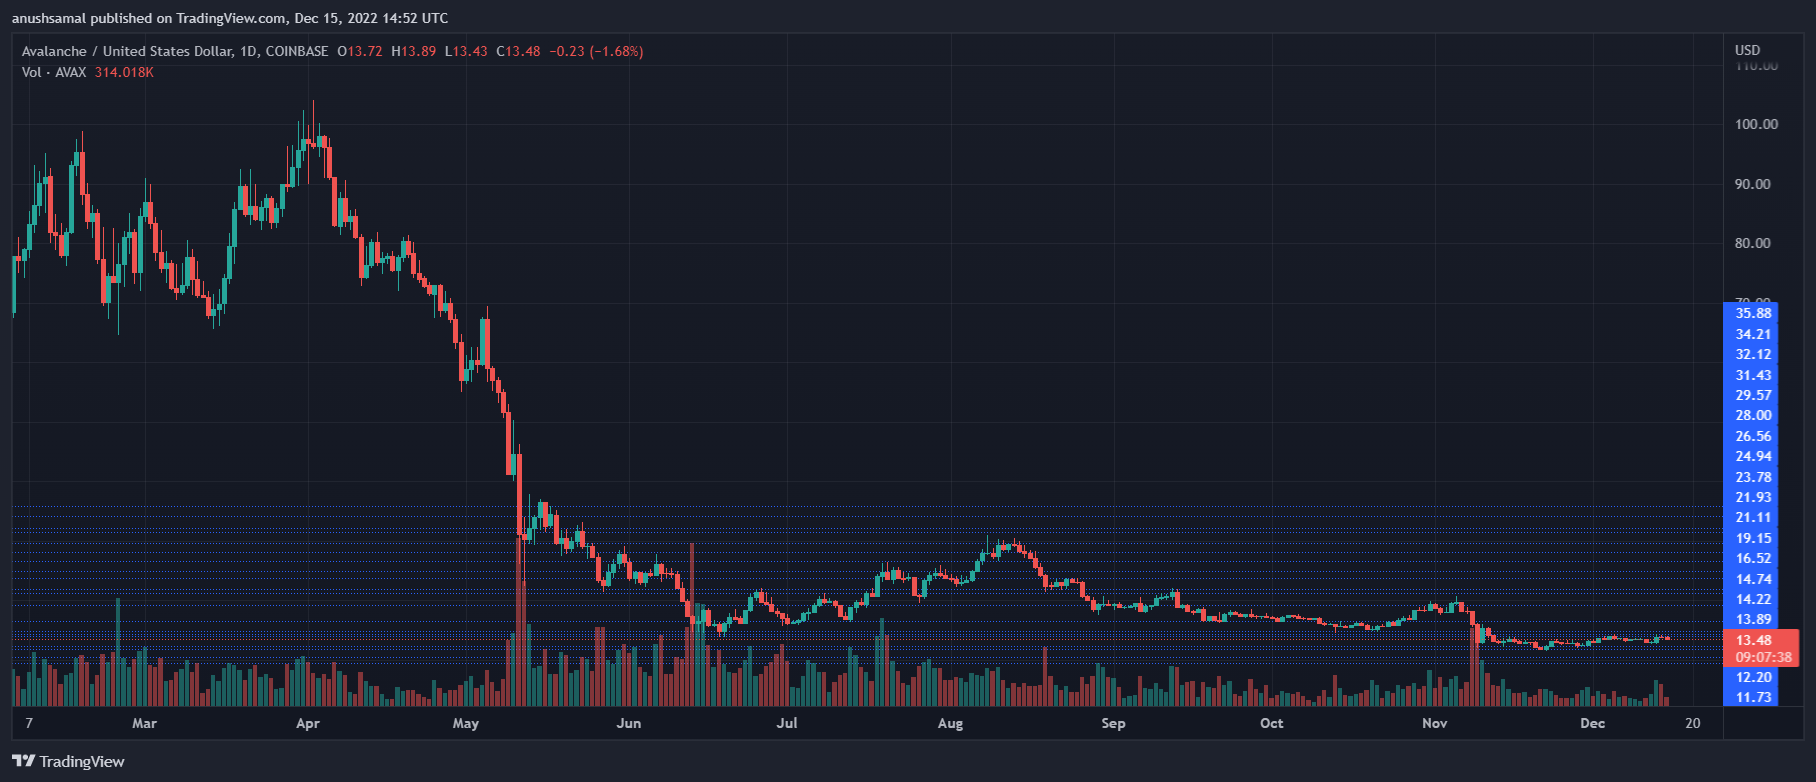
The immediate overhead price ceiling that Avalanche price needs to breach stood at $13.90. This move would ensure another rally to $14.60. Once the coin moves past that level, accumulation will increase considerably.
Traders had ample entry points in the market; for instance when AVAX dipped to $12. Over the upcoming trading sessions, investors can manage to see returns on the chart.
On the other hand, if due to lack of demand AVAX starts to consolidate, the next level for the coin would be at $12.20 and then to $11. This would mean an 18% fall in price for AVAX.
AVAX was trading at $13.48 at the time of writing.
AVAX Technical Analysis
Although the technical outlook pointed to positive price action, demand slightly fell on the daily chart. The Relative Strength Index (RSI) just dipped a little and rested on the half-line. This meant that buying power and selling strength were even.
Other indicators have, however, sided with increased demand. The altcoin was above the 20-day Simple Moving Average as it crossed the $13.40 price mark. This was an indication that the buyers were still driving the price momentum in the market.
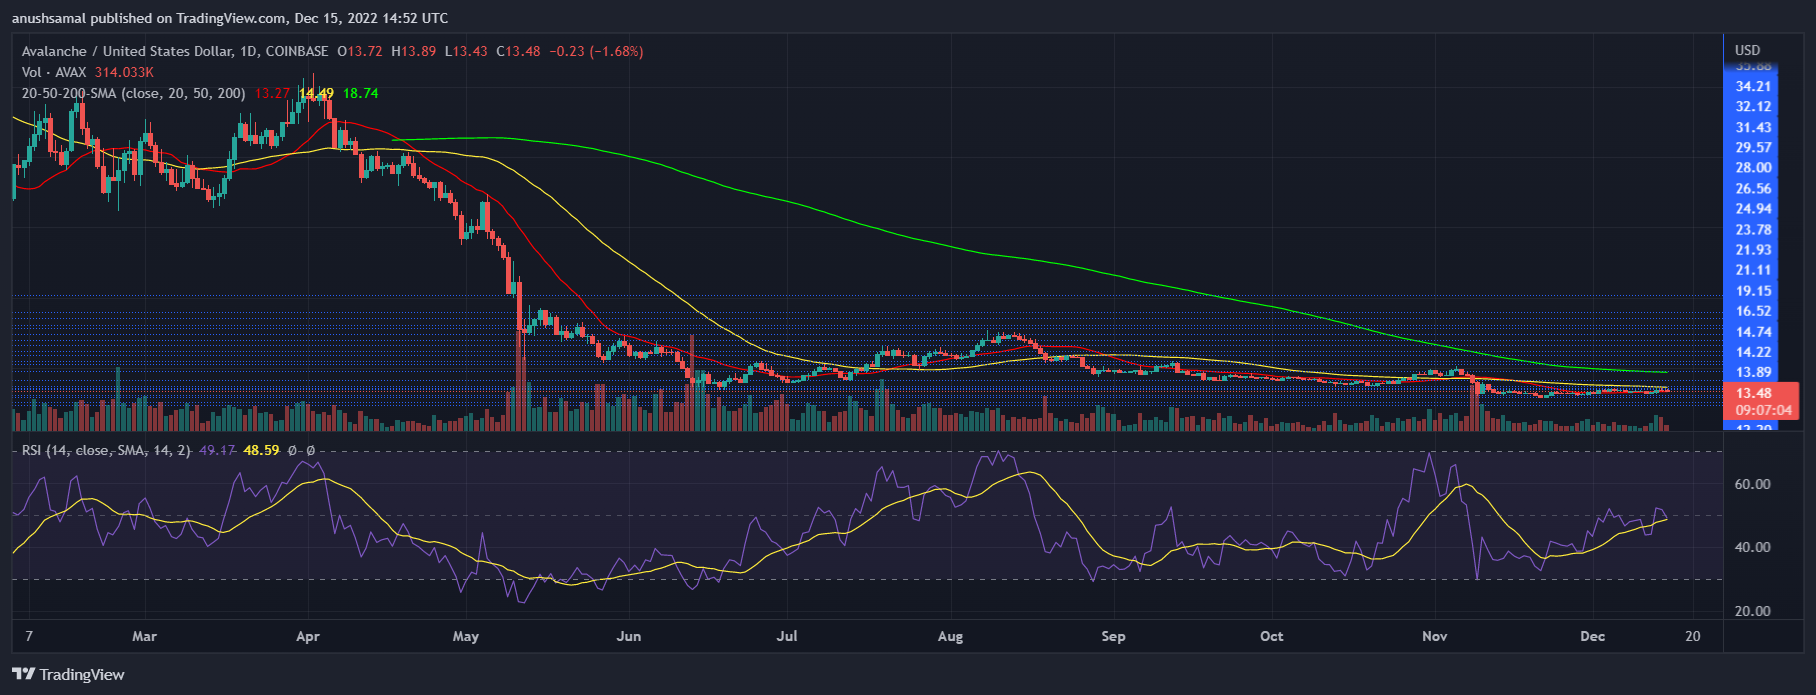
Despite the RSI remaining neutral, other indicators have depicted that bulls were still fighting to push the price above $13.60. The Moving Average Convergence Divergence defines the price momentum and trend reversal.
Related Reading: Ethereum Active Addresses At Highest Since May 2021, Good News For ETH?
MACD underwent a bullish crossover and that meant a buy signal for traders which could also correlate with an incoming increase in price for the coin. The Parabolic SAR determines the price direction. The indicator formed dots below the price candlestick which suggested an uptrend for Avalanche price.
Buyers Rule Over Algorand’s (ALGO) Price Action, Enough To Break Above $0.26?
The Algorand price has been positive over the last 24 hours. Despite minor gains, the altcoin has been moving north. There have been many updates in Algorand’s ecosystem, which might have brought in a slight appreciation in price. As bulls slowly return to the market, investor interest has also shot up accordingly.
The technical outlook of ALGO has depicted that the buyers were dominating the market at the time of writing. Recently, Algorand’s developments have made it compatible with Cardano, which has created more liquidity injection into the ecosystem. This development could encourage venture capitalists to inject more liquidity into Algorand, thereby reflecting positively on its price.
Algorand price depicts positive predictions, but it must be remembered that ALGO’s ecosystem is developing. ALGO’s price appreciation is a matter of time as more applications get developed on the platform. For ALGO to topple above the $0.26 resistance mark, buyers have to garner further strength.
Algorand Price Analysis: One-Day Chart
ALGO was auctioning for $0.24 on the one-day chart after it noted a 1.9% appreciation. At the current moment, it can be said that Algorand is consolidating below its immediate resistance of $0.26. A move above the aforementioned price level will ensure that the altcoin can rally to $0.31.
Algorand will lose its current support level unless buying strength increases significantly. In such a case, the nearest support floor for the altcoin was $0.22. The amount of Algorand traded in the last session noted a substantial increase, which indicated that buying strength was shooting up.
Technical Analysis
Buyers’ interest has returned to the market as the altcoin has started to climb on its chart. The Relative Strength Index spent most of the month in the selling zone, but there had been a recovery on the indicator at press time. For ALGO to touch $0.26, the RSI has to travel above the 50-mark.
Similarly, although the Algorand price was progressing upward, it was still below the 20-Simple Moving Average line. With slight accumulation, Algorand would topple above the 20-SMA line. Sellers are currently driving the price momentum.
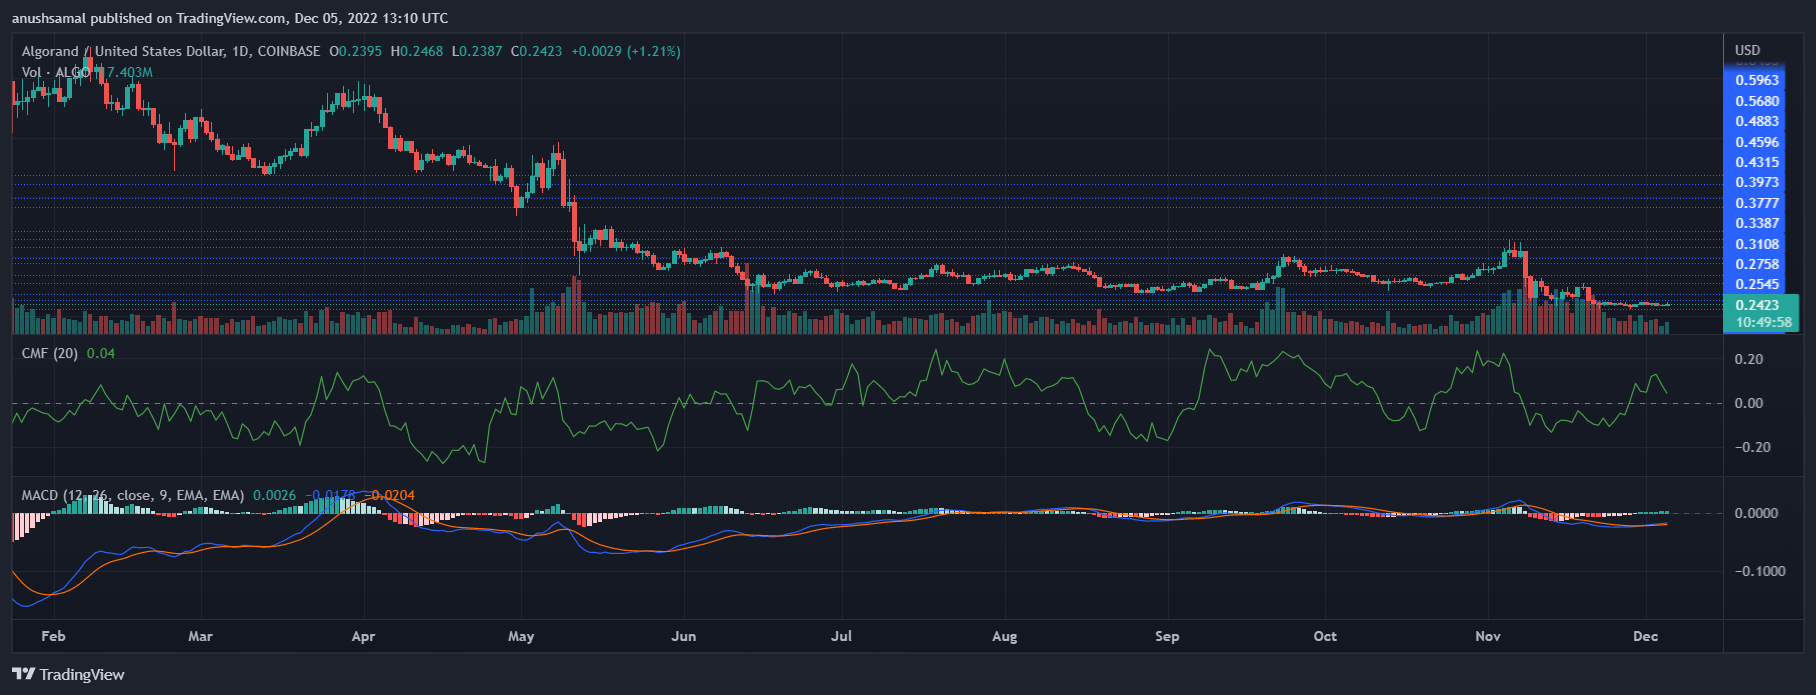
Institutional interest has noted a positive change over the past few trading sessions. There was a downtick in the Chaikin Money Flow, which depicts the capital inflows and outflows. Despite the downtick, CMF was still positive.
If capital inflows are to remain above the half-line, demand for ALGO cannot waver. Moving Average Convergence Divergence indicates price momentum and trend change. MACD formed green signal bars after noting a bullish crossover, which meant buyers could act on it and possibly make gains.
Featured image from VOI, Chart: TradingView.com
What’s Next As Algorand Price Remains Congested

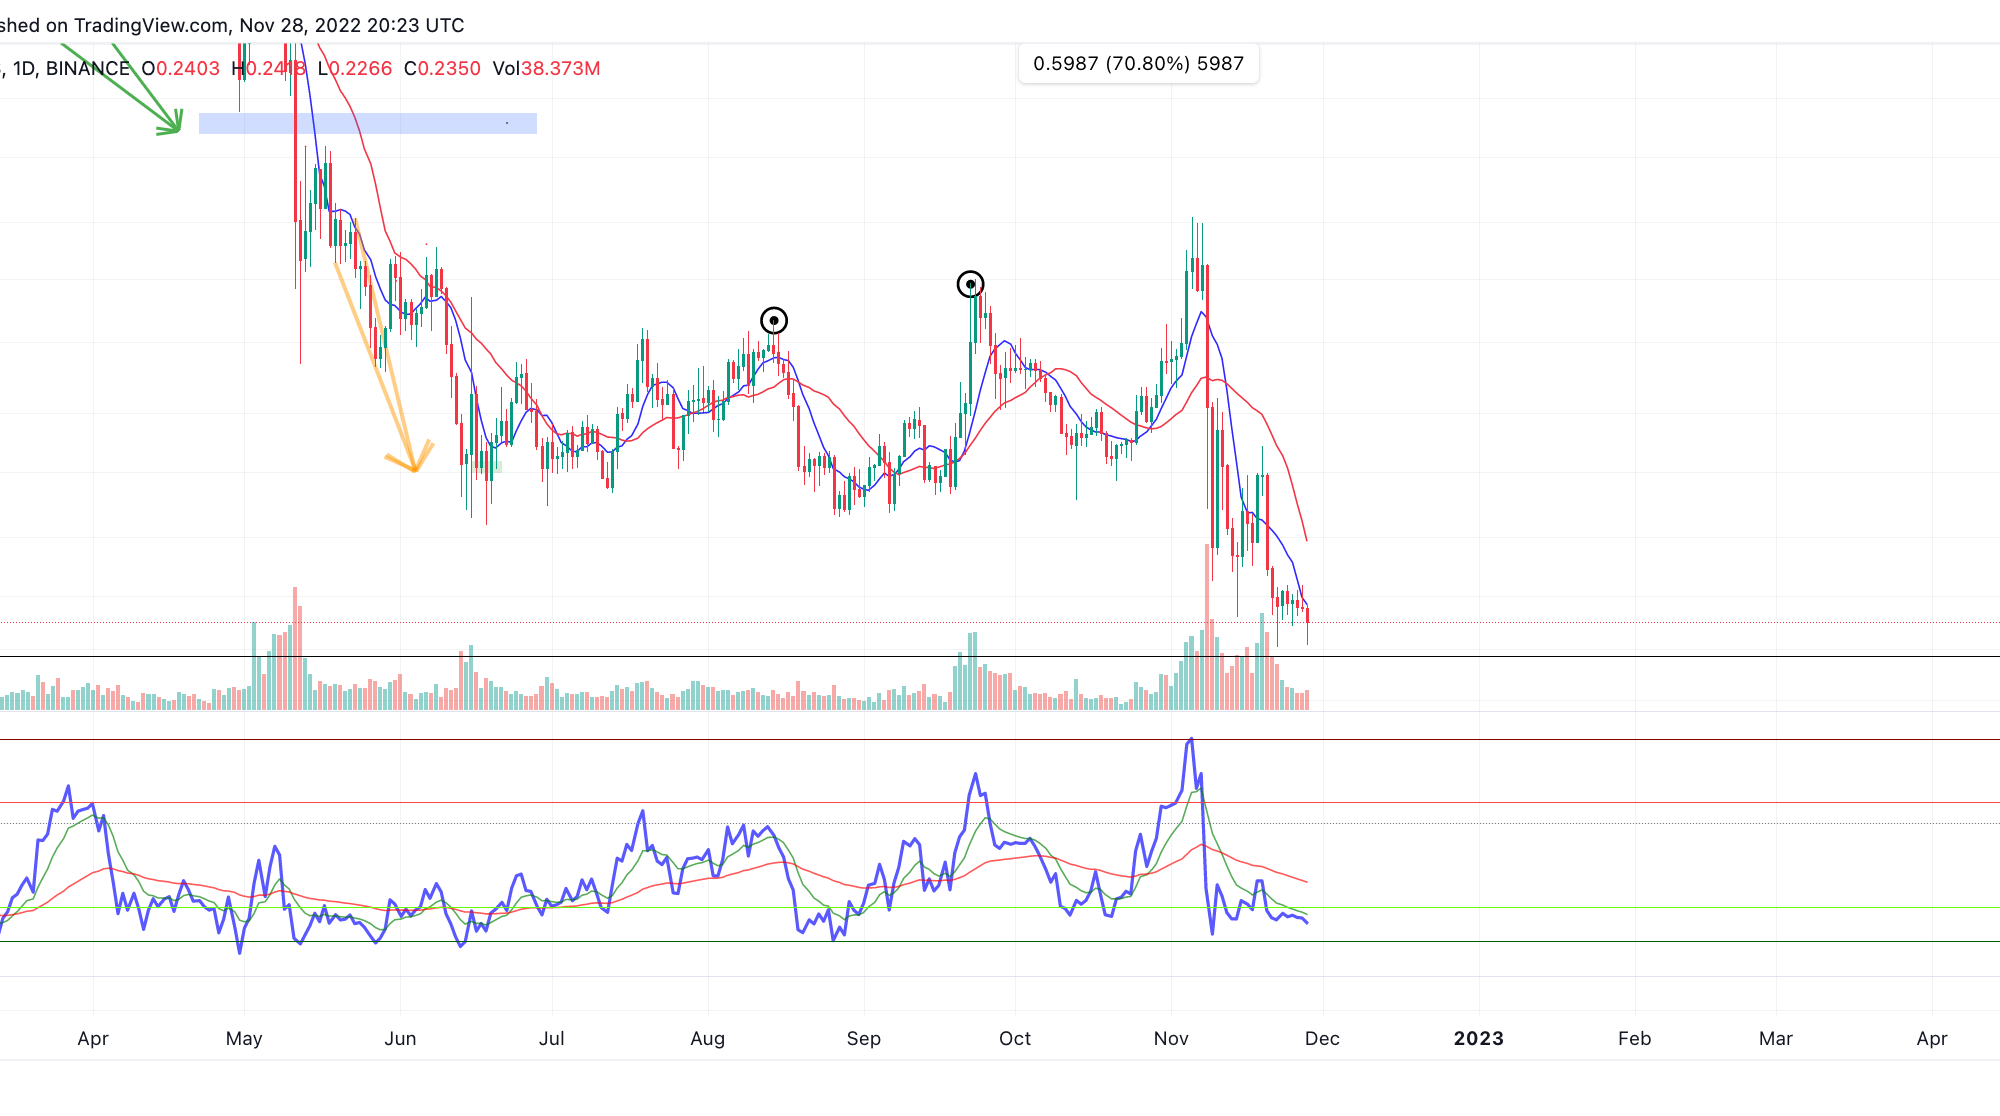
Algorand price continues to pack negative price action throughout the month of November. The altcoin has depreciated by more than 40% since the beginning of this month. Over the last 24 hours, ALGO has just risen by 0.6% on its chart, emphasizing continued lateral price movement.
Currently, the coin has been stuck at a crucial resistance level. The technical outlook points in a direction where ALGO might not make a price comeback soon enough. The buying pressure has dropped considerably, which has reflected the fact that the coin has been undergoing a massive sell-off. If Algorand is to come under bullish influence, buyers have to immediately re-enter the market.
The asset’s price action is expected to become even more congested at the $0.20 level if the bears halt movement above the $0.23 mark again. It remains to be seen if Algorand reclaims the $0.24 price level.
Algorand Price Analysis: One-Day Chart
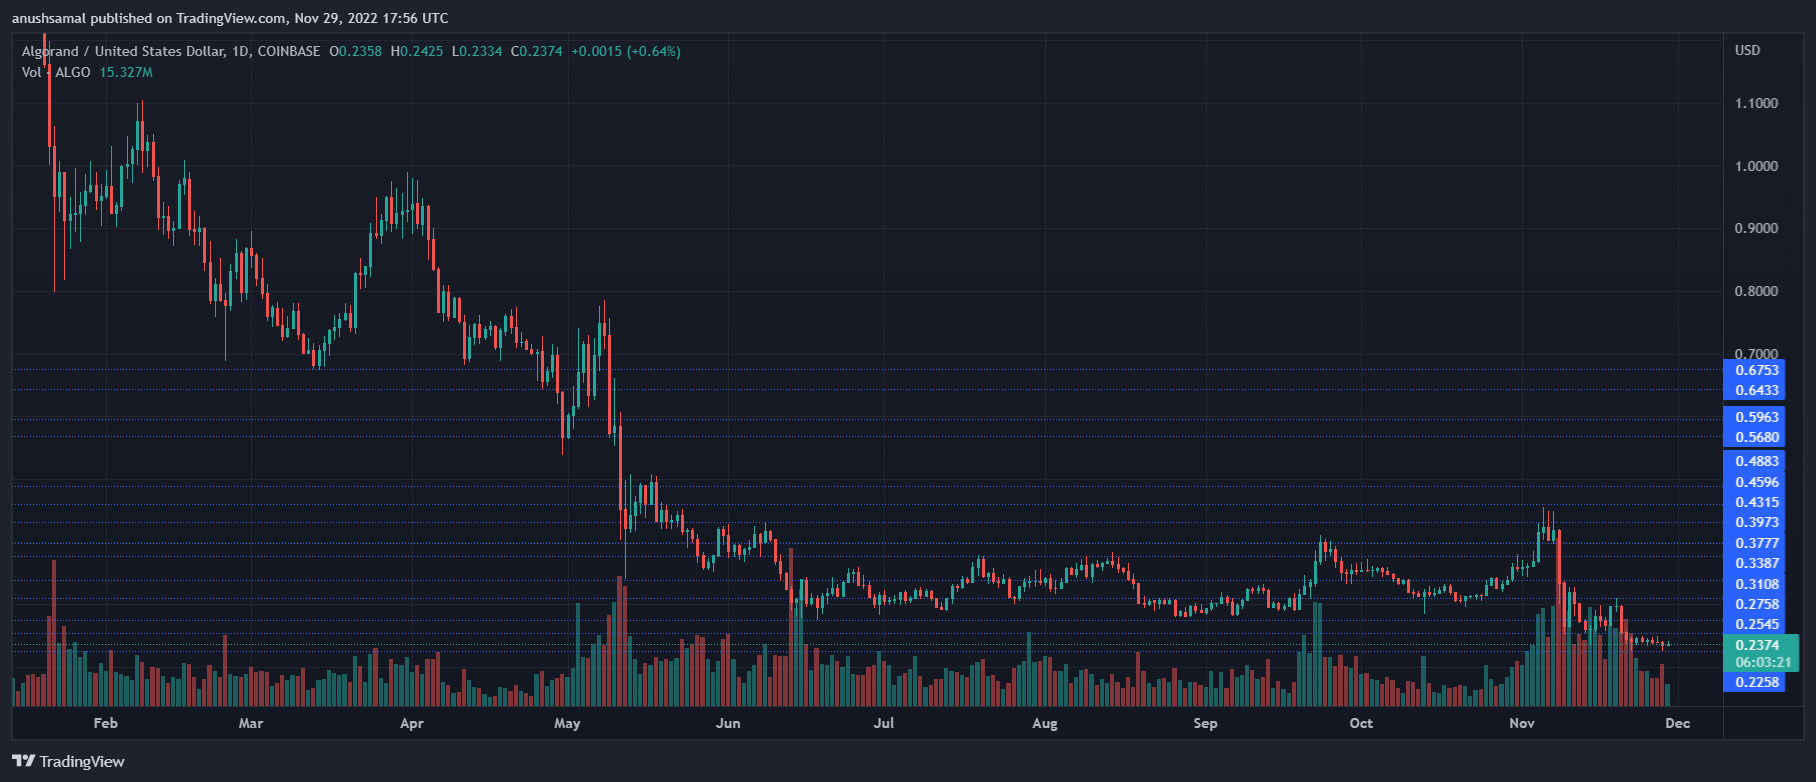
ALGO was auctioned at $0.23 at the time of writing. The overhead price ceiling was $0.24, and the altcoin faced rejection every time it inched toward that zone. With the massive sell-off, Algorand can lose the $0.23 price level and pierce through the $0.22 mark to sit on $0.20 for some time.
The altcoin can be expected to trade at $0.22 for some time before it targets $0.20, and if buyers return, ALGO can trace upwards from the $0.22 price mark. The amount of Algorand traded in the past session decreased, highlighting the sell-off.
Technical Analysis
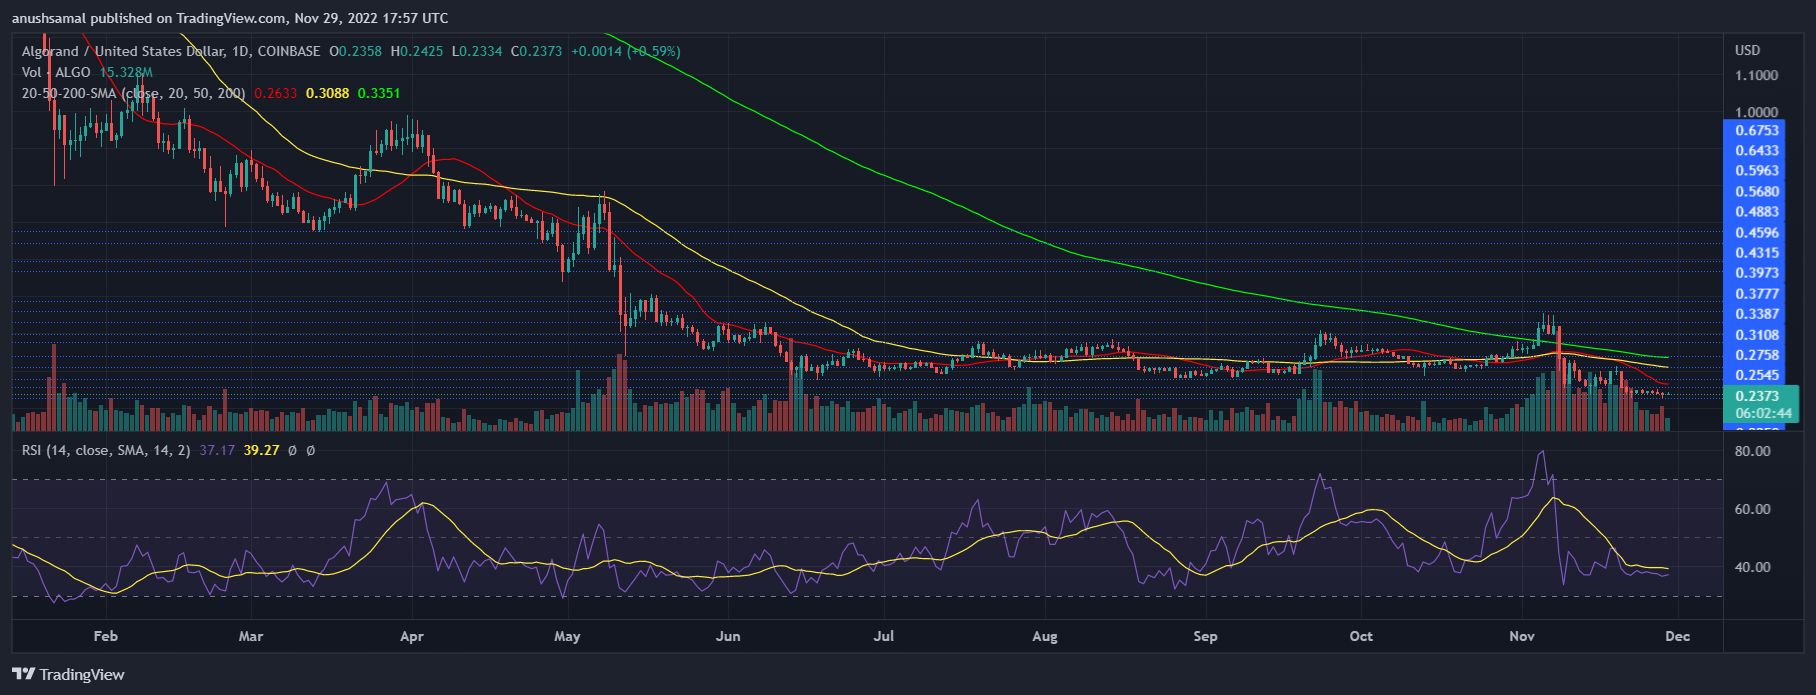
For most of this month, Algorand’s price has witnessed the pull of the sellers. Algorand was overvalued at the beginning of the month, although the bulls could not hold onto the price momentum. The Relative Strength Index was below the 40 mark, which signifies that the asset was even below the neutral zone, indicating that buying strength was weak.
Corresponding to the same reading, ALGO remained under the 20-Simple Moving Average (SMA). If the price of the coin moves above the 20-SMA, then the bearish thesis could be invalidated. According to the 20-SMA reading, sellers were driving the price momentum.
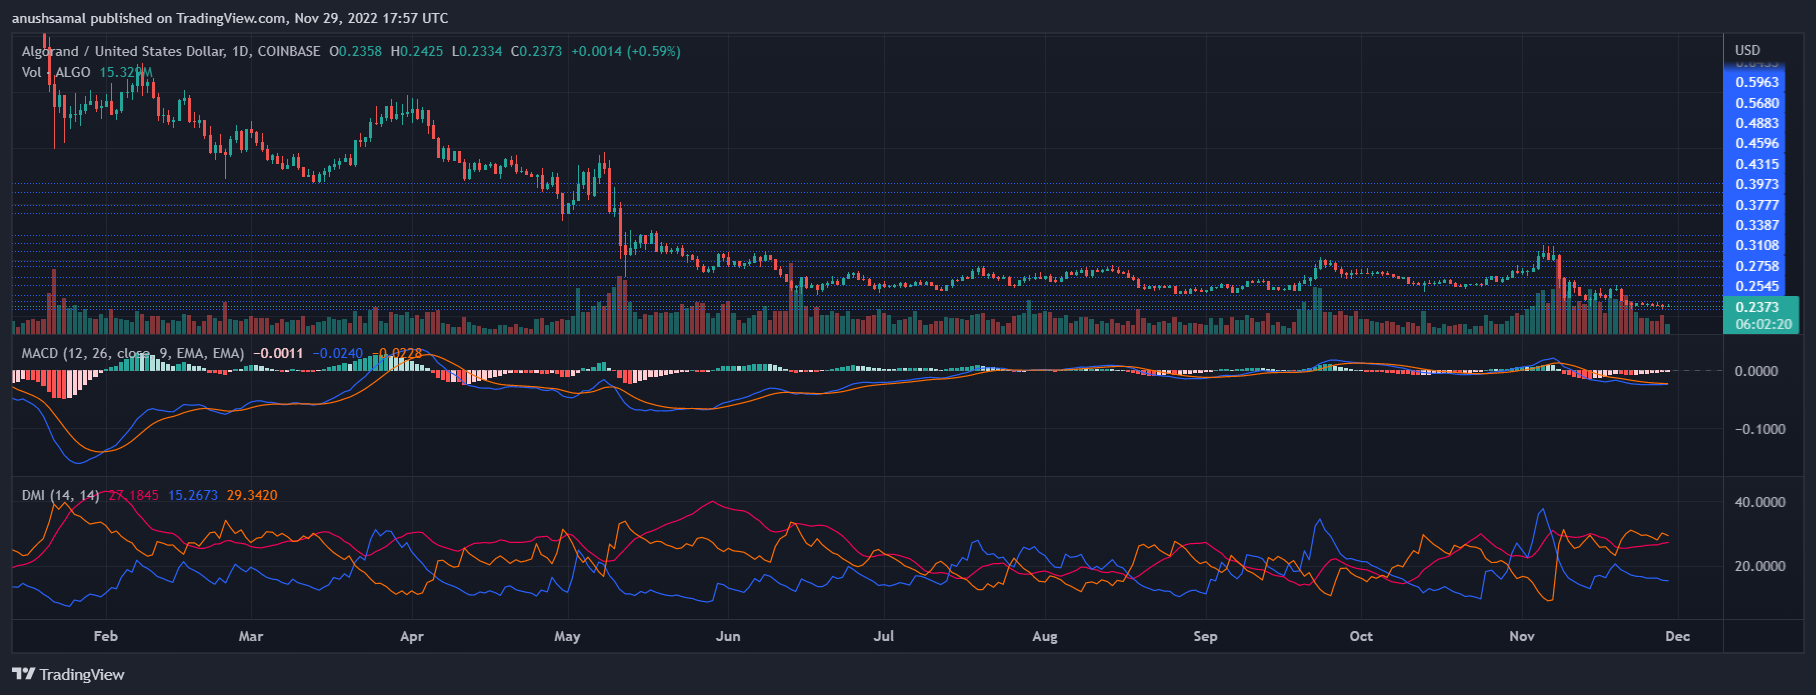
On the 24-hour chart, ALGO’s Moving Average Convergence Divergence (MACD) shows the price trend and the chance of a momentum reversal. MACD continued to form red signal bars, which were signs for investors to sell the asset.
The Directional Movement Index (DMI) indicates the strength of the price direction. DMI was negative as the -DI line (orange) was above the +DI line (blue). The Average Directional Index (red) was also above the 20-mark, meaning that the current price momentum was gathering strength.
Featured image from LeewayHertz, Chart: TradingView.com


