Cosmos (ATOM) Jumps Over 12% In One Day As Market Recovers

Cosmos traded in a highly volatile crypto market in 2022, but 2023 is showing signs of recovery. CoinMarketCap shows that the global crypto market cap has increased in 24 hours.

The trading volume of cryptocurrencies in the market has also increased within 24 hours. This data proves that there is still much global interest in cryptocurrencies.

According to a poll conducted on Twitter, 53.8 % of participants see the early part of 2023 to be bullish. In contrast, 46.2% predict a bearish market trend for early 2023. However, Twitter user Neon Panda states that these predictions are speculative since crypto is complicated.

Cosmos (ATOM), ranked number 20 on the crypto market list, has shown signs of a recovery in its price today, January 9. Cosmos has benefitted from this improved market outlook as its native token ATOM is also in the green today

The price change in 24 hours is $1.24, a 12.34% increase. This increment reflects in the trading volume of the asset, which is up by 265.39%

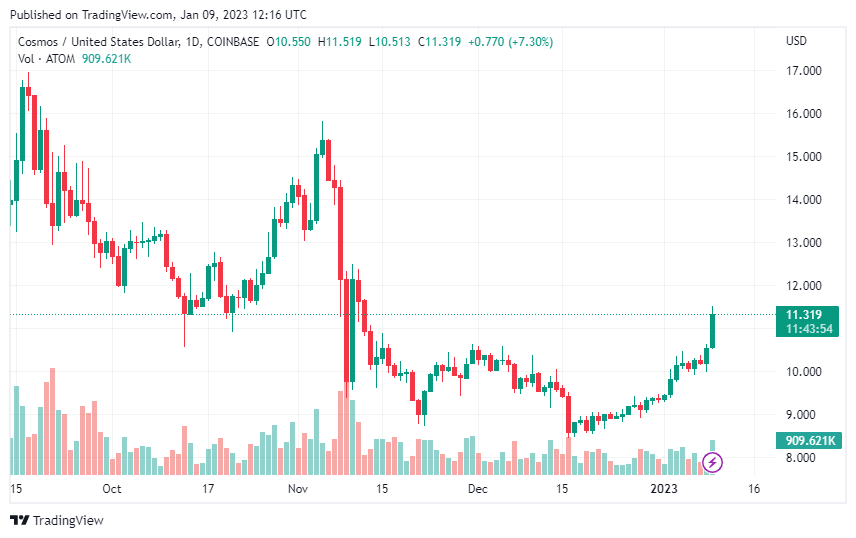
How Long Will Cosmos (ATOM) Ride The Bullish Trend?

ATOM is currently on a bullish trend at the start of the year. The formation of longer green candles shows that the bulls have the upper hand in the market. The asset has broken out of the sideways trend and has continued to rise on the chart.

Its support level of $8.441 held as the price increased. Atom will face resistance at $14.458 and $15.817. However, since these levels are below its all-time high of $44.70, it remains a possibility.

The asset is trading above its 50-day and 200-day Simple Moving Averages (SMA). It implies that both the short-term and long-term sentiments are currently bullish. Also, the Relative Strength Index (RSI) is giving off similar signals with the reading at 75.87, which is in the overbought region.

The Moving Average Convergence Divergence (MACD) is also bullish. The MACD is above its signal line, which is a buy signal. It implies that ATOM might continue its price increase in the coming weeks without negative occurrences.

However, note that if a digital asset falls by 50%, it would need to recover by 100% to return to its previous price. This feat might be complex to accomplish for altcoins. Also, investors should consider that altcoins are more volatile than large-cap cryptocurrencies like bitcoin.

ATOMUSD

What Is Driving Cosmos (ATOM)’ Resurgence?

Although the crypto market has shown signs of recovery, it is still largely volatile. Several factors are responsible for a price change of a digital asset in the crypto market.

Cosmos (ATOM) is enjoying a price resurgence due to increased trading activity, according to data from CoinGecko. The Cosmos Network seeks to serve as a bridge connecting other blockchains to communicate seamlessly. 

Also, the provision of regular upgrades on the network, such as Web3 solutions, has helped its popularity. On the Cosmos network, blog users receive regular updates about events. 

Cosmos has a community with a rich following where information and communication remain a priority. Developers can also communicate and exchange ideas in the community.

The network also supports up to 266 modern apps and services. With a thriving ecosystem and everyday use case, it is easy to see why the token is enjoying a resurgence.

Cosmos (ATOM) Leads Gains Among Top Coins

Despite being down 2.74% as of writing, Cosmos (ATOM) still leads gains among top coins in the past week. The internet of blockchains has had its fair share of roses and thorns during the week. However, data from CoinMarketCap shows that ATOM has enjoyed several peaks and is still trading in the green. 

The blockchain has also experienced high trading volume within the past 24 hours, up 14.93%. It has also held its end against top coins like Wrapped Bitcoin, Cronos, and Ethereum Classic, considering the 7-Day trading activity. 

Related Reading: XRP Price Hits Target Of $0.5, But Can It Break This Key Resistance?

Lower Timeframe Structure Remains Bullish Despite ATOM Stall

The ATOM price has produced a sequence of higher lows during the last week. Crucially, it established a short-term uptrend by breaking above the prior lower highs at $12.54 and $12.84. Higher time frame charts saw this as more of a bounce. Plus, it was met with strong resistance around the $13.4 level.

As the price approaches the white ascending trendline, it may find some support there. A session closing below $13 would once again render the lower-timeframe structure bearish. This may cause prices to fall back to the $12.35-$12.4 support area. However, if ATOM can break out over $13.4, it might signal a significant upward trend. Such a rise can potentially drive ATOM over the $14.8 resistance zone that has been in place since late September.

As of this writing, the RSI reading was 46. Even though it has dropped below the neutral 50 levels, there is no sign of bearish momentum. The OBV was flat as well. This indicated that neither the purchasers nor the vendors were in a position of power. It also suggested that a bullish breakthrough was less likely to occur.

ATOM’s price is currently hovering below $13. | SourceL ATOMUSD price chart from TradingView.com
ATOM Records Higher Total Staked Value, Thanks to DeFi

The DeFi sector on Cosmos has been booming in recent weeks. After publishing the “Cosmos Hub Roadmap 2.0,” Cosmos received great interest from investors. In addition, the native token ATOM saw growth in terms of total value locked (TVL), development engagement, and the number of holders in the third quarter of 2022.

According to a tweet recently posted by the Cosmos Daily, the DeFi industry is one of the fastest-growing parts of the Cosmos ecosystem. The TVL of popular protocols like the Kava Network skyrocketed in the previous month to 291.2 million. Osmosis zone and THORChain, two other protocols, garnered $209 million and $105.85 million, respectively.

Related Reading: Bitcoin Volatility Index Suggests Large Price Move Arriving Soon

Still, on on-chain analytics, there was a steady increase in the number of cryptocurrency investors who held ATOM throughout the year. Despite this, there was no significant increase in the number of transactions or the volume. We also saw top DeFi platforms like dYdX move from Ethereum to Cosmos within the past week. One could say that many investors are in for the long ride, especially given dYdX’s big move and the blockchain’s plans outlined in its updated roadmap. 

Featured image from Pixabay and chart from TradingView.com

Cosmos ATOM Also Loses Its Gains As Market Fluctuates Heavily

ATOM remained an exception to the general downtrend of the crypto market for a couple of days as it continued to gain despite heavy price fluctuations of other tokens.

The Ethereum Merge took place successfully on September 15th, marking a historic moment in the history of crypto. However, just as some analysts predicted, it did not result in a spike as optimists have forecasted. In fact, most cryptos, including ETH, and BTC, experienced a downturn at the same time. This confirmed the “Buy the rumor, sell the news” tag; crypto analysts conferred on the event in advance.

Related Reading: XRP Price Rallied 7%, Is It Gearing To Test The Next Resistance?

Nonetheless, one token continued to stand out amidst the bearish market trends, the native crypto of the Cosmos protocol. Despite the extreme market fluctuations, ATOM continued to glide upward, gaining up to 20% in 48hours. ATOM is trading around $17 dollars at the time of writing, close to 20% above its $14 price 48 hours before. The Cosmos native token has been experiencing its up and downs in an ever-ascending trendline, unlike the wider market.

ATOM Gains Were Due To IBC and Staking Opportunities

The recent gains lead back to the influx of protocols migrating to the Cosmos blockchain. After the crash of the Terra ecosystem, several projects rebuilt their operations on Cosmos Hub. Consequently, each project adds value to ATOM by participating in the inter-blockchain security system IBC.

Cosmos also offers staking opportunities with a lucrative APY of close to 18%. Furthermore, the network is introducing different utilities into its ecosystem, which will increase the value of ATOM going forward. One of these is the liquidity staking the protocol is ready to launch. Additionally, protocols on Cosmos are preparing to launch their own stablecoins, with ATOM most likely the primary assets for minting.

ATOM’s price is currently trading around $16. | Source: ATOMUSD price chart from TradingView.com
Recent Macroeconomic Events Contribute to Increased Market Volatility

Meanwhile, recent macroeconomic events have increased bearish pressure on the digital assets market. As cryptos struggle to breach various price barriers and flip bullish, these factors bear down, causing the assets to fluctuate. Events like the recent release of the August inflation data reveal the continued rise of inflation.

Related Reading: Chiliz (CHZ) Could Be Set For A Hot Streak With This Data

Ethereum, for instance, has been rising and falling within the $1,700 and $1,500 range in the past seven days. Its volatility curve has been on a downward trend for the past week. The second largest crypto by market cap is down 11% since the Merge. ETH is currently trading below $1,500. As for Bitcoin, the crypto dropped below the $21,000 zero mark on Thursday in response to the Tuesday inflation data release. The first coin has been trading inconsistently within the range of $19,000 to $23,000. BTC is trading at above $20,000 at the time of writing.

Featured image from Pixabay and chart from TradingView.com

Cosmos (ATOM) In Green While Entire Market Bleeds

A day after the much-anticipated Merge, many cryptocurrencies have lost more than they gained. The entire market is red, and even the top performers are not showing signs of price gains. Many investors predicted a downtrend reversal after Ethereum’s upgrade to a proof-of-stake mechanism. 

But right now, the reverse is the case. For instance, the number one crypto has remained red in its 1 hour, 24 hours and 7 days price gains. Currently, the Bitcoin price is $19.659.95 representing a 2% loss in 24 hours. 

Related Reading: Ethereum Faces Test Of Survival After Merge, Can $1,400 Support Hold?

September 16 data shows that Bitcoin lost 0.61% in 1 hour, 1.88% in 24 hours and 6.26% in 7 days. 

Apart from Bitcoin, Ethereum has lost more. ETH’s price is currently at $1,451.49, showing a move away from the previous $1700+. The Merge hasn’t resulted in the price push as many expected. 

But while many cryptos are recording pullbacks in prices, Cosmos ATOM has continued its gains. 

Cosmos ATOM Gains Amid Price Crash


Cosmos ATOM price currently stands at $16.16 after adding 11.49% in the last 24 hours. The coin ranks number 20 on the CoinMarketCap crypto ranking. ATOM has recorded some price growth in this period, even when others struggle. 

Its price chart today, September 16, showed a continuous rise in green. There were some dips, but not to the red zone. For instance, ATOM’s price stopped at $14.65 on September 15. This morning, it rose to $14.73 and continued climbing until its current price of $16.16 at press time. 

Analysts studying the price movement have noted that ATOM highs and lows remained within the ascending channel trendlines. Also, the price recorded a bull break outside the channel and tapped a 200-day moving average before correcting to the midline and 20-MA, confirming each support. 

After testing the support, ATOM price continued its uptrend and is trading in the current range topside. Analysts believe it might retest the 200-day MA to flip its level to support. 

ATOM’s price is currently trading at over $15.70. | Source: ATOMUSD price chart from TradingView.com
What Factors Are Pushing Cosmos Coin

Many factors could be linked to the growth of ATOM. One such event is the move of many protocols from Terra to Cosmos Hub SDK. In early September, Delphi Digital announced it would build new projects on the Cosmos network. 

As more DeFi protocols and decentralized apps (DApps) flood the ecosystem and participate in its interchain security system, ATOM value skyrockets. The AMMs, DeFi, and DApps operating on the network boost staking and fees, thereby increasing stakers rewards. 

Related Reading: Why Cardano (ADA) Could Be Registering Another Decline, Analyst Explains

Data reveals that ATOM offers 17.75% APY, and 66.75% of the coins in circulation are staked. Also, Cosmos is planning to launch a liquid staking feature that will increase buy pressure on ATOM when deployed in DeFi platforms across blockchains. 

All these increased activities in the ecosystem are pushing ATOM prices upwards. Analysts expect to see more gains as the network grows. 

Featured image from Pixabay and chart from TradingView.com

TA- Cosmos Could Be Set For A Wild Rally Ahead Of Crucial Breakout

The price of Cosmos (ATOM) could be set for a wild rally with a potential breakout against Tether (USDT) ahead of summer relief for altcoins. 

Ethereum price saw a relief bounce from $1,600 to $1,800 ahead of merge sentiments leading to other altcoins like Cosmos breaking out in price. (Data feeds from Binance)

Price Analysis Of ATOM On The Weekly Chart
Weekly Price Chart Analysis For ATOM | Source: ATOMUSDT On Tradingview.com

From the chart, the price of ATOM saw a weekly low of around $6.5, which bounced from that range and rallied to $11.3.

The price has built more momentum as it faces resistance at $17.

If the price of ATOM on the weekly chart continues with this bullish structure, it could quickly hit the $17 mark.

The volume shows decent buy bids, pushing the price of ATOM higher.

Weekly resistance for the price of ATOM – $17.

Weekly support for the price of ATOM – $6.5.

Price Analysis Of ATOM On The Daily (1D) Chart
Daily Price Chart Analysis For ATOM | Source: ATOMUSDT On Tradingview.com

The price of ATOM found strong support at around $6.2, with what seems to be an area of interest on the daily chart.

ATOM bounced from its support, forming a bullish trendline that acts as a support and has continued to maintain this structure. 

At the point of writing, the price of ATOM is at $12, trading above the 50 exponential moving averages (EMA), which corresponds to the support at $10. 

If the 50 EMA region fails to hold the price, $9 would be a good support to hold sell-offs and for a possible price bounce.

With more buy bids, we could see the price of ATOM retesting at $16 -$17, which has been resistance on the daily chart.

The RSI for ATOM price on the daily chart is 65, indicating healthy buy bids for ATOM.

The volume for ATOM looks good, indicating positive signs for ATOM prices to trend higher.


Daily (1D) resistance for ATOM price – $17.

Daily (1D) support for ATOM price – $10, $9.

Price Analysis Of ATOM On The Four-Hourly (4H) Chart
Four-Hourly Chart Analysis For ATOM | Source: ATOMUSDT On Tradingview.com

The price of ATOM has shown a bullish breakout from a symmetric triangle on the 4H chart, with the price closing above it.

ATOM has struggled in this region, forming a range in a triangle with price rejecting from $11.5.

ATOM price is $12, trading above the 50 & 200 EMA with prices of $10.7 and $10 on the 4H chart. These prices would act as support areas for ATOM on the 4H chart.


Four Hourly (4H) resistance for ATOM price – $16.

Four hourly (4h) support for ATOM price – $10.7, $10.


A break below these support zones could send the price of ATOM to a region of $9, acting as a good support area.

Featured image from NewsBTC, Charts from TradingView.com