Looking Deeper: Can ATOM Sustain Its 13% Surge Beyond The Network Buzz?

ATOM has ascended to the summit of network activity within the inter-Blockchain ecosystem. However, upon closer inspection, the narrative surrounding Cosmos unveils a more nuanced story. Despite the accolade of being at the forefront of blockchain network activity, a discerning analysis reveals a dip in actual user engagement and transaction volumes.

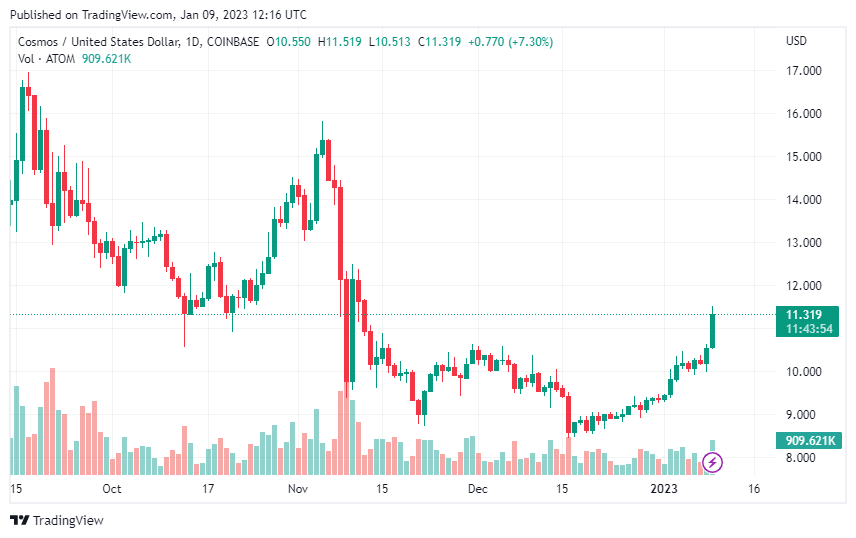
Surprisingly, against the backdrop of these statistics, Cosmos has witnessed a remarkable 13% surge in its token price over the past week, prompting a deeper inquiry into the factors propelling its momentum.

Digging Deeper: Beyond Buzzwords

Although Cosmos received accolades for its network activity, the narrative quickly unravels when scrutinizing actual user statistics. Daily Active Addresses and Transactions for ATOM,  tracked by Artemis, experienced a noticeable decline, painting a different picture than the headline numbers suggest. Similarly, fees and revenue for the Cosmos network dipped during this period, further dampening the celebratory mood.

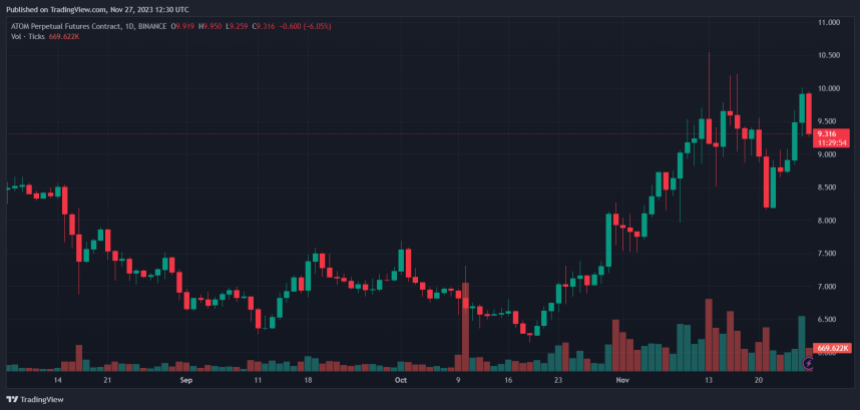
Despite the declining activity metrics, ATOM’s price defied the trend, showcasing a 6% gain over the last 24 hours, data from Coingecko shows. This disconnect highlights the influence of factors beyond user engagement, including the broader market bullishness and potentially, speculation fueled by a spike in ATOM’s MVRV ratio, a profitability indicator.

The Power Of Partnerships And Policy: Catalysts For Growth

While the overall market sentiment played a role, key developments within the Cosmos ecosystem also contributed to ATOM’s ascent. The recent merger between Osmosis and UX Chain solidified their foothold within the Cosmos landscape, bolstering cross-chain DeFi capabilities.

Additionally, the Cosmos Hub’s governance decision to reduce ATOM’s inflation rate from 14% to 10% addressed concerns surrounding stability and security, potentially attracting further investment.

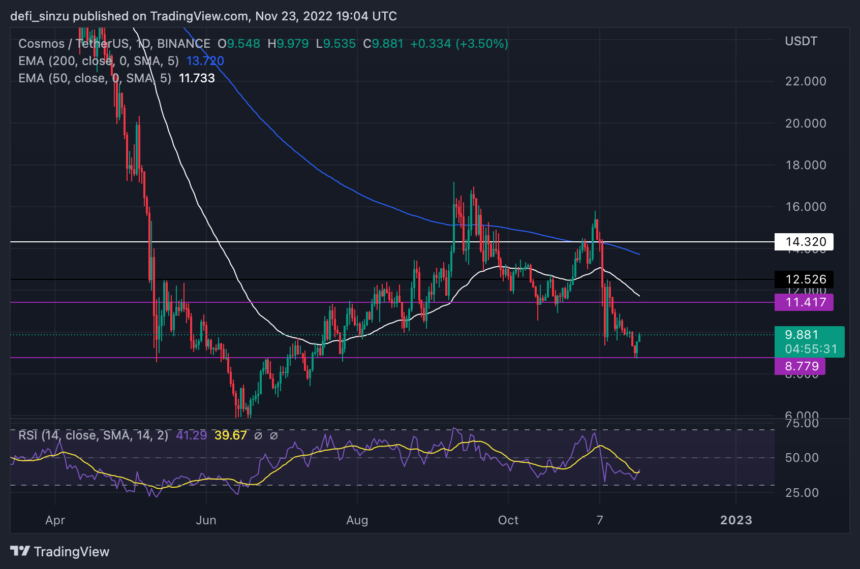
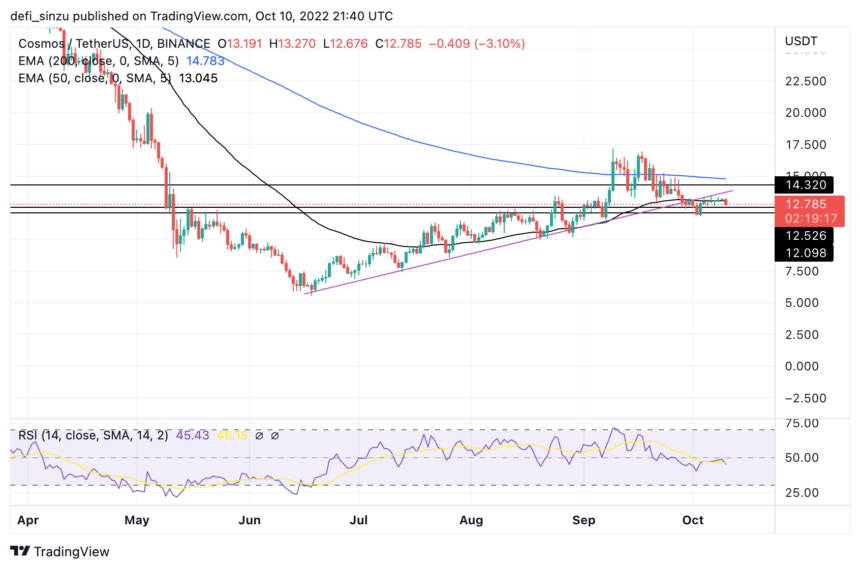
Despite the recent rally, ATOM’s technical indicators paint a somewhat cautious picture. The daily chart presents a bearish MACD signal, and the Chaikin Money Flow’s sideways movement suggests a potential extension of the current price consolidation.

The Road Ahead: A Balancing Act

Cosmos faces the challenge of bridging the gap between headline-grabbing network activity metrics and actual user engagement. The recent decline in transactions and addresses raises questions about long-term sustainability. Nevertheless, the ecosystem’s strategic partnerships, focus on DeFi integration, and proactive governance decisions provide promising counterpoints.

As the new year approaches, ATOM’s trajectory will likely hinge on its ability to address user-centric metrics while leveraging its strategic alliances and proactive governance. Whether it can translate its headline dominance into sustained user engagement and price growth remains to be seen.

As Cosmos (ATOM) revels in its recent ascent to the peak of network activity within the inter-blockchain ecosystem, the question looms: can this momentum be sustained beyond the current buzz? The enigma surrounding Cosmos deepens as its 13% surge in value defies conventional metrics, prompting a cautious examination of the factors at play.

Featured image from Shutterstock

Cosmos Co-Founder’s Controversial Proposal Triggers 11% Plunge In ATOM

In a bold move, Cosmos co-founder Jae Kwon has called for a significant shift in the blockchain’s direction following the controversial passing of NWV #848. This proposal was approved by the community’s voting mechanism, earning around 40% of the votes, and it was aimed at changing the blockchain’s native token inflation rate.

Kwon, expressing his dissent, is now advocating for a coordinated “split” in the Cosmos ecosystem, a proposal that could reshape the blockchain’s future. This development comes in response to what Kwon perceives as “deviating from the network’s core principles.”

“AtomOne” Split, Cosmos Co-Founder Urges Community Engagement

Kwon’s proposal, termed “AtomOne,” is not just a divergence but an exodus from the current state of Cosmos, encouraging community members who voted ‘No’ to join this new venture. The plan is still in its infancy and laid out in a GitHub repository, where Kwon invites community ideas and participation in shaping this new direction.

He emphasizes a collaborative approach, urging the community to discuss and contribute to the formation of AtomOne.

The essence of AtomOne lies in integrating $ATOM with $ATMO/$ATOM1, aiming to prevent a “complete collapse of ATOM by mass selling.” Kwon suggests that instead of abandoning ATOM altogether, there should be a way for it to coexist with the new fork.

Cosmos Community Faces a Crossroads: Exodus And Innovation

Kwon’s vision for AtomOne involves forking the current “cosmoshub4” but with its development path and teams, aiming for a more decentralized structure than the current Gaia. This new entity is open to all who opposed the recent vote, signaling a departure from the traditional paths of blockchain governance.

Kwon highlights the power of the minority in blockchain ecosystems and the ability to self-organize and create antifragile structures.

His message is clear: those who do not align with sound logic are destined to fail, and the future belongs to those who dare to exodus and build a better civilization. Kwon assures that this move isn’t about abandoning the original Cosmos hub but saving it and redefining its role.

People are completely confused about the nature of blockchains what power the NO/NWV voters have altogether inside and outside the hub. The reality is that we exist, our principles and goals are aligned because they come from logic and we are about to demonstrate antifragility. The reality is that you cannot take control of a chain even with over 50% consensus, even 67%, because the minority can always self-organize even without your help. And the reality is that those who don’t make decisions based on sound logic always end up failing in the end.

As the community gears up for this potential split, Kwon’s call for a departure to AtomOne reflects a pivotal moment in Cosmos’ history and a testament to blockchain governance’s dynamic and evolving nature. A conversation that will continue for “generations.”

As a result of the split proposal, ATOM has seen a spike in volatility, recording an 11% loss over the past few days. However, speculation is that the split will involve an airdrop poised to attract positive attention for the token.

Cosmos ATOM ATOMUSDT ATOM price

Cover image from Unsplash, chart from Tradingview

Cosmos (ATOM) Jumps Over 12% In One Day As Market Recovers

Cosmos traded in a highly volatile crypto market in 2022, but 2023 is showing signs of recovery. CoinMarketCap shows that the global crypto market cap has increased in 24 hours.

The trading volume of cryptocurrencies in the market has also increased within 24 hours. This data proves that there is still much global interest in cryptocurrencies.

According to a poll conducted on Twitter, 53.8 % of participants see the early part of 2023 to be bullish. In contrast, 46.2% predict a bearish market trend for early 2023. However, Twitter user Neon Panda states that these predictions are speculative since crypto is complicated.

Cosmos (ATOM), ranked number 20 on the crypto market list, has shown signs of a recovery in its price today, January 9. Cosmos has benefitted from this improved market outlook as its native token ATOM is also in the green today

The price change in 24 hours is $1.24, a 12.34% increase. This increment reflects in the trading volume of the asset, which is up by 265.39%

How Long Will Cosmos (ATOM) Ride The Bullish Trend?

ATOM is currently on a bullish trend at the start of the year. The formation of longer green candles shows that the bulls have the upper hand in the market. The asset has broken out of the sideways trend and has continued to rise on the chart.

Its support level of $8.441 held as the price increased. Atom will face resistance at $14.458 and $15.817. However, since these levels are below its all-time high of $44.70, it remains a possibility.

The asset is trading above its 50-day and 200-day Simple Moving Averages (SMA). It implies that both the short-term and long-term sentiments are currently bullish. Also, the Relative Strength Index (RSI) is giving off similar signals with the reading at 75.87, which is in the overbought region.

The Moving Average Convergence Divergence (MACD) is also bullish. The MACD is above its signal line, which is a buy signal. It implies that ATOM might continue its price increase in the coming weeks without negative occurrences.

However, note that if a digital asset falls by 50%, it would need to recover by 100% to return to its previous price. This feat might be complex to accomplish for altcoins. Also, investors should consider that altcoins are more volatile than large-cap cryptocurrencies like bitcoin.

ATOMUSD

What Is Driving Cosmos (ATOM)’ Resurgence?

Although the crypto market has shown signs of recovery, it is still largely volatile. Several factors are responsible for a price change of a digital asset in the crypto market.

Cosmos (ATOM) is enjoying a price resurgence due to increased trading activity, according to data from CoinGecko. The Cosmos Network seeks to serve as a bridge connecting other blockchains to communicate seamlessly. 

Also, the provision of regular upgrades on the network, such as Web3 solutions, has helped its popularity. On the Cosmos network, blog users receive regular updates about events. 

Cosmos has a community with a rich following where information and communication remain a priority. Developers can also communicate and exchange ideas in the community.

The network also supports up to 266 modern apps and services. With a thriving ecosystem and everyday use case, it is easy to see why the token is enjoying a resurgence.

Cosmos (ATOM) Rallies With Over 10% Gain As Indicator Shows Not In Safe Zone

  • ATOM’s price shows strength as price bounces off from a weekly low of $8.5 giving bulls some relief. 
  • ATOM’s price continues to look bearish as more sentiment for the market lingers, with things looking uncertain for most traders and investors. 
  • ATOM’s price rallies high on the daily timeframe as the price moves toward the 50 Exponential Moving Averages (EMA) price, looking less likely to break higher.

The price action displayed by Cosmos (ATOM) recently hasn’t been motivating after prices declined from a region of $27 to a weekly low of $8.5. With many looking for a major dump in Bitcoin (BTC) price, the price of Bitcoin (BTC) bounced from $15,500 as price rallied to a high of $16,500, leaving bears on the sidelines as the price of Comos (ATOM) gains some relief bounces to hold strong above key support. The price action displayed by Cosmos (ATOM) and many altcoins recently have been problematic as many altcoins battle for survival. The Domino effect of the FTX saga and other huge investors involved has left the market at a standstill as the market is yet to make a major move after previous weeks. (Data from Binance)

Cosmos (ATOM) Price Analysis On The Weekly Chart

Most crypto traders and investors have had a rough few days, with many concerned about where the market is headed after so much turbulence in the crypto space. Many altcoins have struggled to show strength, losing key support in a bid to survive.

The current market uncertainty has caused traders and investors to be hesitant to purchase altcoins, as there is no guarantee that they will rise in value any time soon.

The price of ATOM on the weekly chart has struggled despite the market uncertainty that has affected major crypto projects that have continued to build in this bear market, and more FUD (fear of uncertainty and doubt) persists. ATOM saw its price traded in a region of $17 on the weekly chart, but the price was rejected as ATOM’s price declined to a region of $8.5, bouncing off this region to trade at $9.5 with a small relief from the market.  

Weekly resistance for the price of ATOM – $10.

Weekly support for the price of ATOM – $8.5.

Price Analysis Of ATOM On The Daily (1D) Chart

Daily ATOM Price Chart | Source: ATOMUSDT On Tradingview.com

The price of ATOM remains considerably weak in the daily timeframe as the price trades above $8.5 support after the price was rejected from a high of $17.

ATOM’s price trades at $9.8 below its 50 and 200 EMA, acting as resistance for the price of ATOM. The price of $11.5 and $13.8 corresponds to the prices at these levels, acting as resistance. 

If the price of ATOM breaks and holds above $11.5, we could see more rallies for the ATOM price to a region of $13; a break below a region of $8.5 would send the price back to a region of $5. 

Daily resistance for the ATOM price – $11.5.

Daily support for the ATOM price – $8.5-$6.

Featured Image From zipmex, Charts From Tradingview 

Cosmos Recaptures $14 As Price Grows; Will Bulls Push To A High Of $17?

  • ATOM’s price shows strength as it bounces from a downtrend range price rallied to a high of $14 with eyes set on $17. 
  • ATOM could rally more as the price creates more bullish bias by breaking out of a downtrend descending triangle with eyes set on rallying higher.
  • ATOM’s price remains strong on the daily timeframe above the 50 Exponential Moving Average (EMA) as the price aims for more rallies.

The price action displayed by Cosmos (ATOM) has been tremendous as the price resisted the bears rallying from a region of $12.7 to a high of $14, reclaiming a vital support area it has built in the past few weeks. The crypto market is looking increasingly welcoming as many altcoins continue producing over 50% gains. The likes of DOGE have seen some great runs recently, rallying from a low of $0.055 to a high of $0.15, with many others as Cosmos (ATOM) continues to lead the charge for more price recoveries. (Data from Binance)

Cosmos (ATOM) Price Analysis On The Weekly Chart

Cosmos (ATOM) has struggled to regain its bullish momentum in recent times; despite the uncertainty that has befallen the crypto space, the price of ATOM has enjoyed a measure of relief after showing so much strength on the weekly low, rallying from a low of $12.7 to a high of $14 and recapturing this region as it forms key support for more potential to rise higher. 

The past weeks have been nothing short of a boring and difficult moment for the crypto market as this affected the price of most altcoins negatively, forcing them to lose their support zone, with others battling it to stay afloat of their price. 

After its weekly close of above $13.5, ATOM’s price looked stronger as the price of ATOM geared up for more upside price moves.; the price has faced a minor rejection to break higher to a region of $17.

Weekly resistance for the price of ATOM – $17.

Weekly support for the price of ATOM – $13.5.

Price Analysis Of ATOM On The Daily (1D) Chart

Daily ATOM Price Chart | Source: ATOMUSDT On Tradingview.com

In the daily timeframe, the price of ATOM continued to look strong as the price broke out of its descending triangle, with good volume rallying to a high of $14 and forming good support around $13.5 below its current value of $14.1. Still, the price of ATOM faces a little rejection; the price of ATOM needs to break and hold above $14.5 for the price to become more bullish once more.

The price of ATOM faces a resistance to break and hold above 200 EMA, which corresponds to $14.5. A break and close above this region could send the price of ATOM to a region of $17 and possibly a retest of $20 region acting as a supply zone. 

Daily resistance for the ATOM price – $14.5.

Daily support for the ATOM price – $13.5.

Featured Image From Blockchain News, Charts From Tradingview

Cosmos Clings To $12 As Price Struggles, Will This Region Act As Strong Support?

  • ATOM’s price shows strength as price breaks bounced off from $12 with good volume with eyes set to reclaim $13. 
  • ATOM breaks out of a downtrend as the price resumes a bullish structure. 
  • The price of ATOM continues to trade above 50 Exponential Moving Average (EMA) in the four-hourly timeframe. 

The price movements of Bitcoin (BTC) have hurt most altcoins, with Cosmos (ATOM) finding its price at key support as bulls defend this region with blood and sweat. The recent Consumer Price Index news had a significant impact on the crypto market, as the price of BTC fell to a low of $18,200 before rebounding to $19,300, with many altcoins struggling to keep up, but Comos (ATOM) proved resilient. (Data from Binance)

Cosmos (ATOM) Price Analysis On The Weekly Chart.

Despite experiencing some great price movement in recent weeks due to so many traders and investors becoming interested in the various projects built on the Cosmos ecosystem, this, in a way, serves as a huge catalyst for such price movement.

After the price of ATOM dropped to a weekly low of $6, the price rallied from this low to a high of $17, where the price faced resistance to breaking above this region to a height of $20.

The price of ATOM faced a rejection to a low of $11.5, where the price bounced and rallied to a high of $12, reclaiming this region as it has been a key support for ATOM prices. 

ATOM’s next weekly candle closed bearish, but the new week’s candle opened with bullish signs as the price of ATOM could be set for a rally to a region of $13, where the price will face resistance to break higher. 

Weekly resistance for the price of ATOM – $13.

Weekly support for the price of ATOM – $12.

Price Analysis Of ATOM On The Daily (1D) Chart
Daily ATOM Price Chart | Source: ATOMUSDT On Tradingview.com

In the daily timeframe, the price of ATOM continues to trade below key resistance despite breaking out from its downtrend after the price got rejected from a high of $17. 

The price of ATOM has shown strength, as the price broke out from a descending triangle as the price tries to break above 50 EMA at $12.75, acting as resistance for ATOM price. If the price of ATOM reclaims 50 EMA, we could see more price action to a region of $13-$14.

The Relative Strength Index (RSI) for ATOM price on the daily timeframe looks good after rallying from a region of oversold, which indicates good buy volume for ATOM

Daily resistance for the ATOM price – $13.

Daily support for the ATOM price – $12.2.

Featured Image From BitcoinKE, Charts From Tradingview

Cosmos (ATOM) Invalidates Uptrend; Where Is The Next Area Of Interest For Price?

  • ATOM price struggles on high timeframes to trend higher despite showing bullish sentiment in recent times. 
  • ATOM trades below uptrend support as the price looks bearish with the current market state.
  • The price of ATOM eyes key support as price trades below 50 and 200-day EMA. 

The price of Cosmos (ATOM) struggles to discover its bullish trend as the price breaks below uptrend support against tether (USDT). The previous weeks saw the crypto market cap looking good as prices of Bitcoin (BTC) and other crypto assets, including Cosmos (ATOM), showed so much strength as price rallied from a low of $6 to a high of $17. (Data from Binance)

Cosmos (ATOM) Price Analysis On The Weekly Chart.

Despite showing some great price movement in recent weeks with so many traders and investors becoming interested in the different projects being built on the Cosmos ecosystem, this, in a way, is a huge catalyst for such price movement. 

After the price of ATOM dropped to a weekly low of $6, the price rallied from this low to a high of $17, where the price faced resistance to breaking above this region to a height of $20.

The price of ATOM faced a rejection to a low of $12.5, where the price bounced and rallied to a high of $13.5 but could not move higher as the price continued to range. 

ATOM’s next weekly support is at $12.1, with the price eyeing a retest of that region; if ATOM fails to hold this region, we could see the price going lower as there is no strong weekly support close to this region.

Weekly resistance for the price of ATOM – $17.

Weekly support for the price of ATOM – $12.1.

Price Analysis Of ATOM On The Daily (1D) Chart
Daily ATOM Price Chart | Source: ATOMUSDT On Tradingview.com

In the daily timeframe, the price of ATOM continues to trade below key resistance formed by the uptrend line as the price broke below this trendline, helping ATOM to maintain its bullish structure for the past days it had trended.

The price of ATOM has shown strength, as the price has held on not going below key support, as this could lead to more sell orders for ATOM holders. 

Daily resistance for the ATOM price – $13.8.

Daily support for the ATOM price – $12.1-$10.4.

Onchain Analysis Of ATOM
ATOM Onchain Analysis | Source: On Messari.io

The ATOM price from the on-chain analysis looks more decent despite a fall of over 70%. ATOM produced a reasonable return on investment (ROI) of 64% over the past three months compared to other crypto assets that have struggled for the past months. 

Featured Image From zipmex, Charts From Tradingview and Messari

Cosmos (ATOM) Leads Gains Among Top Coins

Despite being down 2.74% as of writing, Cosmos (ATOM) still leads gains among top coins in the past week. The internet of blockchains has had its fair share of roses and thorns during the week. However, data from CoinMarketCap shows that ATOM has enjoyed several peaks and is still trading in the green. 

The blockchain has also experienced high trading volume within the past 24 hours, up 14.93%. It has also held its end against top coins like Wrapped Bitcoin, Cronos, and Ethereum Classic, considering the 7-Day trading activity. 

Related Reading: XRP Price Hits Target Of $0.5, But Can It Break This Key Resistance?

Lower Timeframe Structure Remains Bullish Despite ATOM Stall

The ATOM price has produced a sequence of higher lows during the last week. Crucially, it established a short-term uptrend by breaking above the prior lower highs at $12.54 and $12.84. Higher time frame charts saw this as more of a bounce. Plus, it was met with strong resistance around the $13.4 level.

As the price approaches the white ascending trendline, it may find some support there. A session closing below $13 would once again render the lower-timeframe structure bearish. This may cause prices to fall back to the $12.35-$12.4 support area. However, if ATOM can break out over $13.4, it might signal a significant upward trend. Such a rise can potentially drive ATOM over the $14.8 resistance zone that has been in place since late September.

As of this writing, the RSI reading was 46. Even though it has dropped below the neutral 50 levels, there is no sign of bearish momentum. The OBV was flat as well. This indicated that neither the purchasers nor the vendors were in a position of power. It also suggested that a bullish breakthrough was less likely to occur.

ATOM’s price is currently hovering below $13. | SourceL ATOMUSD price chart from TradingView.com
ATOM Records Higher Total Staked Value, Thanks to DeFi

The DeFi sector on Cosmos has been booming in recent weeks. After publishing the “Cosmos Hub Roadmap 2.0,” Cosmos received great interest from investors. In addition, the native token ATOM saw growth in terms of total value locked (TVL), development engagement, and the number of holders in the third quarter of 2022.

According to a tweet recently posted by the Cosmos Daily, the DeFi industry is one of the fastest-growing parts of the Cosmos ecosystem. The TVL of popular protocols like the Kava Network skyrocketed in the previous month to 291.2 million. Osmosis zone and THORChain, two other protocols, garnered $209 million and $105.85 million, respectively.

Related Reading: Bitcoin Volatility Index Suggests Large Price Move Arriving Soon

Still, on on-chain analytics, there was a steady increase in the number of cryptocurrency investors who held ATOM throughout the year. Despite this, there was no significant increase in the number of transactions or the volume. We also saw top DeFi platforms like dYdX move from Ethereum to Cosmos within the past week. One could say that many investors are in for the long ride, especially given dYdX’s big move and the blockchain’s plans outlined in its updated roadmap. 

Featured image from Pixabay and chart from TradingView.com

Cosmos Looks Promising As Price Rally, Can Price Breach $14?

  • ATOM price breaks downtrend as price gears up for a short-term recovery creating more bullish sentiment.
  • ATOM looks strong on the low timeframe. 
  • The price of ATOM breaks and holds above 8 and 20 EMA.

Cosmos (ATOM) showed so much strength as price trends for days, with many becoming interested as to why Cosmos (ATOM) trends against tether (USDT) in such market conditions. With the price of Bitcoin (BTC) showing some great momentum, we could see the price of altcoins, including ATOM, move easily as it eyes a rally to $14. (Data from Binance)

Crypto Market Outlook 
Crypto Market Outlook | Source: Coin360

The new month has been more of a relief for most crypto projects as altcoins, including the likes of ATOM, show bullish strength, with the price of BTC leading the market rallying from a low of $18,800 to $20,100. With the market looking more promising for crypto assets, we could see more recovery from cryptocurrencies as the previous month has prevented major altcoins from a rally.

Cosmos (ATOM) Price Analysis On The Weekly Chart

The price of ATOM in recent weeks showed so much strength as price rallied from a weekly low of $6 to a high of $17 with so many gains as the price topped the crypto chart for weeks showing no sign of weakness. 

ATOM’s price faced rejection as it was unable to break above $17.5, acting as resistance to the price of ATOM and the area of supply.

The price tried several times to flip this resistance area into support to rally higher to a region of $20, but the price was rejected due to more sell orders in that region. ATOM’s price dropped to a low of $12, acting as a good support area for the price in case of a sell-off.

The price of ATOM continued to range in this region of $12 before having a weekly close, with the price looking more bullish for the week as it aims a recovery to $14

ATOM’s price needs to hold above $13 for the price to have a chance to trend higher to the anticipated $14. If the price of ATOM fails to hold at $13, we could see the price retesting the region of $12. But if ATOM trends to $14 and flips it into support, we could retest the region of $17, acting as a supply area for ATOM price.

Weekly resistance for the price of ATOM – $14.

Weekly support for the price of ATOM – $12.5-$12.

Price Analysis Of ATOM On The Daily (1D) Chart
Daily ATOM Price Chart | Source: ATOMUSDT On Tradingview.com

The price of ATOM on the daily timeframe continues to look bullish as the price forms a descending triangle and breaks out of it with good volume.

ATOM’s price is currently trading at $13.90 as the price broke out of the descending triangle and trades slightly below the 8 and 20-day Exponential Moving average (EMA), acting as resistance zones for the price of ATOM. The price at $12.9 and $13.4 corresponds to the 8 and 20-day EMA for ATOM. 

Daily resistance for the ATOM price – $13.4-$14.

Daily support for the ATOM price – $12.5.

Featured Image From zipmex, Charts From Tradingview and Coin360 

Cosmos (ATOM) struggles To Stay Bullish, Is $20 Still Possible?

Cosmos (ATOM) has maintained so much bullish sentiment topping the charts in the crypto space; despite pullbacks across the market, Cosmos (ATOM) would recover with good volume and rally higher. The price has been faced with resistance on the weekly chart and has shown weakness as much doubt sets in if the price can reclaim the price of $20. (Data from Binance)

Cosmos (ATOM) Token Price Analysis On The Weekly Chart 
Weekly ATOM Price Chart | Source: ATOMUSDT On Tradingview.com

ATOM saw a decline in its price from $45 to around $6, with an over 70% drop from its all-time high despite having good fundamentals. The price of ATOM bounced off after touching a weekly low of $6, and the price rallied to $17, showing some great strength.

The price of ATOM on the weekly chart showed great strength rallying to $17 with strong volume, but the price was faced with major resistance at $17 on the weekly chart. ATOM failed to flip this weekly resistance into support as the price has maintained a decline but above its bullish trendline support.

For the price of ATOM to trend higher price needs to flip the weekly resistance into support and close above $17; if the price of ATOM fails to rally back to this region, we could see the price of ATOM retesting its support of $12.

The price of ATOM could retest its weekly support of $12, which is a healthy retracement. So far, the support of that region holds the price of ATOM from sell-off, and this would be a good zone for more buy orders, and a possible bounce as the price aims to maintain its bullish sentiment. If the price of ATOM fails to hold $12 support, we could see the price going to a low of $8.

Weekly resistance for the price of ATOM – $17.

Weekly support for the price of ATOM – $12.

Price Analysis Of ATOM On The Daily (1D) Chart
Daily ATOM Price Chart | Source: ATOMUSDT On Tradingview.com

The daily timeframe for ATOM prices continues to main the bullish structure it has formed as the price respects the trendline support holding up nicely despite seeing more sell volume. 

ATOM’s price needs to hold above this trendline support for the price to bounce and trend higher, but if the price of ATOM fails to hold, we could see the price of ATOM going to a daily low of $12.5.

On the daily timeframe, the price of ATOM is currently trading at $13.56, holding above the 50 Exponential Moving Average (EMA), acting as support for ATOM price. The price of $12.5 corresponds to the support at 50 EMA, acting as a good area for more demand for the price of ATOM; if the support at 50 EMA fails, we could see the price going to $9. 

The Relative Strength Index (RSI) for ATOM is above 50 on the daily chart, indicating low buy order volume. 

Daily resistance for the ATOM price – $15.

Daily support for the ATOM price – $12.5-$9.

Featured Image From zipmex, Charts From Tradingview 

Cosmos Touches Highest Point Since May As ATOM Expands 25%

Cosmos (ATOM) has managed to soar by 25% which is considered its highest point since the coin traded at around $15.70 on May 8.

  • ATOM’s trading volume spikes by 89% in past 24 hours
  • Cosmos’ NFT volume surged to $778,000 as seen on September 7
  • Cosmos 2.0 triggers 40% price pump for ATOM

Even though the recent figures are far from ATOM’s ATH seen at $44.45, the latest developments seem to have revived investor trust and confidence.

ATOM’s trading volume has also increased by 89% in the past 24 hours. However, ATOM’s dilemma is how to rally by taking the lead from the crypto king, Bitcoin (BTC).

Based on ATOM’s on-chain metrics, it seems that there is no disparity between the negative and positive sentiments.

It shows a balance with only a little difference spotted at 0.188, with the positive sentiment being 9.531. The negative sentiment remains at 9.413. NFT volume for Cosmos has spiked to $778,000 as observed on September 7.  

5 Unique Wallet Addresses Buy ATOM NFTs

The unique wallet addresses that purchased ATOM NFTs increased to five. On the other hand, both these metrics decreased while ATOM was in its glory in price hikes. More so, total NFT volume has nosedived to roughly $223,000 a few days ago, and at that time, the unique wallet addresses were limited to two.

Judging by the four-hour chart of ATOM/USDT, the coin may hover in the green lane for the short term. This assumption was validated by ATOM’s 20 EMA going over the 50 EMA.  

In the long term, the 200 EMA has shown that ATOM could retrace and register new lows in the coming months as it sits far from the short-term indicators. Further, ATOM investors and holders need to carefully watch out for any changes in volatility.

ATOM’s Bollinger Bands revealed that the token’s price increase has been precipitated by an uptick in volatility. With that in mind, it would be wise for investors to anticipate a downturn and play their cards right.

Cosmos 2.0 Rolls Out September 28

Cosmos’ development activity has also spiked after the blockchain company has announced plans of blockchain update.

Cosmos 2.0 is looming and as such, this has pumped up ATOM’s price by 40%. Frens Validator team, a passionate and supportive community of ATOM revealed the unfolding of important Cosmos developments in 2022.

Frens Validator team has posted an announcement via Twitter regarding the Cosmos 2.0 design which will soon be rolled out on September 28 in Medellin, Colombia.

The Cosmoverse 2022 is dubbed to be the biggest Cosmos event for Web3 developers, contributors, entrepreneurs, investors, and DApps owners.

The Cosmos 2.0 is designed to enhance the overall architecture and functionality of Cosmos (ATOM). These developments have triggered the surge of ATOM price from September 7 to 8, shooting from $12.3 to $17.5 in less than two days.

ATOM total market cap at $4.5 billion on the daily chart | Source: TradingView.com

Featured image from UseTheBitcoin, chart from TradingView.com

ATOM Expands Over 25% In Last Week, Keeps Bullish Run Since Mid-June

Cosmos (ATOM) has been a top-performer and exhibited a bullish fervor for the past couple of months, or since June.

  •         ATOM up by 25% in the past seven days
  •         Cosmos network collaborations such as with Polkadot is likely to increase demand
  •         ATOM price up by .04% as of press time

ATOM’s bullish streak has lingered on for the past week, showing a price pump of over 25%.

The crypto rallying for the past week happened after its successful rebound from the ascending support line. Despite the bullish momentum, ATOM could potentially go through a slippery slope.

This may happen due to the fact that the coin is currently trading around its key resistance level.

The crypto was able to test its key resistance level in May following an eclipse or crash. Cosmos failed to move past the key resistance zone present on August 24 and 25; respectively.

More so, ATOM has also experienced some hurdles present at that price level as seen in the past four days.

ATOM May Swerve Towards Bearish Detour

According to CoinMarketCap, ATOM price is up by 0.04% or trading at $12.83 as of this writing. ATOM seems to be swerving up and down validating a bearish detour.

As of press time, ATOM is looking like it’s heading towards a bearish retracement. Further, the altcoin’s selling pressure is considerably low which could be due to Cosmos’ overhaul of its delegation strategy.

The low selling pressure can also impact demand, especially with a spike in the number of validators.

On the brighter side, the ongoing development of Cosmos doesn’t seem to stain or dissuade ATOM’s optimistic outlook. Interestingly enough, the Cosmos network was able to maintain a positive development activity in the past month.

Cosmos Network Integrations To Boost Demand

There are exciting developments underway such as the upcoming integration of Cosmos and Ethereum Beacon chain and the fusion of Polkadot and Cosmos’ IBC.

These partnerships or collaborations are bound to ramp up the demand for DOT. Further, the Cosmos network will be integrating with a number of blockchain networks which can predictably increase the demand for ATOM plus optimize its price action.

Additionally, investors ought to take advantage of the fact that despite its ongoing rally, the altcoin is still low-priced. Investors should also note that the cryptocurrency is still heavily discounted, despite its recent upside.

However, a retracement is possible despite its upswing mainly due to increased selling activity.

Crypto total market cap at $954 billion on the daily chart | Source: TradingView.com
Featured image from UseTheBitcoin, chart from TradingView.com

Cosmos Hub Soars Over 5% Within 24 Hours – ATOM Up 13% In Last Week

Cosmos (ATOM) coin buyers have clasped on the $10 level as its support zone.

  • Cosmos (ATOM) coin soars by over 5% as seen in the past 24 hours.
  • ATOM still fluctuates wildly as observed in the upwards parallel channel.
  • Coin’s price has made impressive traction and surged by 13% in the past week.

According to CoinMarketCap, ATOM is having a sweeping uptrend at $12.09 or an impressive spike of 4.46% as of this writing. Currently, ATOM’s ATH is set at $44.45 which means the bulls have to work a bit harder than usual to push the price further up.

ATOM’s Trading Volume Spikes 102.0% In Past Week

The daily chart shows the volatility and price movement for Cosmos Hub (ATOM). Currently, ATOM’s trading volume has spiked by 102.0% as seen in the past week. The total circulating supply or volume of ATOM has however dropped by 0.27%. As of now, ATOM ranks as the 28th largest crypto in terms of the market cap which is currently at $3.47 billion.

It seems the bears moved away from ATOM as the bulls continue to drive the price higher. Cosmos Hub has had an impressive rally seen in the past couple of weeks due to aggressive buying pressure. ATOM coin is seen to be consistently moving upwards for the past few weeks. More so, the bulls were also re-energized after they revisited the coin’s support line.

In the event that the buyers breach ATOM’s resistance zone, the buyers are optimistic about a 60% ROI in the coming days. Buyers are definitely pushing the price up with $10 poised as the support zone and the $12.5 level as the bullish hurdle.

Cosmos: $20 On Target

Buyers are constantly eyeing the next resistance zone as a breach on this level may propel the asset’s price to an uptick peaking at $20.

ATOM’s market cap has spiked by 4.8% overnight or registered at $3.4 billion. The increase in trading volume also hints at the surge of buying momentum. ATOM’s RSI also shows that it was able to break the falling trendline and near the oversold mark. Moreover, the coin’s MACD also indicates a bullish movement for ATOM.

Buyers are looking forwards to the bulls breaching and hovering above the resistance zone of $12.5. Despite the hurdles that the bulls face, buyers are positive that a 60% spike is possible from the current level and may in fact pump the price to $20.

ATOM total market cap at $3.35 billion on the daily chart | Source: TradingView.com

Featured image from CoinCentral, Chart from TradingView.com

TA- Cosmos Could Be Set For A Wild Rally Ahead Of Crucial Breakout

The price of Cosmos (ATOM) could be set for a wild rally with a potential breakout against Tether (USDT) ahead of summer relief for altcoins. 

Ethereum price saw a relief bounce from $1,600 to $1,800 ahead of merge sentiments leading to other altcoins like Cosmos breaking out in price. (Data feeds from Binance)

Price Analysis Of ATOM On The Weekly Chart
Weekly Price Chart Analysis For ATOM | Source: ATOMUSDT On Tradingview.com

From the chart, the price of ATOM saw a weekly low of around $6.5, which bounced from that range and rallied to $11.3.

The price has built more momentum as it faces resistance at $17.

If the price of ATOM on the weekly chart continues with this bullish structure, it could quickly hit the $17 mark.

The volume shows decent buy bids, pushing the price of ATOM higher.

Weekly resistance for the price of ATOM – $17.

Weekly support for the price of ATOM – $6.5.

Price Analysis Of ATOM On The Daily (1D) Chart
Daily Price Chart Analysis For ATOM | Source: ATOMUSDT On Tradingview.com

The price of ATOM found strong support at around $6.2, with what seems to be an area of interest on the daily chart.

ATOM bounced from its support, forming a bullish trendline that acts as a support and has continued to maintain this structure. 

At the point of writing, the price of ATOM is at $12, trading above the 50 exponential moving averages (EMA), which corresponds to the support at $10. 

If the 50 EMA region fails to hold the price, $9 would be a good support to hold sell-offs and for a possible price bounce.

With more buy bids, we could see the price of ATOM retesting at $16 -$17, which has been resistance on the daily chart.

The RSI for ATOM price on the daily chart is 65, indicating healthy buy bids for ATOM.

The volume for ATOM looks good, indicating positive signs for ATOM prices to trend higher.


Daily (1D) resistance for ATOM price – $17.

Daily (1D) support for ATOM price – $10, $9.

Price Analysis Of ATOM On The Four-Hourly (4H) Chart
Four-Hourly Chart Analysis For ATOM | Source: ATOMUSDT On Tradingview.com

The price of ATOM has shown a bullish breakout from a symmetric triangle on the 4H chart, with the price closing above it.

ATOM has struggled in this region, forming a range in a triangle with price rejecting from $11.5.

ATOM price is $12, trading above the 50 & 200 EMA with prices of $10.7 and $10 on the 4H chart. These prices would act as support areas for ATOM on the 4H chart.


Four Hourly (4H) resistance for ATOM price – $16.

Four hourly (4h) support for ATOM price – $10.7, $10.


A break below these support zones could send the price of ATOM to a region of $9, acting as a good support area.

Featured image from NewsBTC, Charts from TradingView.com