Cosmos (ATOM) Wyckoff Analysis (May 2022 – Dec 2023)

Wyckoff Analysis (WA) aims to understand why prices of stocks and other market items move due to supply and demand dynamics. It typically is applied to any freely traded market where larger or institutional traders operate (commodities, bonds, currencies, etc.). In this article we will apply WA to the cryptocurrency Cosmos ($ATOM) to make a forecast for approximate future events.

TradingView Chart

Link to the raw image: https://www.tradingview.com/x/r8asKWOI

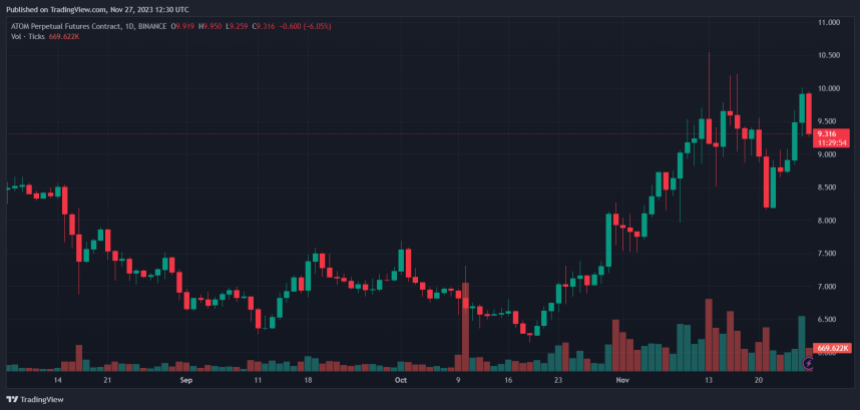
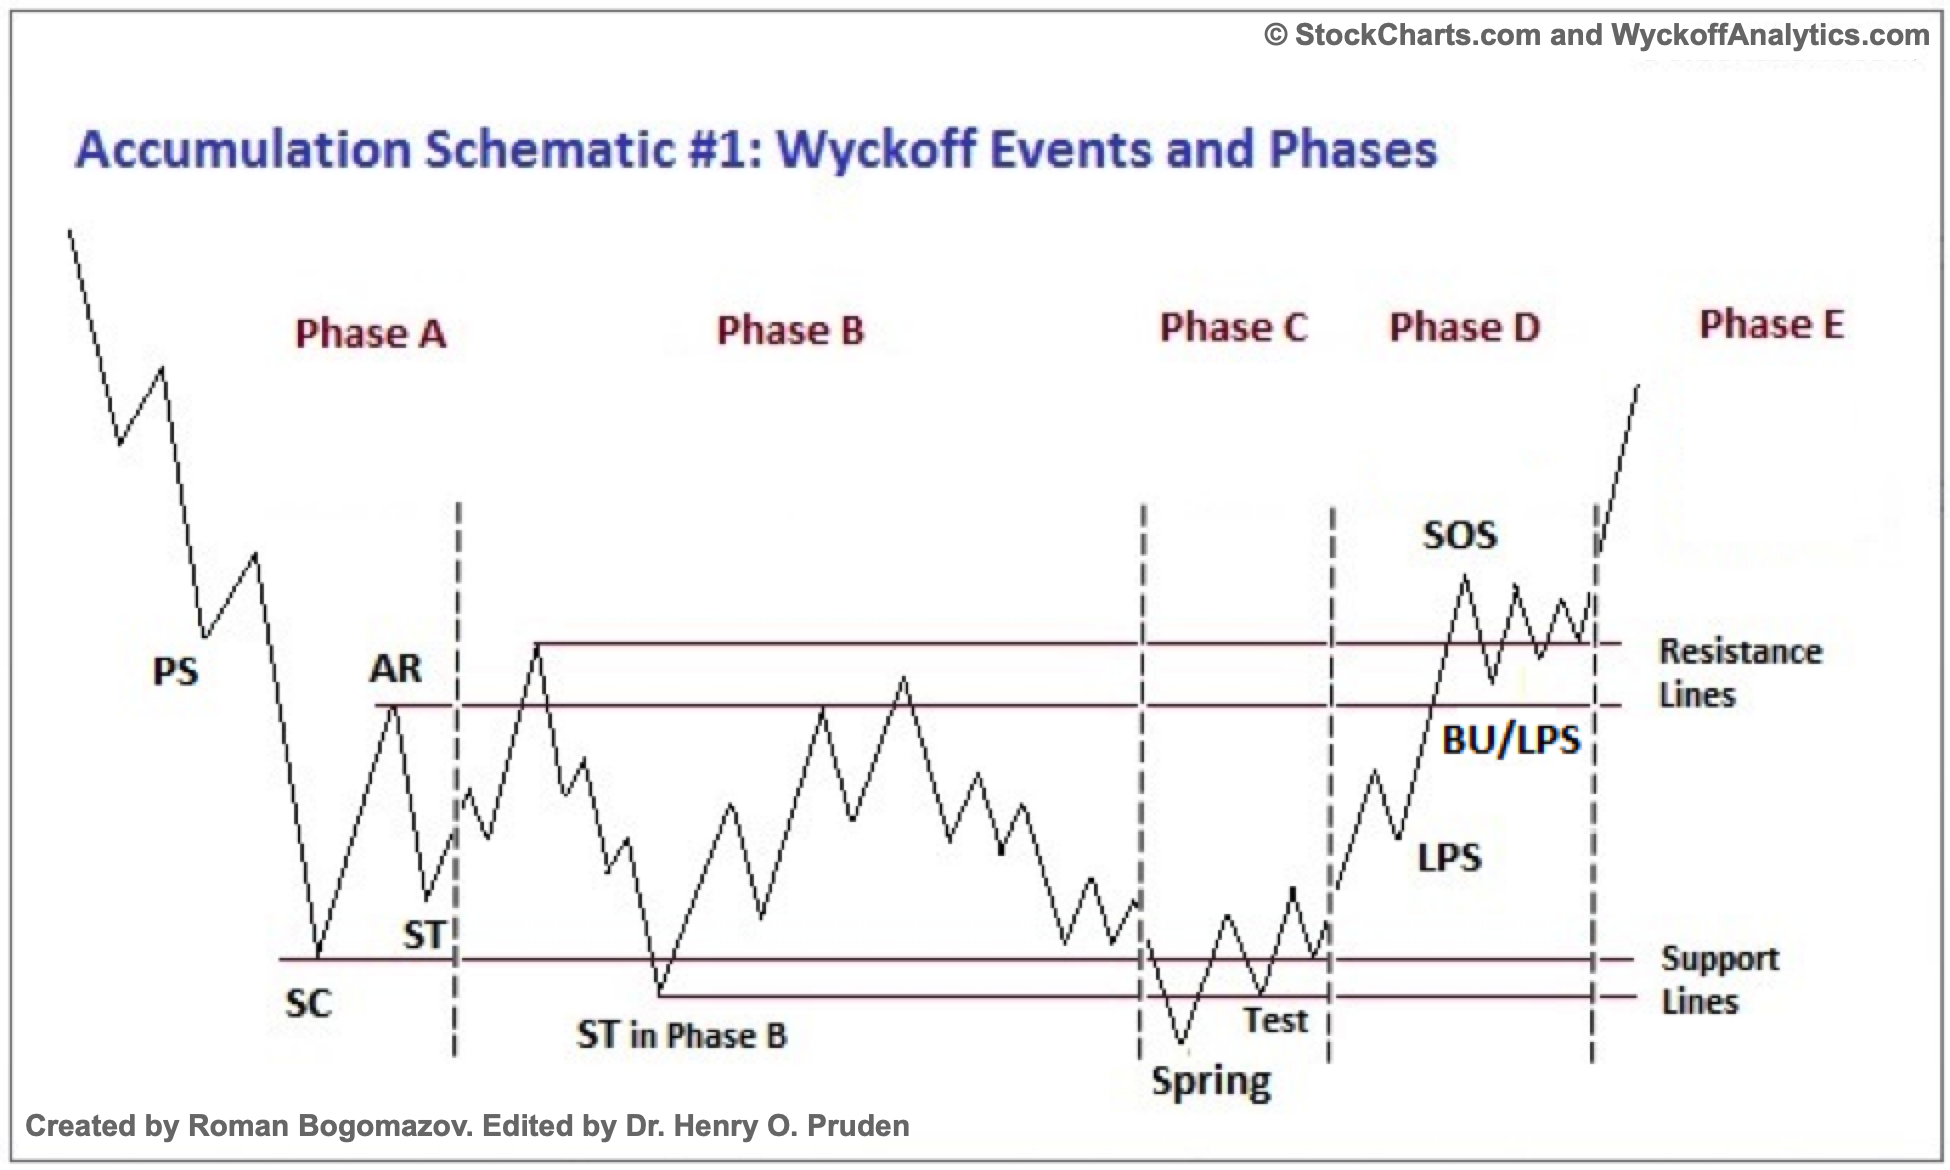
Cosmos $ATOM is currently in Phase D of a Wyckoff Accumulation Schematic #1. Note the volume spike near where I placed the SC and Spring. In Wyckoff Analysis these typically must align even if the overall form isn’t perfect. The only slight anomaly is that the ST dips sharply below the SC breaking the ICE (not labeled). There are Advanced Schematics that you can find online that accommodate many of these anomalous formations.

Phase D is where demand greatly overcomes supply leading the rallies on higher (or noticeably increasing) volume. When an LPS occurs that is typically a favorable (even optimal) place for a long position. It recently finished a Reaccumulation, to which it’s rallying sharply. Below are the typical schematics for both Wyckoff Accumulation Schematic #1 and a Reaccumulation for reference.

Cosmos Price Targets

The basic target (per the schematic) is the top of the trading range. In this case it’s at $18, but $15 is a preliminary target it must concretely clear first. Doing some more work using the Horizontal Count method with PnF charts yields different results. My settings are currently a $0.25 box size and a three box reversal on a High-Low lookback.

When using the Horizontal Count method Extended Congestions need to be accounted for differently. The main thing is finding the relevant column in and out to create the Congestion Box. In our case that’s from 13 to 20 December 2023 spanning 7 bars. Since this is a Reaccumulation “breakout” we will need to add the value from the formula the Horizontal Count uses.

7 x $0.25 x 3 = $5.25

The relevant low to add this to is $10.25 so the PnF target is $15.5.

Glossary

All quotes are from the first link in Supplemental Reading.

Preliminary Support (PS) – “where substantial buying begins to provide pronounced support after a prolonged down-move”

Selling Climax (SC) – “the point at which widening spread and selling pressure usually climaxes and heavy or panicky selling by the public is being absorbed by larger professional interests at or near a bottom”

Automatic Rally (AR) – “occurs because intense selling pressure has greatly diminished”

Secondary Test (ST) – when “price revisits the area of the SC to test the supply/demand balance at these levels”

Spring – “allow the stock’s dominant players to make a definitive test of available supply before a markup campaign unfolds”

Test – where larger traders “test the market for supply throughout a TR”

Sign of Strength (SoS) – “a price advance on increasing spread and relatively higher volume”

Last Point of Support (LPS) – “a pullback to support that was formerly resistance, on diminished spread and volume”

Back Up (BU) – “a common structural element preceding a more substantial price mark-up, and can take on a variety of forms, including a simple pullback or a new TR at a higher level”

Supplemental Reading

The Wyckoff Method: A Tutorial” by Bogomazov & Lipsett

Reaccumulation Review” by Bruce Fraser (2018)

Jumping the Creek: A Review” by Bruce Fraser (2018)

Distribution Review” by Bruce Fraser (2018)

Introduction to Point & Figure Charts” from StockCharts

P&F Price Objectives: Horizontal Counts” from StockCharts

The Wyckoff Methodology in Depth” by Rubén Villahermosa (2019)

Wyckoff 2.0: Structures, Volume Profile and Order Flow” by Rubén Villahermosa (2021)

Cosmos (ATOM) Elliott Wave Summary (2019 – 2023)

Cosmos ($ATOM) is the coin that powers the entire Cosmos ecosystem. It consists of a variety of projects from different spheres such as finance, decentralized exchanges (DEX), and cloud computing. The earliest price data I can find for $ATOM is from Kraken, starting in April 2019. Using this price data, the remainder of the article represents my best efforts to apply Elliott Wave Theory (EWT) to isolate its placement in market structures. I will assume that you have some knowledge of EWT to understand the terms, but I have also included a small glossary at the bottom for reference.

EWT Summary

TradingView Chart

A link to the raw image since it might be hard to see all the details: https://www.tradingview.com/x/jIKwljmV.

Cycle Wave 0 – Mar 2020 – $1.1151
Primary Wave 1 – $2.4794
Primary Wave 2 – $1.8482 (38.2% LFR)
Primary Wave 3 – $32.2433 (3.618 LFE)
Primary Wave 4 – $7.872 (50% LFR)
Primary Wave 5 – $44.7383 (1.236 LFE)
Cycle Wave 1 – Sep 2021 – $44.7383

Primary Wave A – $20.2221 (Contracting, Leading Diagonal)
Primary Wave B – $33.2641 (Contracting Triangle)
Primary Wave C – $5.5409 (Impulse)

Cycle Wave 2 – Jun 2022 – $5.5409 (50% LFR)

Primary Wave 1 – ONGOING
Primary Wave 2 – TBA
Primary Wave 3 – TBA
Primary Wave 4 – TBA
Primary Wave 5 – TBA

Cycle Wave 3 – ONGOING

Exploring Further

EWT uses ratios to create price targets. The main target being the 1.618 LFE, however there are the minimum, lower, and much higher LFE’s to watch out for. For $ATOM we first need to find the beta multiple to scale the targets off of. This is accomplished by taking Wave 1 and dividing it by Wave 0. In this case for the Cycle Wave Degree it’s approximately 40.12. Then we raise this multiple to various numbers defined by EWT to create a table of targets. In order below are the LFE Price Targets:

0.618 – $54.26

1 – $222.3

1.236 – $531.3

1.618 – $2,176.84

Therefore, if we expect $ATOM to be a Diagonal then $54.26 – $222.3 is the preferred price box.

If we are looking for the typical price box then it’s: $531.3 – $2,176.84.

However, due to the nature of the next estimated bull run only the Intermediate Degree Wave 3 of the Cycle Wave 3 should play out. The next bull run is estimated by many traders and institutions to peak around late 2024 to early 2026. Benner Cycle Theory also puts a market peak around 2026. You can see the full layout for Benner’s Cycle Theory here. As such, the Intermediate Wave 1 and 2 are: $17.2656 and $6.17. The beta multiple for the Intermediate Degree is approximately 3.116. Then as we did for the Cycle Wave Degree the relevant typical price box is: $25.14 – $38.81. The higher price boxes are all above the ATH for $ATOM. The current price action for $ATOM is overwhelmingly bullish, so the higher price boxes are definitely a possibility.

TradingView Chart

A link to the raw image since it might be hard to see all the details: https://www.tradingview.com/x/FQhUSWST.

Conclusion

Given the next bull run peak for crypto is likely late 2024 to early 2026 the relevant LFEs to use for $ATOM are at the Intermediate Wave Degree . The typical price targets for the Intermediate Degree Wave 3 are $25.14 – $38.81. The price as I write is $11.3 so the next peak is a rough 2 to 3.5x from here. If the Wave 3 is heavily extended and possibly goes to the 2.618 or 3.618 LFE then a new ATH is possible. That would mean a minimum of a 4x from here to the next peak. The Primary Wave 1 of Cycle Wave 3 is likely due in late 2026 to 2030 using Fibonacci Time Ratios.

Glossary

Elliott Wave Theory (EWT)

“A theory in technical analysis that attributes wave-like price patterns, identified at various scales, to trader psychology and investor sentiment.”

Source: “Elliott Wave Theory: What It Is and How to Use It” by James Chen (2023)

Logarithmic Fibonacci Retracement (LFR)

A measured correction at certain Fibonacci ratios on a semi-log scale.

Logarithmic Fibonacci Extensions (LFE)

A measured rally at certain Fibonacci ratios on a semi-log scale.

Supplemental Reading

Elliott Wave Principle – Key To Market Behavior” by Frost & Prechter (2022)

Visual Guide to Elliott Wave Trading” by Gorman & Kennedy (2013)

How to Calculate Logarithmic Retracements and Extensions” by C. D. Chester (2023)

Cosmos Co-Founder’s Controversial Proposal Triggers 11% Plunge In ATOM

In a bold move, Cosmos co-founder Jae Kwon has called for a significant shift in the blockchain’s direction following the controversial passing of NWV #848. This proposal was approved by the community’s voting mechanism, earning around 40% of the votes, and it was aimed at changing the blockchain’s native token inflation rate.

Kwon, expressing his dissent, is now advocating for a coordinated “split” in the Cosmos ecosystem, a proposal that could reshape the blockchain’s future. This development comes in response to what Kwon perceives as “deviating from the network’s core principles.”

“AtomOne” Split, Cosmos Co-Founder Urges Community Engagement

Kwon’s proposal, termed “AtomOne,” is not just a divergence but an exodus from the current state of Cosmos, encouraging community members who voted ‘No’ to join this new venture. The plan is still in its infancy and laid out in a GitHub repository, where Kwon invites community ideas and participation in shaping this new direction.

He emphasizes a collaborative approach, urging the community to discuss and contribute to the formation of AtomOne.

The essence of AtomOne lies in integrating $ATOM with $ATMO/$ATOM1, aiming to prevent a “complete collapse of ATOM by mass selling.” Kwon suggests that instead of abandoning ATOM altogether, there should be a way for it to coexist with the new fork.

Cosmos Community Faces a Crossroads: Exodus And Innovation

Kwon’s vision for AtomOne involves forking the current “cosmoshub4” but with its development path and teams, aiming for a more decentralized structure than the current Gaia. This new entity is open to all who opposed the recent vote, signaling a departure from the traditional paths of blockchain governance.

Kwon highlights the power of the minority in blockchain ecosystems and the ability to self-organize and create antifragile structures.

His message is clear: those who do not align with sound logic are destined to fail, and the future belongs to those who dare to exodus and build a better civilization. Kwon assures that this move isn’t about abandoning the original Cosmos hub but saving it and redefining its role.

People are completely confused about the nature of blockchains what power the NO/NWV voters have altogether inside and outside the hub. The reality is that we exist, our principles and goals are aligned because they come from logic and we are about to demonstrate antifragility. The reality is that you cannot take control of a chain even with over 50% consensus, even 67%, because the minority can always self-organize even without your help. And the reality is that those who don’t make decisions based on sound logic always end up failing in the end.

As the community gears up for this potential split, Kwon’s call for a departure to AtomOne reflects a pivotal moment in Cosmos’ history and a testament to blockchain governance’s dynamic and evolving nature. A conversation that will continue for “generations.”

As a result of the split proposal, ATOM has seen a spike in volatility, recording an 11% loss over the past few days. However, speculation is that the split will involve an airdrop poised to attract positive attention for the token.

Cosmos ATOM ATOMUSDT ATOM price

Cover image from Unsplash, chart from Tradingview

Cosmos (ATOM) Bears Dominate As Bulls Struggle To Drive Price

Cosmos (ATOM) experienced a short bullish momentum on May 10, 2023. The asset saw an increase of 10.89% taking its price to a high of $11.2.

However, the bears regained control of the market on May 13 and sent the coin to its current price of $10.40, representing a decrease of 1.12%. From the beginning of May 2023 till date, ATOM has witnessed a price decline of 11.2%, based on its current price.

Bears In Control of Comos (ATOM) Price

The ATOM/USDT daily chart suggests that the market sentiment for Cosmos (ATOM) is predominantly bearish. It also shows a downward price movement dominating and hindering any potential bullish momentum.

Related Reading: Data Suggests Small Holders Will Drive Next Cardano (ADA) Rally

The price of ATOM was influenced negatively by the recent chaotic legal battle with its former growth and strategy chief, Grace Yu. 

The news raised negative sentiments among investors and market participants toward Cosmos (ATOM). The Validators even urged Cosmos founder Kwon Jae to close the case against Grace Yu. And this action indicates a level of concern within the Cosmos community.

Negative sentiment towards an asset can influence investor behavior, decreasing demand for ATOM and potentially contributing to downward pressure on its price.

An example of this is that ATOM has been trending down since April 17, suggesting a bearish sentiment. The trendline now serves as a reference for identifying potential resistance levels since the asset has tested it severally.

Cosmos (ATOM) Bears Dominate As Bulls Struggle To Drive Price

Cosmos (ATOM) trades between $10.160 and $11.301 support and resistance levels. ATOM breaking through the $10.160 primary support level will confirm the bearish momentum. Afterward, the bears might target the next support level at $8.441.

However, the bulls are trying hard to push the price to the primary resistance level of $11.301 but couldn’t due to the high bearish momentum. 

ATOM Technical Analysis

ATOM is trading below its 200-Day and 50-Day Simple Moving Averages (SMA), suggesting a bearish market sentiment. 

This level indicates that ATOMs’ recent and long-term price averages are declining, potentially indicating a negative trend and a higher likelihood of further downward price movement.

Related Reading: Meme Coin Season May Be Over As PEPE, SHIB, DOGE, Continue Decline

The Moving Average Convergence/Divergence (MACD) confirms the bearish market sentiment as the asset trades the signal line. It suggests that the short-term moving average moves lower than the longer-term moving average, pointing toward downward momentum.

Meanwhile, the Relative Strength Index (RSI), with a reading of 43.29, suggests a neutral market sentiment. 

The indicator shows the price is neither overbought nor oversold. For now, the ATOM price outlook is bearish. But crypto assets are volatile and could deviate from predicted price trends without warnings.

Featured image from Pixabay and chart from Tradingview.com

Cosmos (ATOM) Price Trends Upwards: A Potential Breakout Or Impending Correction?

After experiencing a bearish trend on April 17, 2023, that dropped the asset to a low of $10.12 from $12.88, Cosmos (ATOM) has managed to recover slightly.

Between February 8 and May 17, ATOM witnessed a significant decline of 32.89%, reaching a low point of $10.175 on May 9. The current month has, however, brought a surge in demand for Cosmos (ATOM), leading to a remarkable price performance. 

What’s Ahead For Cosmos (ATOM)?

According to data, ATOM experienced a substantial price decline, reaching $10.73, a 0.95% decrease within the last 24-hour trading period.

Related Reading: Will Dogecoin (DOGE) Break Free From Limbo? Market Awaits Bullish Catalyst

Notably, the 24-hour trading volume is up by 9.04%, rising to $85 million, indicating that the market activities around ATOM are increasing. More buyers and sellers are actively participating in trading ATOM. 

Also, an increase of more than 9% signifies potential price volatility, which might influence the price of ATOM. But the current market sentiment of ATOM is bearish as its Fear and Greed Index shows 28, fear. 

This indicates a potential downtrend as investors and traders fear entering the market. This may also lead to high sell pressure from the investors. Based on the Fear & Greed Index reading, the market may likely experience some price correction if the bears maintain this momentum in the coming days.

Cosmos (ATOM) Technical Analysis

The 200-day and 50-day Simple Moving Averages (SMAs) currently exceed the ATOM/USDT trading pair price. This indicates that the market is on a bearish trend in longer and shorter timeframes.

Also, this means that the selling momentum is stronger than the buying. However, if the bulls increase the buying pressure, some price changes might occur in a few days.

The Relative Strength Index shows 44.91, meaning there’s market indecision between buyers and sellers. The market in a neutral zone indicates low pressure from buyers and sellers.

Cosmos (ATOM) Price Trends Upwards: A Potential Breakout or Impending Correction?

However, the MACD is above the signal line depicting a potential bullish momentum for ATOM. Also, the histogram is currently above the zero level, validating the bullish sentiment. 

Latest Development To Spike Network Utility

The ecosystem recently announced the adoption of its first Cosmos native shared security model by a widely known Permissionless CosmWasm platform called Neutron

The Replicated Security brings a new era of utility to the network. It will also help Cosmos Hub to offer security to new projects launching as Hub-secured consumer chains.

The consumer chain will share its revenue with the Hub in exchange, and will also be shared with ATOM validators.

Neutron being the first platform to pioneer Cosmos Hub Replicated security, will enjoy instant access to the multi-billion dollar economic security of the Hub.

This recent development could attract more investors, traders, and institutions into the network, driving the demand for ATOM significantly over time.

featured image from Pixabay and chart from Tradingview

Cosmos (ATOM) Price Displays Intense Momentum – What’s Driving The Rally?

Cosmos (ATOM) demand has risen these past few days, resulting in a significant performance. According to CoinMarketCap data ATOM price has fallen to $11.69 after gaining momentum.

The current market cap of ATOM is $3.3 billion, with a 24-hour trading volume of $100 million. However, the trading volume is still down by 31.18%, indicating reduced network activity. 

Reason Behind The Surge In Cosmos?

Cosmos is a constantly growing network of interconnected blockchains created with developer-friendly application components. 

Inter-Blockchain Communication (IBC) protocol is the technology that connects these apps. The SDK platform Cosmos offers allows programmers to produce top-notch decentralized apps (dApps).

Other developers have also constructed applications on top of it, such as MM Finance and VVS Finance. Cosmo’s (ATOM) recent price surge could be attributed to its influx of developers topping that of Ethereum. 

The other reason for the ATOM price increase might be the announcement from dYdX that it is building an independent blockchain on the Cosmos ecosystem instead of Ethereum.

Also, Bitcoin price soared above $29,000, pushing the market cap of all cryptocurrencies to surpass $1 trillion. Many crypto assets, including ATOM, recorded price growth due to correlation to BTC. 

ATOM Price Action

Below is the technical analysis of ATOM price action on the 4-hour trading timeframe. And also the possible resistance and support zones.

Cosmos has broken through the short-term resistance level of $11.69 and is currently trading between $10.571 and $15.484 support and resistance levels. ATOM must break through the $15.484 primary resistance level to confirm the bullish momentum.

Cosmos (ATOM) Price Displays An Intense Momentum, What's Driving The Rally?

However, the bears are trying hard to break the $10.571 support level but couldn’t due to the high bullish momentum. If the bull’s strength is not strong enough to push ahead, the bears might take over the trend and cause a trend reversal.

What Do The Technical Aspects Suggest?

ATOM’s 50-Day SMA’s change in direction caused the market’s structure to change. If the bullish momentum doesn’t pick up, the trend may change to a potential bearish market. 

The 50-Day SMA established a Death Cross by crossing below the 200-Day SMA, indicating a potentially bearish signal and suggesting a selling opportunity.

The Relative Strength Index (RSI) analysis indicator enables traders to determine the momentum and strength of the price movement of an asset within a period.

At the time of analysis, the RSI of ATOM/USDT is at 61.74 above the neutral zone. Therefore, this shows that ADA is neither in the overbought nor oversold zone. However, the buyers are building momentum to take ADA to the overbought zone while the seller pushes it down despite weak momentum.

Featured image from Forkast News and Chart: TradingView

Cosmos (ATOM) Invalidates Uptrend; Where Is The Next Area Of Interest For Price?

  • ATOM price struggles on high timeframes to trend higher despite showing bullish sentiment in recent times. 
  • ATOM trades below uptrend support as the price looks bearish with the current market state.
  • The price of ATOM eyes key support as price trades below 50 and 200-day EMA. 

The price of Cosmos (ATOM) struggles to discover its bullish trend as the price breaks below uptrend support against tether (USDT). The previous weeks saw the crypto market cap looking good as prices of Bitcoin (BTC) and other crypto assets, including Cosmos (ATOM), showed so much strength as price rallied from a low of $6 to a high of $17. (Data from Binance)

Cosmos (ATOM) Price Analysis On The Weekly Chart.

Despite showing some great price movement in recent weeks with so many traders and investors becoming interested in the different projects being built on the Cosmos ecosystem, this, in a way, is a huge catalyst for such price movement. 

After the price of ATOM dropped to a weekly low of $6, the price rallied from this low to a high of $17, where the price faced resistance to breaking above this region to a height of $20.

The price of ATOM faced a rejection to a low of $12.5, where the price bounced and rallied to a high of $13.5 but could not move higher as the price continued to range. 

ATOM’s next weekly support is at $12.1, with the price eyeing a retest of that region; if ATOM fails to hold this region, we could see the price going lower as there is no strong weekly support close to this region.

Weekly resistance for the price of ATOM – $17.

Weekly support for the price of ATOM – $12.1.

Price Analysis Of ATOM On The Daily (1D) Chart
Daily ATOM Price Chart | Source: ATOMUSDT On Tradingview.com

In the daily timeframe, the price of ATOM continues to trade below key resistance formed by the uptrend line as the price broke below this trendline, helping ATOM to maintain its bullish structure for the past days it had trended.

The price of ATOM has shown strength, as the price has held on not going below key support, as this could lead to more sell orders for ATOM holders. 

Daily resistance for the ATOM price – $13.8.

Daily support for the ATOM price – $12.1-$10.4.

Onchain Analysis Of ATOM
ATOM Onchain Analysis | Source: On Messari.io

The ATOM price from the on-chain analysis looks more decent despite a fall of over 70%. ATOM produced a reasonable return on investment (ROI) of 64% over the past three months compared to other crypto assets that have struggled for the past months. 

Featured Image From zipmex, Charts From Tradingview and Messari

Cosmos Looks Promising As Price Rally, Can Price Breach $14?

  • ATOM price breaks downtrend as price gears up for a short-term recovery creating more bullish sentiment.
  • ATOM looks strong on the low timeframe. 
  • The price of ATOM breaks and holds above 8 and 20 EMA.

Cosmos (ATOM) showed so much strength as price trends for days, with many becoming interested as to why Cosmos (ATOM) trends against tether (USDT) in such market conditions. With the price of Bitcoin (BTC) showing some great momentum, we could see the price of altcoins, including ATOM, move easily as it eyes a rally to $14. (Data from Binance)

Crypto Market Outlook 
Crypto Market Outlook | Source: Coin360

The new month has been more of a relief for most crypto projects as altcoins, including the likes of ATOM, show bullish strength, with the price of BTC leading the market rallying from a low of $18,800 to $20,100. With the market looking more promising for crypto assets, we could see more recovery from cryptocurrencies as the previous month has prevented major altcoins from a rally.

Cosmos (ATOM) Price Analysis On The Weekly Chart

The price of ATOM in recent weeks showed so much strength as price rallied from a weekly low of $6 to a high of $17 with so many gains as the price topped the crypto chart for weeks showing no sign of weakness. 

ATOM’s price faced rejection as it was unable to break above $17.5, acting as resistance to the price of ATOM and the area of supply.

The price tried several times to flip this resistance area into support to rally higher to a region of $20, but the price was rejected due to more sell orders in that region. ATOM’s price dropped to a low of $12, acting as a good support area for the price in case of a sell-off.

The price of ATOM continued to range in this region of $12 before having a weekly close, with the price looking more bullish for the week as it aims a recovery to $14

ATOM’s price needs to hold above $13 for the price to have a chance to trend higher to the anticipated $14. If the price of ATOM fails to hold at $13, we could see the price retesting the region of $12. But if ATOM trends to $14 and flips it into support, we could retest the region of $17, acting as a supply area for ATOM price.

Weekly resistance for the price of ATOM – $14.

Weekly support for the price of ATOM – $12.5-$12.

Price Analysis Of ATOM On The Daily (1D) Chart
Daily ATOM Price Chart | Source: ATOMUSDT On Tradingview.com

The price of ATOM on the daily timeframe continues to look bullish as the price forms a descending triangle and breaks out of it with good volume.

ATOM’s price is currently trading at $13.90 as the price broke out of the descending triangle and trades slightly below the 8 and 20-day Exponential Moving average (EMA), acting as resistance zones for the price of ATOM. The price at $12.9 and $13.4 corresponds to the 8 and 20-day EMA for ATOM. 

Daily resistance for the ATOM price – $13.4-$14.

Daily support for the ATOM price – $12.5.

Featured Image From zipmex, Charts From Tradingview and Coin360 

Cosmos Struggles With $17 As Price Heads Into Distribution Phase

  • ATOM struggles to break $17 as the price gets rejected.
  • The price of ATOM enters the distribution phase on a daily timeframe.
  • ATOM’s price needs to hold the key support at $12 to maintain a bullish structure.
  • Hidden bearish divergence resurfaces in the 4H timeframe.

Cosmos (ATOM) has been the major player of the current relief bounce, with price rallying from a region of $6 to $17, with many paying so much attention to its ecosystem as this could prove to be a major player also in the bull run. The price of Cosmos (ATOM) showed so much strength, holding pretty well against tether (USDT) as the market continued to decline in price.

Cosmos (ATOM) Price Analysis On The Weekly Chart 

Despite a decline in its price from $45 to $6, over 70% decline from its all-time high, the price of ATOM showed great strength as price bounced from its weekly low of $6, rallying to a high of $17 before facing a rejection to break above that region to higher heights.

The price of ATOM on the weekly chart looks strong despite seeing more sell orders lately as the price continues to hold. For ATOM to resume, its bullish sentiment price needs to rally and break above $17, as this has proven to be a resistance to ATOM prices.

ATOM’s price is trading at $14.3 below its resistance; the price of ATOM needs to hold above $12 to avoid the price from going lower due to the sell-off. If the price of ATOM holds this region, there could be more belief of a rally to its resistance at $17 and possibly breaking and holding above this region.

A break below $12 would mean retesting lower demand zones and reluctance for bulls to step into buy orders as there would be more agitation for lower prices. 

For ATOM’s price to restore its bullish move price need to break and hold above the $17 resistance preventing the price of ATOM from trending higher. If the price of ATOM keeps rejecting the trendline resistance, we could see the price going lower as there are more sell orders than buy orders. 

Weekly resistance for the price of ATOM – $17.

Weekly support for the price of ATOM – $12.

Price Analysis Of ATOM On The Four-Hourly (4H) Chart
Four-Hourly ATOM Price Chart | Source: ATOMUSDT On Tradingview.com

The 4H timeframe for ATOM prices continues to weaken as prices break to the downside, as there seems to be a hidden bearish divergence suggesting the price of ATOM could retest the support area at $13.

On the 4H timeframe, the price of ATOM is currently trading at $14.5 below the 50 Exponential Moving Average (EMA), acting as resistance for ATOM price. The price of $15.2 corresponds to the resistance at 50 EMA for the price of ATOM. The price of ATOM needs to hold the support area at $13, which corresponds to the 200 EMA. 

Four-hourly resistance for the ATOM price – $15.2.

Four-hourly support for the ATOM price – $13.

Featured Image From zipmex, Charts From Tradingview 

Cosmos (ATOM) struggles To Stay Bullish, Is $20 Still Possible?

Cosmos (ATOM) has maintained so much bullish sentiment topping the charts in the crypto space; despite pullbacks across the market, Cosmos (ATOM) would recover with good volume and rally higher. The price has been faced with resistance on the weekly chart and has shown weakness as much doubt sets in if the price can reclaim the price of $20. (Data from Binance)

Cosmos (ATOM) Token Price Analysis On The Weekly Chart 
Weekly ATOM Price Chart | Source: ATOMUSDT On Tradingview.com

ATOM saw a decline in its price from $45 to around $6, with an over 70% drop from its all-time high despite having good fundamentals. The price of ATOM bounced off after touching a weekly low of $6, and the price rallied to $17, showing some great strength.

The price of ATOM on the weekly chart showed great strength rallying to $17 with strong volume, but the price was faced with major resistance at $17 on the weekly chart. ATOM failed to flip this weekly resistance into support as the price has maintained a decline but above its bullish trendline support.

For the price of ATOM to trend higher price needs to flip the weekly resistance into support and close above $17; if the price of ATOM fails to rally back to this region, we could see the price of ATOM retesting its support of $12.

The price of ATOM could retest its weekly support of $12, which is a healthy retracement. So far, the support of that region holds the price of ATOM from sell-off, and this would be a good zone for more buy orders, and a possible bounce as the price aims to maintain its bullish sentiment. If the price of ATOM fails to hold $12 support, we could see the price going to a low of $8.

Weekly resistance for the price of ATOM – $17.

Weekly support for the price of ATOM – $12.

Price Analysis Of ATOM On The Daily (1D) Chart
Daily ATOM Price Chart | Source: ATOMUSDT On Tradingview.com

The daily timeframe for ATOM prices continues to main the bullish structure it has formed as the price respects the trendline support holding up nicely despite seeing more sell volume. 

ATOM’s price needs to hold above this trendline support for the price to bounce and trend higher, but if the price of ATOM fails to hold, we could see the price of ATOM going to a daily low of $12.5.

On the daily timeframe, the price of ATOM is currently trading at $13.56, holding above the 50 Exponential Moving Average (EMA), acting as support for ATOM price. The price of $12.5 corresponds to the support at 50 EMA, acting as a good area for more demand for the price of ATOM; if the support at 50 EMA fails, we could see the price going to $9. 

The Relative Strength Index (RSI) for ATOM is above 50 on the daily chart, indicating low buy order volume. 

Daily resistance for the ATOM price – $15.

Daily support for the ATOM price – $12.5-$9.

Featured Image From zipmex, Charts From Tradingview 

TA- Cosmos Could Be Set For A Wild Rally Ahead Of Crucial Breakout

The price of Cosmos (ATOM) could be set for a wild rally with a potential breakout against Tether (USDT) ahead of summer relief for altcoins. 

Ethereum price saw a relief bounce from $1,600 to $1,800 ahead of merge sentiments leading to other altcoins like Cosmos breaking out in price. (Data feeds from Binance)

Price Analysis Of ATOM On The Weekly Chart
Weekly Price Chart Analysis For ATOM | Source: ATOMUSDT On Tradingview.com

From the chart, the price of ATOM saw a weekly low of around $6.5, which bounced from that range and rallied to $11.3.

The price has built more momentum as it faces resistance at $17.

If the price of ATOM on the weekly chart continues with this bullish structure, it could quickly hit the $17 mark.

The volume shows decent buy bids, pushing the price of ATOM higher.

Weekly resistance for the price of ATOM – $17.

Weekly support for the price of ATOM – $6.5.

Price Analysis Of ATOM On The Daily (1D) Chart
Daily Price Chart Analysis For ATOM | Source: ATOMUSDT On Tradingview.com

The price of ATOM found strong support at around $6.2, with what seems to be an area of interest on the daily chart.

ATOM bounced from its support, forming a bullish trendline that acts as a support and has continued to maintain this structure. 

At the point of writing, the price of ATOM is at $12, trading above the 50 exponential moving averages (EMA), which corresponds to the support at $10. 

If the 50 EMA region fails to hold the price, $9 would be a good support to hold sell-offs and for a possible price bounce.

With more buy bids, we could see the price of ATOM retesting at $16 -$17, which has been resistance on the daily chart.

The RSI for ATOM price on the daily chart is 65, indicating healthy buy bids for ATOM.

The volume for ATOM looks good, indicating positive signs for ATOM prices to trend higher.


Daily (1D) resistance for ATOM price – $17.

Daily (1D) support for ATOM price – $10, $9.

Price Analysis Of ATOM On The Four-Hourly (4H) Chart
Four-Hourly Chart Analysis For ATOM | Source: ATOMUSDT On Tradingview.com

The price of ATOM has shown a bullish breakout from a symmetric triangle on the 4H chart, with the price closing above it.

ATOM has struggled in this region, forming a range in a triangle with price rejecting from $11.5.

ATOM price is $12, trading above the 50 & 200 EMA with prices of $10.7 and $10 on the 4H chart. These prices would act as support areas for ATOM on the 4H chart.


Four Hourly (4H) resistance for ATOM price – $16.

Four hourly (4h) support for ATOM price – $10.7, $10.


A break below these support zones could send the price of ATOM to a region of $9, acting as a good support area.

Featured image from NewsBTC, Charts from TradingView.com 

Top Analyst Predicts 60x Profits For Polygon, Cosmos, And Avalanche

The crypto market is trending to the upside and recovering some of its last week’s gains with Polygon (MATIC), and other altcoins following the general trend. Digital assets seem to be positively reacting to the earnings reports from legacy companies.

Related Reading | Why The IMF Thinks The Crypto Market Could See “Further Selloffs”

At the time of writing, Amazon (AMZN) beat earnings expectations generating over $130 billion in net sales. Apple (AAPL) also beat expectations with $83 billion reported in earnings.

Amazon +10% pic.twitter.com/T4twX73AKG

— TradingView (@tradingview) July 28, 2022

 As a result, the S&P 500 recorded a 1.23% increase at the U.S. close with the Nasdaq and the Dow Jones trading in the green. The crypto market benefited from these reports, as it continues to move in tandem with legacy financial markets.

Top crypto analyst Michaël van de Poppe celebrated AMZN and AAPL’s positive price moves. The analyst believes the price action in equities will continue to spill into the crypto market. Via Twitter, van de Poppe said:

we’re definitely ready for fireworks (…). The entire market looks ready to continue moving heavily.  Many altcoins & Bitcoin breaking above 50-Day Moving Average. Bitcoin breaking above 200-Week Moving Average. Looks to me to see a continuation on those altcoins for 100-200%.

The analyst singled out Solana (SOL), Polygon (MATIC), Cosmos (ATOM), Avalanche (AVAX), and others with the best potential to benefit from a long-term bullish trend. These cryptocurrencies have the potential to record 60x returns “in the next bull cycle”, van de Poppe said.

In the short term, as mentioned above, these altcoins could register as much as 100% to 200% gains if the bullish momentum extends. The analyst claims most of these altcoins have broken above key moving averages and might find little resistance as they reclaim previously lost territory.

According to this analyst, Avalanche (AVAX) alone could hit a target of $37 to $41. Solana on the other hand might hit $62 to $84 and Polygon beyond the $1 mark.

MATIC’s price records important gains on the 4-hour chart. Source: MATICUSDT Tradingview
Can Polygon (MATIC) Benefit From A Crypto Summer Rally?

The analyst claims the crypto market stands to benefit from a relief rally on the back of a dovish U.S. Federal Reserve (Fed). The financial institution has been trying to mitigate inflation by hiking interest rates, and according to market expectations, this metric should trend lower in its July print.

In addition, the Ethereum “Merge” was set for September 2022. This event is considered highly bullish for the cryptocurrency which has provided ETH bulls with enough strength to push the market to the upside.

Related Reading | Bitcoin Makes Surprise Climb As Fed Discloses 0.75 Point Rate Bump

Polygon (MATIC), Avalanche (AVAX), Solana (SOL), and Cosmos (ATOM) might prove good bets in the long run due to the upcoming products, their partnerships with major players in and outside the crypto industry, and their development teams.

Ideal ingredients for a Summer Relief Rally are there:

Powell becoming dovish on policy and more data-dependent.
$ETH merge coming up in September.
Heavy impact on 3AC, Celsius, and more already priced in.

I’m seeing $ETH to $2,400 and $BTC to $28,000-30,000.

— Michaël van de Poppe (@CryptoMichNL) July 27, 2022 

Cosmos Records 20% Gain, What’s Behind The Boom In Its Ecosystem

The Cosmos ecosystem has seen an explosion of interest in the past year. Projects like Terra (LUNA) have increased its numbers of users and will continue to boost its position in the crypto space as its ecosystem keeps expanding.

Related Reading | Cosmos (ATOM) Jumps 36% WTD: What’s Driving Its Price Rally?

As of press time, Cosmos (ATOM) trades at $32,57 with a 7% profit in the past 24 hours. The cryptocurrency follows the general sentiment in the market, as Bitcoin (BTC), Ethereum (ETH), and other large cryptocurrencies trend to the upside in lower timeframes.

ATOM with bullish momentum on the daily chart. Source: ATOMUSDT Tradingview

In an official blog post, the team behind Cosmos recently announced the new project to be release as testnets in 2022. The team celebrated Terra, Secret Network, Osmosis, and other projects in the ecosystem and announced others that will be introduce this year. The team said:

Many up-and-coming projects are running testnets and incentivized testnets that will precede their debuts to mainnet this year.

A testnet, as explained by the post, are a widely use tool for internet development. They let developers test upgrades, products, and more before deploying on a mainnet. A test network or testnet simulate that original environment to carry out such test under similar conditions as if they were already deployed.

Developers and users benefit from testnets because it allows the former to discover and fix bugs and issues, improve user experience, and the latter to leverage a clean and battle tested software. The Cosmos ecosystem holds over $100 billion in terms of total value locked, testnets provide an additional layer of development to guarantee its safety and optimal stability. The team said:

Over the years, Cosmos testnets have proven to be extensively successful in many areas, such as uncovering issues with the consensus engine, state machine, and even the operational setup of validators.

Top Projects To Watch On Cosmos For 2022

Amongst the projects cited by the Cosmos team, there is Archway. This incentivized smart contract platform will provide the ecosystem with CosmWasm integration and enable direct developer reward into the protocol. In that way, developers, users, and early investors will receive a share of the rewards from launching a product.

Archway will launch “Augusta”, its first incentivized testnet in March 2022. Users will have a chance at earning rewards during this tesnet’s different stages.

In addition, Archway will be accompanied by Celestia, Cosmos’ first “modular blockchain network”. This platform will allow developers to deploy their own virtual machines without, according to the post, having to “bootstrapt their own consensus network”. Thus, bringing new dApp possibilities into the ecosystem.

The project is currently on its devnet phase, but once deployed it’ll let applications to maintain a high level of sovereignty and security with a high degree of scalability. Celestia’s public testnet is set to be rollout at some point in Q2, 2022.

Moreover, the Cosmos will see the launch of Tgrade, the “first regulated DeFi platform”, the protocol will operate with a mix between Proof-of-Stake (PoS) and Proof-of-Engagement (PoE). Unlike regular PoS project, Tgrade will reward all of its community via its PoE mechanism.

Related Reading | Terra (LUNA) Holders Approve New Sports Sponsorship Deal

Finally, this ecosystem will see the rollout of Umee with an incentivized testnet for its lending and borrowing platform. However, many more projects will be introduced via tesnets and on the mainnet making this network one to continue to watch on 2022 and beyond.