Get Ready For A Bitcoin Cash Revolution: Analyst Forecasts Historic Breakout

Bitcoin Cash (BCH) is stirring excitement in the cryptocurrency community after respected analyst Rekt Capital posted a potentially game-changing analysis. The analysis suggests BCH might be on the cusp of overcoming a long-standing downtrend and achieving a “monumental milestone.”

For BCH enthusiasts, this potential breakout represents more than just a technical victory. It could be a turning point that ushers in a new era for the cryptocurrency. Historically, BCH has flirted with overcoming the downtrend, only to fall back within its boundaries. However, Rekt Capital believes this time might be different.

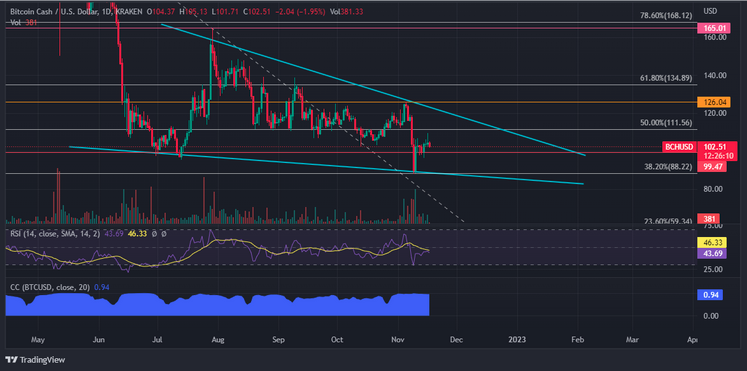
The key takeaway from my analysis is the possibility of Bitcoin Cash finally closing a monthly candle above the macro downtrend line, Rekt Capital stated in the analysis.
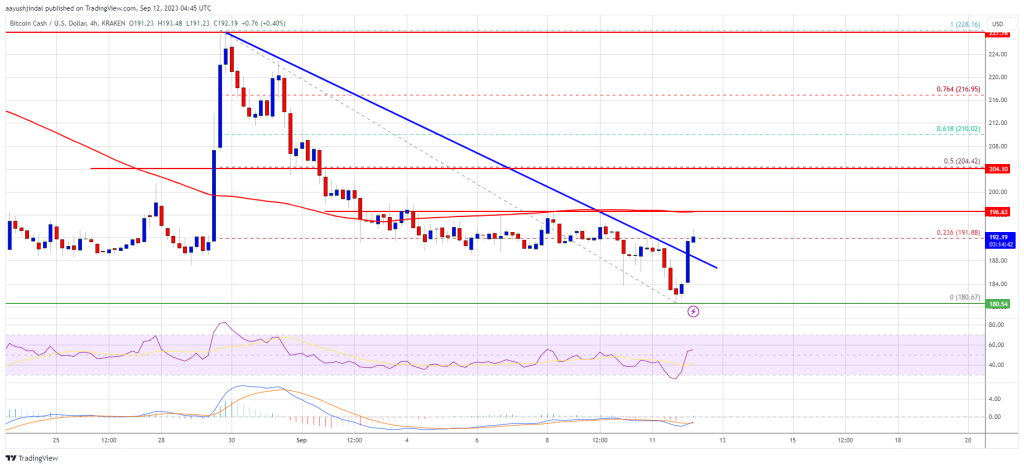
The significance of such a move lies in its potential to attract new investment. A confirmed breakout would be a strong bullish signal, potentially swaying investors who have been hesitant about BCH’s future. This, in turn, could lead to a rise in BCH’s valuation and solidify its position in the ever-evolving cryptocurrency landscape.

Industry leaders point to a successful breakout as a major vote of confidence for Bitcoin Cash. It would demonstrate BCH’s underlying strength and resilience in a notoriously volatile market.

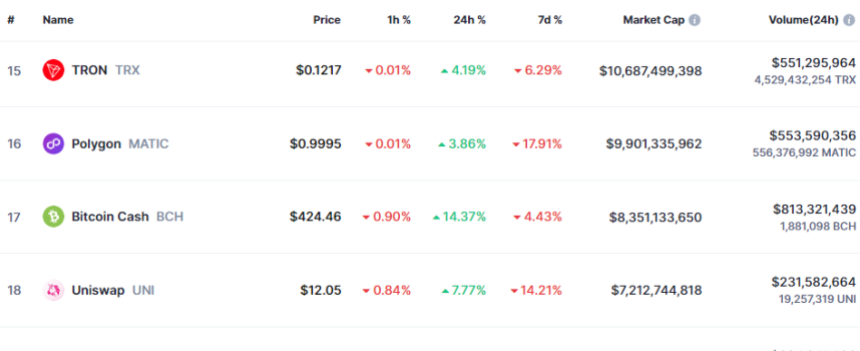
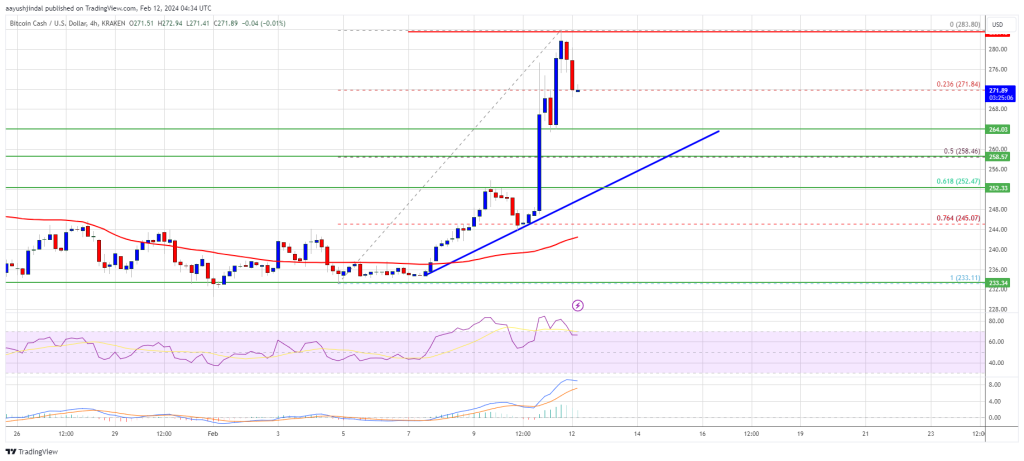
While the anticipation surrounding BCH is palpable, some caution remains. The cryptocurrency market is known for its unpredictable nature, and BCH is currently experiencing a short-term price dip of 1.6% and is currently trading at $645. However, this needs to be viewed in context of a recent 30% weekly surge, highlighting the market’s inherent volatility.

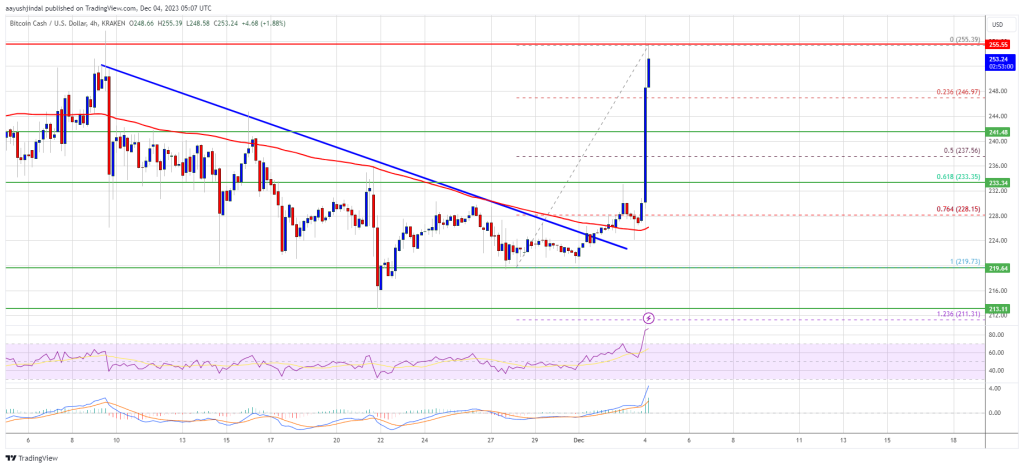
The next few weeks will be crucial for BCH. If the monthly candle closes above the downtrend line, it would be a significant confirmation of bullish sentiment. However, failure to do so could lead to a pullback and dampen the current optimism.

The potential breakout for BCH underscores the dynamic nature of the cryptocurrency space. Trends can shift rapidly, and what appears certain one day can quickly change course. This is precisely what makes the industry so captivating, with innovation and progress constantly pushing boundaries.

The story of Bitcoin Cash is a testament to the relentless pursuit of progress in the crypto sphere. Whether BCH breaks out or not, its trajectory serves as a reminder of the ever-evolving nature of this exciting and unpredictable market.

With all eyes on the upcoming monthly candle close, the cryptocurrency community waits to see if Bitcoin Cash can finally turn the corner and etch its name in the crypto history books.

Featured image from Pixabay, chart from TradingView

Bitcoin Cash (BCH) Surges 15% As Coinbase Plans Futures Listing

Bitcoin Cash (BCH) has registered a sharp 15% rally in the past 24 hours after plans of a futures listing on Coinbase have surfaced for the asset.

Coinbase Plans To Launch Bitcoin Cash Futures Product On 1 April

As an X user has pointed out, the cryptocurrency exchange Coinbase appears to have filed certifications with the Commodity Futures Trading Commission (CFTC) to list futures products for three coins on its platform: Bitcoin Cash (BCH), Dogecoin (DOGE), and Litecoin (LTC).

As per the CFTC filing, all of these products were certified on March 7, and they are set to go live on trading on the first of the month.

Bitcoin Cash Futures

Interestingly, all three of these digital assets happen to be based on the original cryptocurrency: Bitcoin. Bloomberg analyst James Seyffart has hinted that this may be why Coinbase has chosen them.

Unlike LTC and DOGE, which are based initially on BTC’s code, BCH is a direct fork of the cryptocurrency made to fulfill BTC’s original purpose as a fast and cheap form of currency that may be used for regular purposes (hence the name).

The filling made by Coinbase on Bitcoin Cash reads:

The market position of Bitcoin Cash reflects its role as an alternative to Bitcoin that prioritizes transaction efficiency. While it has not matched Bitcoin in terms of market capitalization or price, Bitcoin Cash has established itself as a significant player in the cryptocurrency space, with a dedicated user base and ecosystem.

BCH Has Enjoyed A 14% Surge During The Last 24 Hours

The cryptocurrency sector has been up in the past day, but two coins in particular have stood out among the top 20 assets by market cap: Bitcoin Cash and Dogecoin.

Both of these have managed more than 14% returns in this period, notably outperforming their peers. Bitcoin itself has only been able to put together a rally of about 6%.

Given that the Coinbase filling has been making the rounds in this window, it would appear likely that it was at least partially responsible for the extraordinary surges of these coins.

Even though Litecoin is also planned to see its futures contract launch on the same day as the other two, its price performance has been more or less in line with the rest of the market with its profits sitting at just 4%.

Following the sharp rally, Bitcoin Cash has now arrived at the $424 level. The chart below shows how the cryptocurrency’s trajectory has looked in the last few days.

Bitcoin Cash Price Chart

Regarding the market cap, Bitcoin Cash is currently the 17th largest asset. While there is some distance to Polygon (MATIC) in 16th place, LTC may be able to catch it if it can keep up this rally.

Bitcoin Cash Market Cap

Bitcoin Cash Price Solid 15% Gain: Signs Point to Fresh BCH Rally Ahead

Bitcoin Cash price rallied over 15% and broke the $275 resistance. BCH is now facing strong resistance near the $282 zone.

  • Bitcoin cash price started a fresh surge above the $250 resistance.
  • The price is trading above $265 and the 100 simple moving average (4 hours).
  • There is a key bullish trend line forming with support at $258 on the 4-hour chart of the BCH/USD pair (data feed from Kraken).
  • The pair could continue to move up if it clears the $282 resistance zone.

Bitcoin Cash Price Rallies Above $270

After forming a base above the $232 level, Bitcoin Cash price started a steady increase. It broke the $245 resistance to enter a positive zone, like Bitcoin and Ethereum.

There was a strong increase above the $250 and $265 resistance levels. The price gained over 15% and tested the $282 resistance. A high was formed near $283 and the price is now correcting gains. There was a move below the $275 level.

The price tested the 23.6% Fib retracement level of the upward move from the $233 swing low to the $283 high. BCH is now showing positive signs above $260 and the 100 simple moving average (4 hours).

Bitcoin Cash Price

Source: BCH/USD on TradingView.com

There is also a key bullish trend line forming with support at $258 on the 4-hour chart of the BCH/USD pair. If there is another increase, the price might face resistance near $275. To continue higher, the price must settle above $282. The next major resistance is near $292, above which the price might accelerate higher toward the $300 level. Any further gains could lead the price toward the $320 resistance zone.

Fresh Drop in BCH?

If Bitcoin Cash price fails to clear the $275 resistance, it could start a fresh decline. Initial support on the downside is near the $265 level.

The next major support is near the $258 level or the trend line. It is close to the 50% Fib retracement level of the upward move from the $233 swing low to the $283 high, where the bulls are likely to appear. If the price fails to stay above the $258 support, the price could test the $245 support. Any further losses could lead the price toward the $232 zone in the near term.

Technical indicators

4-hour MACD – The MACD for BCH/USD is losing pace in the bullish zone.

4-hour RSI (Relative Strength Index) – The RSI is currently in the overbought zone.

Key Support Levels – $265 and $258.

Key Resistance Levels – $275 and $282.

Bitcoin Cash Price Pumps Over 10% But $255 Is The Key To More Gains

Bitcoin Cash price rallied over 10% and broke the $245 resistance. BCH is now facing strong resistance near the $255 zone.

  • Bitcoin cash price started a fresh surge above the $232 resistance.
  • The price is trading above $245 and the 100 simple moving average (4 hours).
  • There was a break above a key bearish trend line with resistance near $225 on the 4-hour chart of the BCH/USD pair (data feed from Kraken).
  • The pair could continue to move up if it clears the $255 resistance zone.

Bitcoin Cash Price Rallies Above $250

After forming a base above the $220 level, Bitcoin Cash price started a steady increase. It broke the $225 resistance to enter a positive zone, like Bitcoin and Ethereum.

There was a break above a key bearish trend line with resistance near $225 on the 4-hour chart of the BCH/USD pair. There was a strong increase above the $232 and $245 resistance levels. The price is up over 10% and it is now testing the $255 resistance.

BCH is now showing positive signs above $245 and the 100 simple moving average (4 hours). It is also above the 23.6% Fib retracement level of the upward move from the $219 swing low to the $255 high.

Bitcoin Cash Price

Source: BCH/USD on TradingView.com

The price is now struggling to clear the $255 resistance. To continue higher, the price must settle above $255. The next major resistance is near $265, above which the price might accelerate higher toward the $280 level. Any further gains could lead the price toward the $300 resistance zone.

Fresh Drop in BCH?

If Bitcoin Cash price fails to clear the $255 resistance, it could start a fresh decline. Initial support on the downside is near the $245 level.

The next major support is near the $232 level or the 61.8% Fib retracement level of the upward move from the $219 swing low to the $255 high, where the bulls are likely to appear. If the price fails to stay above the $232 support, the price could test the $225 support. Any further losses could lead the price toward the $220 zone in the near term.

Technical indicators

4-hour MACD – The MACD for BCH/USD is gaining pace in the bullish zone.

4-hour RSI (Relative Strength Index) – The RSI is currently in the overbought zone.

Key Support Levels – $245 and $232.

Key Resistance Levels – $255 and $265.

Bitcoin Cash Rally Threatened As Exchange Drops BCH Following XRP Listing Rumors

Bitcoin Cash has followed the general growth trend of Bitcoin with the price almost clearing the $250 resistance before being rejected. Even though BCH maintains this bullish momentum, it is not completely in the clear following its delisting from one crypto exchange.

EDX Markets Delists Bitcoin Cash

In another unexpected blow, Bitcoin Cash (BCH) has been delisted from the EDX Markets crypto exchange. Users had first suspected that the exchange was ending support for BCH and rumors spread like wildfire through social media. Eventually, the crypto exchange will confirm these rumors, with a spokesperson revealing that EDX Markets was indeed no longer offering support for BCH.

Contrary to the norm, EDX Markets did not give any indication of why the cryptocurrency was delisted from the exchange. Rather, users were directed to sign up for the newsletter to get updates about listings, as well as check out the website for supported coins.

Interestingly, this is happening at a time when rumors have been circulating that EDX Markets might be planning to list XRP. This would make sense given that many exchanges have resisted the cryptocurrency after Ripple’s victory over the SEC. Since then, XRP’s volume has been on the high side and crypto exchanges have clamored for a chance to get a piece of the pie.

BCH Price Struggles To HoldOn

Following the rejection from the $250 level, the Bitcoin Cash (BCH) price has been hard-pressed to continue on its previous trajectory. The fall toward the $240 level shook out a good portion of longs before the bulls were able to take over once more.

However, the BCH daily trading volume is still seeing good momentum after rising 36% in one day. If anything, this shows there is still a fair amount of interest in the altcoin with trading garnering a lot of attention from market participants.

The major resistance to a BCH breakout currently lies at the $250 level. If the price is able to clear this resistance, then the rally is expected to continue and could touch $270 before losing steam. But it is still a long way from its yearly high of $300.

At the time of writing, BCH is trading at $243 with 3.75% losses on the weekly chart. However, it is performing much better in the last day after rising 2.23%.

Bitcoin Cash BCH price chart from Tradingview.com

Bitcoin Cash Price Prediction: This Support Could Trigger Fresh BCH Rally

Bitcoin Cash price is holding the key $205 support against the US Dollar. BCH could start a fresh increase if it stays above the $205 and $200 support levels.

  • Bitcoin cash price started a fresh decline below the $230 level against the US Dollar.
  • The price is trading below $220 and the 100 simple moving average (4 hours).
  • There is a key bearish trend line forming with resistance near $217 on the 4-hour chart of the BCH/USD pair (data feed from Kraken).
  • The pair could start a fresh increase unless there is a move below $200.

Bitcoin Cash Price Holds Support

In the past few days, Bitcoin Cash price saw a steady decline from the $255 resistance zone. BCH declined below the $232 support to enter a short-term bearish zone, like Bitcoin and Ethereum.

The bears were able to push the price below the $220 support. Finally, the price found support near the $205 zone (a multi-touch zone). A low has formed near $206.59 and the price is now consolidating losses. It seems like there is a key bearish trend line forming with resistance near $217 on the 4-hour chart of the BCH/USD pair.

Bitcoin Cash is now trading below $220 and the 100 simple moving average (4 hours). Immediate resistance is near the $217 level and the trend line. It is close to the 23.6% Fib retracement level of the downward move from the $255 swing high to the $206 low.

Bitcoin Cash Price Prediction

Source: BCH/USD on TradingView.com

The next major resistance is near $228 or the 100 simple moving average (4 hours). The next major resistance is near the $232 level. It is close to the 50% Fib retracement level of the downward move from the $255 swing high to the $206 low. Any further gains could lead the price toward the $250 resistance zone.

Downside Break in BCH?

If Bitcoin Cash price fails to clear the $217 resistance, it could continue to move down. Initial support on the downside is near the $205 level.

The next major support is near the $200 level, where the bulls are likely to appear. If the price fails to stay above the $200 support, the price could test the $184 support. Any further losses could lead the price toward the $162 zone in the near term.

Technical indicators

4-hour MACD – The MACD for BCH/USD is losing pace in the bearish zone.

4-hour RSI (Relative Strength Index) – The RSI is currently below the 50 level.

Key Support Levels – $205 and $200.

Key Resistance Levels – $217 and $232.

Bitcoin Cash Price Won’t Go Down Quietly – Risk of Bounce Grows

Bitcoin Cash price is holding the key $220 support against the US Dollar. BCH seems to be aiming for a fresh increase unless there is a move below $220.

  • Bitcoin cash price is showing positive signs above the $220 level against the US Dollar.
  • The price is trading above $220 and the 100 simple moving average (4 hours).
  • There was a break below a key bullish trend line with support near $238 on the 4-hour chart of the BCH/USD pair (data feed from Kraken).
  • The pair could start a fresh increase unless there is a move below $220.

Bitcoin Cash Price Holds Support

In the past few days, Bitcoin Cash price saw a steady decline from the $255 resistance zone. BCH declined below the $240 support to enter a short-term bearish zone, like Bitcoin and Ethereum.

The price declined below the 50% Fib retracement level of the upward move from the $203 swing low to the $255 high. Besides, there was a break below a key bullish trend line with support near $238 on the 4-hour chart of the BCH/USD pair.

However, the bulls were active above the $220 support. The price found support near the 61.8% Fib retracement level of the upward move from the $203 swing low to the $255 high.

Bitcoin Cash is now trading above $220 and the 100 simple moving average (4 hours). Immediate resistance is near the $236 level. The next major resistance is near $244. Any further gains could lead the price toward the $250 resistance zone.

Bitcoin Cash Price

Source: BCH/USD on TradingView.com

The next major hurdle is near the $262 level, above which BCH might start a decent increase toward the $280 level or $288 in the coming days.

Downside Break in BCH?

If Bitcoin Cash price fails to clear the $244 resistance, it could start a fresh decline. Initial support on the downside is near the $225 level.

The next major support is near the $220 level, where the bulls are likely to appear. If the price fails to stay above the $220 support, the price could test the $212 support. Any further losses could lead the price toward the $200 zone in the near term.

Technical indicators

4-hour MACD – The MACD for BCH/USD is losing pace in the bullish zone.

4-hour RSI (Relative Strength Index) – The RSI is currently below the 50 level.

Key Support Levels – $225 and $220.

Key Resistance Levels – $236 and $244.

These Are The Altcoins To Keep An Eye On: Santiment

Data from Santiment shows that several altcoins have registered an increase in address activity, which may make them worth keeping an eye on.

Bitcoin Cash & Other Altcoins Have Observed A Rise In Active Addresses

As explained by the on-chain analytics firm Santiment in a new post on X, some alts are seeing rising activity despite the cooldown that the overall cryptocurrency sector has observed in the past couple of days.

The indicator of interest here is the “daily active addresses,” which keeps track of the total number of unique addresses of any given coin that are interacting on the blockchain in some way every day. The metric accounts for both senders and receivers.

By “unique,” what’s meant here is that any address participating in transaction activity on the blockchain is only counted once, regardless of how many transfers it may be involved in.

This restriction helps provide a more accurate representation of the actual activity on the network, as just a few addresses making hundreds of transactions can’t skew the metric by themselves.

When the value of the indicator is high, it means that there are a large number of unique addresses taking part in transaction activity right now. Such a trend implies the blockchain is receiving a high amount of traffic currently.

On the other hand, low values imply not many users are interacting with the network, a possible sign that interest in trading the cryptocurrency is low at the moment.

Now, here is a chart that shows the trend in the daily active addresses for several different altcoins over the past month:

Altcoin Active Addresses

As displayed in the above graph, the daily active addresses indicator has observed a sharp surge in the past couple of days for the altcoins listed here: Bitcoin Cash (BCH), Small Love Potion (SLP), Mask (MASK), LeverFi (LEVER), and Civic (CVC).

According to Santiment, these latest highs in the metric correspond to the highest levels that these cryptocurrencies have witnessed in around three months. Such high activity naturally suggests that there is a lot of interest in these coins among investors right now.

Most of these are small-cap coins, though, but there is one among them that has a very notable standing in the rest of the market: BCH. The 16th-ranked asset in the sector has registered a decline in the last two days, much like the wider sector, but the asset’s active addresses have remained high in number.

Usually, high address activity is a good sign for rallies, as a large amount of active trader pool means that the move has a higher probability of finding the fuel it needs to keep itself going.

Interestingly, besides these altcoins, the largest stablecoin in the sector, Tether (USDT), has also seen the indicator shoot up during this period. Investors use stablecoins for storing their value in a more secure form and for buying into other assets, so the high address activity can potentially be a sign that some moves are taking place in the background.

BCH Price

Bitcoin Cash had earlier surged past the $250 mark, but with the latest drawdown, the altcoin has plunged to $230.

Bitcoin Cash Altcoin Price Chart

Bitcoin Cash Bulls Charge: 13% Price Rally Driven By Fresh Demand

The price of Bitcoin Cash has experienced significant rise over the course of the last 30 days, resulting in favorable returns for investors. Since July, BCH holders have continuously maintained a positive perspective, which has reduced the frequency of selling activity. This collective sentiment has played a significant role in the upward trajectory of BCH, consequently yielding favorable outcomes for these holders.

The price of BCH has increased by about 13% over the previous week, giving it some of the biggest gains in the last seven days for cryptocurrency assets. According to CoinMarketCap data, the altcoin was trading at $234.78 at the time of publication.

The value of the world’s cryptocurrency market dropped to $1.06 trillion at the time of writing, a 0.1% decrease in a day. On Thursday, ETH increased by about 0.8% to $1,629, while Bitcoin (BTC) rose slightly above the $27K level.

Can Bitcoin Cash Reach New ATH This Year?

BCH is anticipated to undergo a trial of the support line at a value of $229, after which a subsequent rebound is projected. The breach of the current barrier at $253 is crucial for the potential rise of the altcoin. If this level is surpassed, it might pave the way for the altcoin to achieve new 2023 highs, beyond the $300 mark.

Bitcoin Cash has increased by a remarkable 90% in the last six months, demonstrating strong performance. Furthermore, the price of BCH has been up significantly by 136% so far this year, maintaining a favorable return.

Santiment research indicates that whales in the cryptocurrency space have increased their holdings in Bitcoin Cash significantly. Collectively, bitcoin whales with holdings ranging from 100,000 to 10 million BCH held 3.74 million BCH as of September 18, 2023.

Long-Term Holder Addresses Up

But on September 26, their holdings had increased to 3.86 million BCH, showing a noteworthy acquisition of 120,000 BCH in just one week. Their balances are now comparable to what they were in July 2023 thanks to this accumulation, and the 120,000 BCH that the Bitcoin Cash whales purchased are worth about $25.6 million at the current market price of $213 per BCH.

Meanwhile, the increase in long-term holders of Bitcoin Cash indicates a positive outlook for the cryptocurrency’s sustainability. These committed investors, who believe in BCH’s long-term potential, contribute to a stable user base and network demand. This support from long-term holders, combined with whale accumulation, could help BCH reach or exceed $300 in the future

(This site’s content should not be construed as investment advice. Investing involves risk. When you invest, your capital is subject to risk).

Featured image from iStock

Bitcoin Cash Price Signals Fresh Increase Despite Weakness in BTC and ETH

Bitcoin Cash price is holding the key $180 support against the US Dollar. BCH seems to be aiming for a fresh increase toward the $205 and $220 levels.

  • Bitcoin cash price is showing positive signs above the $180 level against the US Dollar.
  • The price is trading below $200 and the 100 simple moving average (4 hours).
  • There was a break above a major bearish trend line with resistance near $189 on the 4-hour chart of the BCH/USD pair (data feed from Kraken).
  • The pair is likely to accelerate higher if it clears $197 and $200.

Bitcoin Cash Price Aims Higher

In the past few days, Bitcoin Cash price saw a steady decline below $205. BCH even traded below the $195 level, but the downsides were limited compared to Bitcoin and Ethereum.

The price remained well-bid near the key $180 support. A low has formed near $180 and the price is now attempting a fresh increase. It broke the $185 level. There was a break above a major bearish trend line with resistance near $189 on the 4-hour chart of the BCH/USD pair.

The price is now testing the 23.6% Fib retracement level of the downward move from the $238 swing high to the $180 low. However, Bitcoin Cash is now trading below $200 and the 100 simple moving average (4 hours).

Immediate resistance is near the $197 level and the 100 simple moving average (4 hours). The next major resistance is near $205 or the 50% Fib retracement level of the downward move from the $238 swing high to the $180 low.

Bitcoin Cash Price

Source: BCH/USD on TradingView.com

Any further gains could lead the price toward the $220 and $225 resistance levels in the near term. The next major hurdle is near the $240 level.

Dips Supported in BCH?

If Bitcoin Cash price fails to clear the $205 resistance, it could start a fresh decline. Initial support on the downside is near the $185 level.

The next major support is near the $180 level, where the bulls are likely to appear. If the price fails to stay above the $180 support, the price could test the $168 support. Any further losses could lead the price toward the $150 zone in the near term.

Technical indicators

4-hour MACD – The MACD for BCH/USD is gaining pace in the bullish zone.

4-hour RSI (Relative Strength Index) – The RSI is currently above the 50 level.

Key Support Levels – $185 and $180.

Key Resistance Levels – $197 and $205.

Bitcoin Cash Traders Move Into Profit, But Can The Rally Continue?

As the price of Bitcoin and the general crypto market has rallied, leading to a much-needed increase in price, Bitcoin Cash (BCH) investors are once again on a profitable path. The majority of investors are now in the green following its double-digit surge in the last week. But now the question posed is, will the price of BCH continue to maintain this surge?

Bitcoin Cash Short And Long-Term Holders Enjoy Profits

In a Thursday post, on-chain data tracking platform Santiment revealed that both short and long-term holders of Bitcoin Cash are doing quite well right now. The chart shared by the tracker showed that the average returns for 30-day and 365-day holders have risen above their average cost price.

This means that investors who got into the digital asset in the last month, as well as those who have been holding for a year, are the ones doing well right now. It is also the first time in 10 weeks that this cohort of BCH investors is seeing profit.

Santiment BCH

The data from Santiment is also backed up by that from another on-chain tracker IntoTheBlock. According to the latter’s data on its website, 59% of all BCH investors are seeing green compared to 38% sitting in the red and 3% in neutral territory. Furthermore, IntoTheBlock shows that 96% of holders have held for more than one year, with 3% holding between 1-12 months, and 1% holding for less than one month.

Combining the data from both trackers tells us that there are more long-term investors in profit compared to short-term investors. This fact reinforces the long-standing belief that buying and holding is usually the best way to invest in cryptocurrencies.

But Can BCH Hold Its Gains?

The fact that so many short and long-term holders are currently in profit can be attributed to the digital asset’s spike in the last week. Following the Grayscale ruling that saw the market surge, BCH’s price rose over 14%, bringing its value to the $220 level before the retracement. Most of these gains have been sustained so far, as evidenced by the high percentage of holders in profit.

However, Santiment points out in its report that for Bitcoin Cash to continue to rise, it would be up to the whales. This is because, during the price spike, there was an increase in whale activity in relation to the BCH token. So they likely played a part in the asset’s rise.

If the whales continue to be active and put buying pressure on the coin, then the price of BCH could continue to appreciate. However, a turn from buy to sell among these large holders would quickly crash the price, especially since the market is already feeling the euphoria felt earlier this week start to recede.

Presently, data from Coinmarketcap shows that Bitcoin Cash is trading at $219, a 14.57% increase in the last week.

Bitcoin Cash price chart from Tradingview.com

Bitcoin Cash Price Could Restart Increase To $250 If It Breaks This Resistance

Bitcoin Cash price recovered from the $160 zone against the US Dollar. BCH might aim a fresh rally toward the $240 and $250 levels.

  • Bitcoin cash price is consolidating above the $180 level against the US Dollar.
  • The price is trading below $200 and the 100 simple moving average (4 hours).
  • There is a key rising channel forming with resistance near $200 on the 4-hour chart of the BCH/USD pair (data feed from Kraken).
  • The pair is likely to accelerate higher if it clears $195 and $200.

Bitcoin Cash Price Prepares For The Next Move

After a strong decline, Bitcoin Cash price found support near the $160 level. BCH traded as low as $160.90 and recently started a recovery wave, like Bitcoin and Ethereum.

The price climbed above the $175 and $180 resistance levels. There was a break above the 23.6% Fib retracement level of the downward move from the $237 swing high to the $160 low. The price is now trading in a range above the $190 level.

Bitcoin Cash is now trading below $200 and the 100 simple moving average (4 hours). There is also a key rising channel forming with resistance near $200 on the 4-hour chart of the BCH/USD pair.

Immediate resistance is near the $200 level, the channel zone, and the 100 simple moving average (4 hours). The next major resistance is near $220 or the 76.4% Fib retracement level of the downward move from the $237 swing high to the $160 low.

Bitcoin Cash Price

Source: BCH/USD on TradingView.com

Any further gains could lead the price toward the $240 and $250 resistance levels in the near term. The next major hurdle is near the $265 level.

Dips Supported in BCH?

If Bitcoin Cash price fails to clear the $200 resistance, it could start a fresh decline. Initial support on the downside is near the $185 level.

The next major support is near the $180 level, where the bulls are likely to appear. If the price fails to stay above the $180 support, the price could test the $170 support. Any further losses could lead the price toward the $160 zone in the near term.

Technical indicators

4-hour MACD – The MACD for BCH/USD is losing pace in the bullish zone.

4-hour RSI (Relative Strength Index) – The RSI is currently above the 50 level.

Key Support Levels – $185 and $180.

Key Resistance Levels – $200 and $220.

These Altcoins Will Be Hit The Hardest If DCG And Grayscale Fall

The pressure on the Digital Currency Group (DCG) and Grayscale continues to mount. The Winklevoss twins have given DCG an ultimatum of January 8th to return the $900 million Gemini Earn customer funds, while the users themselves have filed a class action lawsuit against both companies.

In addition, in what is believed to be a tactical decision, Valkyrie Investments and Fir Tree recently got involved in the “Shakespearean drama,” as NewsBTC reported yesterday. Thus, the pressure on DCG CEO Barry Silbert is building up day by day, while he is presumably hoping for Feb. 3rd when a three-judge panel will rule on the complaint against the U.S. Securities and Exchange Commission for refusing to convert GBTC into a Bitcoin spot ETF.

These Altcoins Are The Biggest Holdings Of DCG And Grayscale

As many know, Grayscale owns a massive amount of Bitcoin as part of its GBTC, namely more than 630,000 BTC, which is causing great concerns among investors. However, as a Twitter user, Karl shows, not only BTC investors but also altcoin investors should be rooting for Silbert’s companies to survive.

While the more than 630,000 BTC “only” represent 3.28% of all Bitcoins in circulation, there are two altcoins owned by the company that represents an even higher percentage of the total market cap. Within its other trusts, Grayscale holds a staggering 8.53% of all Ethereum Classic (ETC), the equivalent of around $189 million. Second, on the list is Horizen (ZEN). The share of the total market capital is 4.64%, around $5.7 million.

But Grayscale also has an immensely high share of ZCash (ZEC) and Ethereum (ETH) with 2.53% and 2.52%, respectively. They are followed by Litecoin (2.11%), Bitcoin Cash (1.6%), and MANA (1%).

The main concern for the above cryptocurrency investors could be that the company led by Micheal Sonnenshein is liquidating some of its altcoin trusts to save its flagship product the GBTC and possibly Grayscale Ethereum Trust (ETHE) and the entire Digital Currency Group. Silbert could use the funds to serve creditors.

Given the massive stakes in the overall market, it would be almost impossible to rule out the possibility of the already underperforming altcoins suffering even higher, hefty losses due to a Grayscale dump.

The Ethereum Classic price is currently 90.85% below its all-time high of $176.16, while Horizen is trading 94.44% below its all-time high of $168.15. The biggest loss comes from Zcash, which is 99.36% below the all-time high of $5,941.80.

Hurdles For Grayscale For Dissolving Their Trusts

Whether there will be a dissolution of all or only some of the trusts can only be speculated at this time. CEO Michael Sonnenshein had emphasized several times in recent weeks that Grayscale has no intention of dissolving the GBTC fund.

Despite that, he brought into play the option of returning up to 20% of GBTC’s capital to shareholders if he fails to convert the product into an exchange-traded fund two weeks ago.

Still, there are high legal hurdles. It’s important to remember that Grayscale is regulated by the SEC. Dissolving trusts requires an application to the SEC, and the process is very lengthy and difficult, on the other hand not impossible as evidenced by the dissolution of the XRP trust as a result of the SEC lawsuit against Ripple.

Grayscale has a low-risk, high-return project. However, the current developments put massive pressure on DCG and therefore also on Grayscale. Due to the connections through loans between both companies, a downfall of the parent company could also drag the cash cow Grayscale down with it.

However, it is important to emphasize that a downfall does not necessarily mean a dump of all coins at once. If there is a Reg M solution, probably not all Grayscale investors would want to sell. It, therefore, remains important for investors to monitor the development of the DCG/ Grayscale drama.

At press time, the Ethereum price stood at $1,216, still lagging momentum.

ETH price amid Grayscale / DCG drama

Bitcoin Cash On Downward Motion Since Breaching $105 Level – Here’s Why

There has been significant sideways fluctuation in the price of bitcoin recently, and it is currently trading in the $16,541Β area. However, Bitcoin Cash, a spinoff of BTC, has seen its value drop after passing through the $105 threshold.

BCH may need BTC for a rally, as there is a strong market correlation between the two.

At the time of writing, the token was trading at $102.21, which is far lower than the $126 price range that swiftly rejected any potential bull run. The current market environment is further adding to the unfavorable mood towards BCH.

Image: TradingView

What Bitcoin Cash Metrics Show

BCH’s price has been steadily decreasing since it was rejected at $165 earlier this year. However, as was previously mentioned, BCH is highly correlated with BTC, which is experiencing strong sideways motion at the present time.

The BCH price may be affected by factors other than correlation. According to CoinGlass, long traders are still active despite the current bearish market sentiment.

As long as investors continue to cling onto Bitcoin Cash, the currency will continue to go sideways.

In addition, position liquidation is rather minimal, coming in at $242,400. In spite of this, the data shows that the vast majority of liquidations are long positions, suggesting that long traders are selling their BCH at a loss.

However, the presence of long traders indicates that the market sentiment is negative but relatively optimistic in the long run. Nonetheless, if the price falls below $99.47, the number of short traders will surely exceed the number of long traders.

BCH: Bearish Market Prognosis

A negative breach of the $99.47 price range might ignite a BCH market sell-off, pushing the price down $88.22.

However, investors and traders should examine BCH’s association with Bitcoin, as the correlation coefficient sits at 0.94 as of this writing.

Current market dynamics indicate a gloomy future for BCH. The last time the present trading range was observed was in 2018. This revisiting of the aforementioned trading range will surely enhance the market’s existing bearish momentum.

With the cryptospace in risk with the FTX’s demise, a bull run in the coming weeks or months is unlikely. As market sentiment remains adverse, this crypto winter would push investors to keep or sell.

Investors and traders could take advantage of BCH’s link with BTC, but if the market scenario deteriorates, they could anticipate further losses in the days to come.

BCH total market cap at $2.03 billion on the daily chart | Featured image from FXLeaders, Chart: TradingView.com