
Bullish investors profit from rising markets, bearish investors profit from falling markets, while “pigs,” often suffer losses in risky conditions.
Cryptocurrency Financial News
Bullish investors profit from rising markets, bearish investors profit from falling markets, while “pigs,” often suffer losses in risky conditions.
EOS Network, a popular open-source blockchain platform prioritizing high performance and security, has recently witnessed a sharp price decline. The asset exhibits bearish sentiment in the 30-Day timeframe.
The EOS price is down by 14.19% in its one-month data from CoinMarketCap. This suggests that the bears have controlled the market since the last 30 days trading session. This shift in market sentiment raises questions about what lies ahead for EOS.
The bearish sentiment and the loss of control by the bulls have had a noticeable effect on EOS’s price. The cryptocurrency has experienced a downward trend, with declining trading volumes and increased selling pressure.
Notably, the 24-hour trading volume is declining by 13.29% today, May 29, 2023, and its market cap is down by 1.32%. As of the time of writing, the price of EOS is down by 1.28%, at $0.89.

This trend reflects a shift in market dynamics as investors become more cautious and start to sell their EOS holdings.
Despite the prevailing bearish sentiment, potential catalysts could alter the trajectory for EOS. On May 26, the EOS network shared potential bullish news about its partnership with Hypha DAO and an initiative dubbed Beta Program.
EOS network claims that the Beta program will offer a range of pre-configured templates designed to meet different firms’ needs and objectives. Generally, this news may lead to a positive market impact on the EOS price and market sentiment.
EOS’s positive development and partnership can attract new buyers and increase demand, increasing prices. Also, Fear of Missing Out (FOMO), a psychological phenomenon, can create a buying frenzy and drive the price even higher quickly.
In that sense, the EOS/USDT has formed a double-bottom chart pattern, suggesting a potential uptrend movement soon. The double bottom pattern is a bullish reversal pattern that typically forms after a prolonged asset price decline.
Confirming the double bottom pattern occurs when the asset’s price breaks above the resistance level formed by the peak between the two bottoms. This breakout confirms the reversal signal and suggests a higher probability of an upcoming uptrend.
EOS has an important resistance level at $0.931, which represents a significant blockage for possible bullish movement.
Bollinger Bands and MACD Signal Potential Trend Reversal
The asset is currently oscillating between the upper band and middle band of the Bollinger Band indicator. This suggests an increase in the buying pressure and a rising bullish momentum.
In addition, the Moving Average Convergence/Divergence (MACD) is currently above its signal line, suggesting bullish momentum. This indicates that the buyers are gradually taking over the market, and there might be a potential trend reversal soon.

As seen in the chart above, the histogram is above zero and has strong green bars, further confirming the bullish sentiment in the market.
Featured image from Pixabay and chart from TradingView
Toncoin (TON) has experienced a negative price decline, resulting in a bearish sentiment among investors of the altcoin. TON has been exhibiting a bearish strength on a monthly timeframe, based on data from CoinMarketCap.
Within the last 30-Day trading session, the asset is down by 15,67%, indicating a high bearish strength with low buying pressure.
As of the time of writing, the asset is experiencing a decline in value, as it’s down today by 2.76%. This downward trend has resulted in the asset, TON, reaching a low point of $1.91.
The decrease in value reflects a temporary setback in the market, indicating a decrease in investor confidence. It also detects a shift in the supply and demand dynamics surrounding the asset.
Toncoin (TON) witnessed a sharp price decline on May 23, from $2.03 to its present value of $1.89. This price decline represents a loss of 6.89%.
This decline reflects the dominance of bearish sentiment in the market, which shows a lack of investor confidence and a shift in the supply and demand dynamics.
According to the market sentiment indicator, the current market sentiment is bearish, while the Fear & Greed index value is a neutral 49. Notably, a Fear & Greed index value below 50 points to an increase in bearish momentum.

Conversely, an important resistance level is noted at $2.080, representing a significant hurdle for potential upward movement.
Toncoin trades below the 50-day and 200-day Simple Moving Average (SMA). The SMAs formed a Death Cross in the TON market on May 21, 2023.
This confirms the bearish sentiment present in the market, indicating a potential sell signal and further price decline.
The Relative Strength Index (RSI) momentum oscillator value is 40.98 and points downwards. RSI is a popular indicator showing whether a cryptocurrency is oversold or overbought.
If TON RSI drops below 30, it may ignite high selling pressure and further price decline.
TON Demand Index and Bollinger Bands Signals Bearish Activities
The TON/USDT trading pair demand index is at -0.449, suggesting relatively weak demand for the asset in the market.
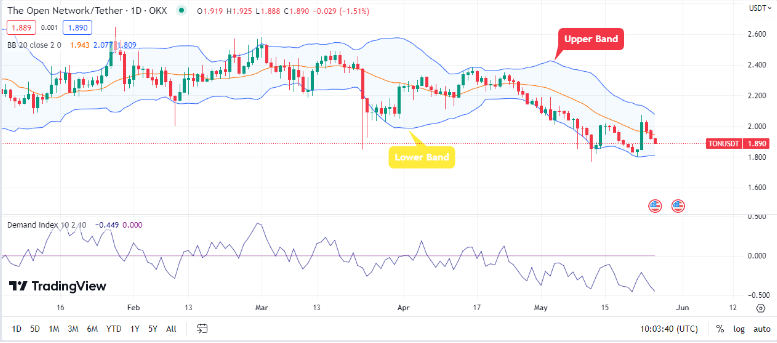
Note that a demand index below zero is generally considered a lack of buying pressure. It also indicates that the selling pressure outweighs the buying interest.
In addition, the asset is heading toward the lower part of the Bollinger Bands indicator. This suggests an increase in selling pressure and high bearish momentum.
Featured image from Pixabay and chart from Tradingview.com
The bullish momentum in Chainlink (LINK), which spiked the asset to $6.75 on May 18, 2023, ended on May 19. From May 19 till date, LINK recorded a bearish pressure as the price gradually decreased each day till May 24, when it closed at $6.33.
Currently, on May 25, 2023, Chainlink’s price stands at $6.30 on CoinMarketCap, indicating a further decline over the past 24 hours.
LINK is a prominent cryptocurrency that bridges the gap between smart contracts and real-world data. The native token of Chainlink, LINK, has exhibited negative performance within the last day’s trading session. Notably, the asset has been on a downtrend in the last seven days resulting in a loss of 6.25%.
These losses suggest sellers pressure buyers beyond their capacity to hold the price, leading to downward pressure on LINK’s price. Investor’s market confidence was reduced, resulting in a steady price decline over the last seven-day trading session.
Based on social sentiment indicators, CFG, Chainlink (LINK) displays a general negative sentiment with a reading of 17.5%. This implies negative social media conversations or a lack of enthusiasm among investors toward LINK.
LINK has been on a bearish trendline chart pattern since April 18 till date, resulting in a constant price decline within the context of the downward trend.
This pattern is characterized by a series of lower highs and lower lows, indicating sustained selling pressure and a lack of bullish momentum. Traders and investors may interpret this pattern as a signal to anticipate further price declines and consider strategies that align with a bearish market outlook.
Due to increased selling pressure, LINK has broken through the first primary support level of $6.2 and is heading to the next support level of $5.9. With the current bearish momentum, the asset may soon hit this support in the short term.

LINK Technical Analysis Using Indicators
LINK’s trading chart for May 25 shows that the asset’s market trend is bearish. The asset trades below the 200-Day And 50-Day Simple Moving Averages (SMA), suggesting a bearish market sentiment.
This indicates that LINK will experience a bearish momentum both in the long and short-term trends. Investors may see this as an opportunity to take profits, which will cause a further price decline.
The Relative Strength Index (RSI) of LINK currently stands at 37.73, indicating a neutral market. However, the trend line is moving downwards, suggesting an increase in bearish momentum. It is worth noting that an RSI below 30 signifies strong selling pressure, indicating that bears control the market, whereas a level beyond 70 suggests bulls dominate.
Lastly, the Moving Average Convergence/Divergence (MACD) trading below the signal line confirms the bearish moves present in the market. This indicator suggests a high bearish momentum in the market, just like the RSI depicts.
Featured image from Pixabay and chart from Tradingview.com
XRP is in the red today, losing grip of its recent gains as the bears act on its price. The bulls had sustained the price momentum driving XRP to $0.4688 on May 19. The asset traded within this range till May 24, when the bears dropped it to a closing price of $0.454.
But today, XRP’s price has gradually declined to the $0.451 level as the bears continue to exert pressure on its price.
XRP is in a downtrend today, forming a second consecutive red candle on the daily price chart with lower lows. The asset trades below its 50-day Simple Moving Average (SMA), a short-term-bearish sentiment. The 50-day SMA indicates XRP’s average price over a specific period.
Related Reading: Shiba Inu All Green Today – What’s The Energy Behind The Glow?
Also, the Relative Strength Index (RSI) is 46.71 in the neutral zone and descending, further confirming a bearish sentiment for XRP. The RSI has two critical regions the overbought region and the oversold region. RSI values between 70 and 30 are neutral.
Given the descending line of XRP’s RSI, the asset is entering the oversold region from which a trend reversal is imminent.
XRP’s Moving Average Convergence/Divergence (MACD) is above its signal line, suggesting a bullish sentiment. However, the MACD displays negative values, and its histogram bars hint at a bearish reversal.
The MACD identifies the trend direction of an asset and is often used to place trades. Currently, it displays a tentative sell signal in the market today. But XRP is trading above the 200-day SMA, suggesting a bullish trend in the long run.
The altcoin is trading at the $0.4504 support level as the bears seek to push it down. Bearish pressure at the $0.46591 resistance level pushed XRP into a downtrend.

A further decline will see XRP return to the $0.44446 support level and push it to the oversold region. XRP will likely record more price drops in the short term.
However, since it is still trading above its 200-day SMA, a long-term bullish sentiment, the bulls will rally again once they regain control of its price.
Ripple Labs’ ongoing legal case with the US Securities and Exchange Commission is likely one of the reasons behind XRP’s price downturn. However, as the Ripple CEO said, the case may likely conclude soon.
Related Reading: AiDoge Coin Goes Viral, Rakes In $13 Million In Funding Amid Meme Coin Craze
Ripple Labs Attorney Kylie Chiseul Kim filed a letter to withdraw as legal counsel for their ongoing case. The Attorney is leaving her former employers, Kellogg, Hansen, Todd, Figel & Fredrick P.L.L.C, and Devbevoise & Plimpton LLP. Nevertheless, the court filings stated that the law firm would remain counsel for Ripple Labs.
Featured image from Pixabay and chart from TradingView.com
Polkadot (DOT) is in the red today as the bears seek to regain control over its price. DOT traded at $4.37 on January 1, 2023, and increased to $5.13 on January 11.
It remained within this range before moving to $6.23 on January 20. Also, DOT increased to the $7 price level on February 17 as the bulls seized control of its price.
However, a gradual bearish turn between March and April forced it back to $5, where it currently trades today.
DOT is trading in a sideways trend forming a red candle on the daily chart. It is below its 50-day and 200-day Simple Moving Averages (SMA), with bearish sentiment in the short and long term.
Related Reading: Santiment Explains How Bitcoin Investor Mentality Influenced Recent Price Action
The SMA calculates an asset’s average price over a specified period and helps predict trend direction. If the bears persist, DOT’s 50-day SMA, which is about to drop below its 200-day SMA, will form a death cross. Also, the Relative Strength Index (RSI) is 40.73 and in the neutral zone. The RSI is a trend-based indicator.
DOT’s RSI is moving downwards, hinting at further price decline to the oversold region before a trend reversal. The cryptocurrency’s Moving Average Convergence/Divergence (MACD) is slightly above its signal line and shows convergence.
Also, the MACD – a trend momentum indicator that displays the relationship between two exponential moving averages (EMAs) and an asset’s price, displays a negative value conforming to the bearish trend today. The green histogram bars are fading, indicating a changing trend direction.
DOT’s technical indicators all hint at the possibility of further price decline for the asset. It is close to the $5.29 support level as the bears at the $5.42 resistance continue to act on its price, forcing a decline.

DOT has remained in a sideways trend for the last few days and further price decline remains a possibility. However, if the bulls rally again, the $5.42 resistance level will be a realistic target before the $6 psychological resistance level.
The altcoin will likely enter a downtrend if the bears maintain the pressure today. But one thing that offers the possibility of a bullish reversal is the upcoming ‘Polkadot Decoded 2023’ event in June.
Polkadot Decoded 2023 Might Boost DOT’s Performance
Polkadot is hosting a community event, ‘Polkadot Decoded 2023’, between June 28-29 in Copenhagen, Denmark. This event will assemble the Polkadot community in progressive talks anchored by over 100 quality speakers in the crypto community. Also, developers will benefit from interactive and practical sessions based on Polkadot’s technology.
Free virtual tickets are currently available for the wider crypto community around the globe to stream the event online.
Featured image from pIxabay and chart from Tradingview.com
Cosmos (ATOM) experienced a short bullish momentum on May 10, 2023. The asset saw an increase of 10.89% taking its price to a high of $11.2.
However, the bears regained control of the market on May 13 and sent the coin to its current price of $10.40, representing a decrease of 1.12%. From the beginning of May 2023 till date, ATOM has witnessed a price decline of 11.2%, based on its current price.
The ATOM/USDT daily chart suggests that the market sentiment for Cosmos (ATOM) is predominantly bearish. It also shows a downward price movement dominating and hindering any potential bullish momentum.
Related Reading: Data Suggests Small Holders Will Drive Next Cardano (ADA) Rally
The price of ATOM was influenced negatively by the recent chaotic legal battle with its former growth and strategy chief, Grace Yu.
The news raised negative sentiments among investors and market participants toward Cosmos (ATOM). The Validators even urged Cosmos founder Kwon Jae to close the case against Grace Yu. And this action indicates a level of concern within the Cosmos community.
Negative sentiment towards an asset can influence investor behavior, decreasing demand for ATOM and potentially contributing to downward pressure on its price.
An example of this is that ATOM has been trending down since April 17, suggesting a bearish sentiment. The trendline now serves as a reference for identifying potential resistance levels since the asset has tested it severally.

Cosmos (ATOM) trades between $10.160 and $11.301 support and resistance levels. ATOM breaking through the $10.160 primary support level will confirm the bearish momentum. Afterward, the bears might target the next support level at $8.441.
However, the bulls are trying hard to push the price to the primary resistance level of $11.301 but couldn’t due to the high bearish momentum.
ATOM is trading below its 200-Day and 50-Day Simple Moving Averages (SMA), suggesting a bearish market sentiment.
This level indicates that ATOMs’ recent and long-term price averages are declining, potentially indicating a negative trend and a higher likelihood of further downward price movement.
Related Reading: Meme Coin Season May Be Over As PEPE, SHIB, DOGE, Continue Decline
The Moving Average Convergence/Divergence (MACD) confirms the bearish market sentiment as the asset trades the signal line. It suggests that the short-term moving average moves lower than the longer-term moving average, pointing toward downward momentum.
Meanwhile, the Relative Strength Index (RSI), with a reading of 43.29, suggests a neutral market sentiment.
The indicator shows the price is neither overbought nor oversold. For now, the ATOM price outlook is bearish. But crypto assets are volatile and could deviate from predicted price trends without warnings.
Featured image from Pixabay and chart from Tradingview.com
Avalanche (AVAX) is gaining today as it seeks to retain its gains in the last 24 hours. Its trading volume is up by over 18% today, possibly sustaining its price recovery attempt.
Notably, AVAX entered the month of May with a bullish momentum trading at $16.66 on May 1, 2023. However, the bears have kept AVAX’s price at $14 since May 18.
It now approaches the $15 price level seeking to rediscover its positive price form. The increased trading volume today implies that more activities are ongoing on the network.
This surging interest in the network might help AVAX sustain its uptrend. A return to $21 remains likely for the asset in the long term.
AVAX is gaining today, forming a higher high on the daily chart. The bulls are intent on mounting a recovery rally. However, the bears are still active in the market.
Related Reading: How Does Current Bitcoin Rally Compare With Historical Ones?
Since AVAX still trades below its 50-day and 200-day Simple Moving Averages (SMA), the asset will likely see a further price decline in the short and long term. The SMA’s display sell signals prompting traders to take short positions in the market today.
However, some indicators are pointing to a price recovery for AVAX soon. For instance, the Relative Strength Index (RSI) is 38.53 and close to the oversold region.
The RSI indicator mirrors the bearish trend that began on May 18, 2023, but the indicator is moving upwards, hinting at a potential trend reversal for the asset.
Although the AVAX’s Moving Average Convergence/Divergence (MACD) is just breaking above its signal line and showing convergence, its histogram bars display small green bars hinting at a potential trend reversal to the upside.
A close look at the chart structure shows that AVAX entered a downtrend on April 19, 2023. But it found support on May 22, sparking hope for a price recovery.
AVAX has found valuable support at the $14.29 price level, a pivot point for the asset. It is currently trading above its closest resistance level of $14.29. However, the bears are still active in the market, intent on keeping it below the next resistance level of $15.21.

From historical price behavior, AVAX pivoted on the $14.29 support on March 11, 2023, rallying to $21.29 on April 18, with dips in between. It replayed the same action on May 22 and will likely rally again to the $21 price level in the longer time frame.
Note that crypto assets are volatile and can deviate from historical price action. Therefore sound technical and fundamental analysis is essential for trading.
Featured image from Pixabay and chart from Tradingview.com
The bearish pressure in Chainlink (LINK) since April 19, 2023, seems to have ended recently. Notably, the asset dropped from $8.57 to a low of $6.37, representing a dip of 25.67% between April and May 11.
However, a strong recovery in the LINK market started on May 12 till date. On May 21, 2023, the coin rose to a local high of $6.782, changing the trend to favor the bulls.
As the bulls take back control of the market, the price of LINK has increased significantly, giving the investors/traders hope and creating positive sentiment.
Chainlink (LINK) is a leading cryptocurrency that connects smart contracts with real-world data. LINK has demonstrated exceptional performance in the crypto industry, boosting its market capitalization significantly.
Related Reading: Ethereum Whale Resurfaces After 2-Year Hiatus, Stakes $7.4 Million In ETH
The price of Chainlink is $6.48 today, May 22, 2023, with an estimated market cap of $3.35 Billion. LINK’s 24-hour trading volume is up within the last 24 hours by 80.93%, indicating high trading activity in the market.
Currently, Chainlink’s Fear & Greed Index is 76% at Extreme Greed, suggesting that the market sentiment is leaning toward more buying sentiment. This means that investors and traders may be more optimistic about the market’s future and are more inclined to take risks.
One of the key factors contributing to the bullish sentiment around LINK is the general market sentiment toward cryptocurrency. The Relative Strength Index (RSI) indicates the market still favors the bears.
Also, LINK is currently trading below both its 200-Day and 50-Day Simple Moving Averages (SMA), which shows a bearish trend in the market. This also indicates that both long and short-term trends are bearish.
The Moving Average Convergence/Divergence (MACD) confirms a strong bullish momentum as its trades above the signal line. Moreover, the histogram validates the bullish sentiment with a positive trading value and bars above zero.

LINK oscillates between its direct support and resistance levels of $6.212 and $6.773, respectively. The next significant support level is $5.404, while its next resistance level is $7.5. With added momentum from either side, bulls or bears, LINK may hit these levels soon.
According to the on-chain data, whales are strongly bagging LINK into their purse, despite the last dip in the asset. Data from Santiment shows that the 10,000-10,000,000 key whales are accumulating more coins.
This development is encouraging, considering the state of the asset. It might drive up the demand for LINK as investors will be more optimistic.
Generally, the number of whales on the LINK network has been on the rise since 2020. Despite the bear market, the number of whales who stayed with LINK never dropped a bit.
Even with the limited liquidity and funding, the growing presence of whales on the network could fuel further momentum in Chainlink, leading to a rally for the cryptocurrency.
Featured image from Pixabay and chart from Tradingview.com
Chainlink has dropped slightly in the market today as bears seized control of its price. LINK’s current price depicts a loss of 87.7% from its all-time high of $52.88 on May 10, 2021.
The asset has been fluctuating between the $6 and $7 price levels since the beginning of May and is currently at the $6 price level. LINK is also recording a sideways trend on the daily chart, and its trading volume has also tanked by over 32%.
The recent price action is primarily influenced by macroeconomic factors such as inflation, regulatory laws and investor sentiment.
LINK is in a sideways trend today, forming a red candle on the daily chart. It is trading below its 50-day and 200-Simple Moving Averages (SMA), a short and long-term bearish sentiment.
Also, its Relative Strength Index (RSI) is at 41.30 and dropping out of the neutral zone to the oversold region of 30, confirming the bearish trend.
LINK’s Moving Average Convergence/Divergence (MACD) is just above its signal line and shows convergence, a bearish signal. Also, the MACD indicator displays a negative value.
LINK is just above its nearest support level of $6.362, which has proved critical after the 6.177 price level provided initial support. However, its signals on the daily chart look bearish, hinting at a further price drop for the asset. However, if the bulls mount a rally, LINK will encounter resistance at the $6.753 and the $6.907 price levels.

LINK enjoyed a positive price movement in 2023. However, the bears are currently controlling the market. It will likely drop into an oversold region before the bulls rally again.
Chainlink NFTFi
NFTFi is a new concept combining NFTs and decentralized finance (DeFi) solutions. It aims at adding value and liquidity to the growing NFT market.
Chainlink adopted this technological upgrade enabling lending and borrowing. NFT holders now lock digital assets as collateral to acquire liquidity for another digital asset.
Such individuals become qualified to borrow digital assets by paying interest to lenders. This innovation shows why Chainlink has performed well in 2023 and is set for a further price boost if more investors adopt its tokens and upgrades.
Chainlink Upcoming Spring Hackathon 2023
The Chainlink Hackathon event will begin on April 28 and run until June 9, 2023. It is an initiative from the developers to interact and network with the growing Chainlink community.
It features several categories, such as Artificial Intelligence (AI), NFT and gaming, and DAO, and a grand prize of $25,000. Hackathons create great networking opportunities and exchange of ideas among the crypto community.
Also, it brings developers and coders together to interact and generate ideas, thereby boosting a network’s visibility, utility, and adoption.
-Featured image from Pixabay and chart from Tradingview.com
The price of Internet Computer (ICP) experienced a downward movement dropping by 41.98% to a low of $5.05 on April 26, 2023. This was after a significant surge from April 10 to April 19, when it started the downtrend.
This price decline affected the market sentiment of Investors and traders. Since the beginning of this month, ICP has exhibited range-bound behavior. ICP price has fluctuated between $6 – $5, resulting in a sideway price movement.
The question is whether the bearish momentum will continue or if there’s a chance for a reversal soon.
According to data, ICP experienced a slight price increase, reaching $5.34, representing a 2.7% increase within the last 24-hour trading period. This increase suggests that demand has surpassed supply in the market. This might attract more buyers and also increase the overall market confidence.
Related Reading: PEPE Unlikely To Be As Big As DOGE & SHIB, Says Santiment
The total market cap of ICP is also up today by 2.58%, representing a value of over $2 million. The growth in market cap was potentially driven by an increase in demand or positive market sentiment. The 24-hour trading volume surged by 21.81% overnight, rising to about $19 million.
The Internet Computer Fear & Greed Index is 50 based on investor sentiment and market psychology. A value of 50 suggests that neither fear nor greed is dominant among traders and investors.
Based on the recent increase in the overall ICP’s price movement, the bulls are gradually taking control of the market. If this momentum persists, ICP might rise significantly in the next few weeks.
The asset is trading above its 200-Day Simple Moving Average (SMA). This indicates a long-term bullish trend and presents a potential buy opportunity for traders and investors.
While ICP’s long-term prospects are bullish, there may be potential short-term uncertainties that need to be considered by traders.
For instance, the Relative Strength Index is showing 47.46. This shows that there’s market indecision between buyers and sellers. Also, the pressure currently in the market is neutral. Also, the Moving Average Convergence/Divergence (MACD) indicates a potential bearish trend as the MACD is trading below its signal line.
Moreover, ICP is below its 50-Day Simple Moving Average (SMA), a bearish indication based on the short-term price movement. The current price trend, as indicated by the ICP chart, suggests a possibility of further decline in the short term.

But it remains uncertain if this trend will continue or if the bulls will regain dominance as more developments on the network could spike adoption and usage. Internet Computer now trades between its direct support and resistance levels of $4.923 and $6.860.
The next significant support level is $3.302, while the resistance level is $8.251. If the bulls maintain this growing momentum, ICP might break the primary resistance level of $6.860 before heading toward the next resistance level.
Featured image from Pixabay and chart from Tradingview
Toncoin is trading in the red today, losing some of its price gains in the past week. Its 24-hour trading volume is down over 3% at press time, indirectly contributing to today’s price slump.
TON traded at the $2 price level since January 1, 2023, slowly accumulating its gains. However, the bears forced a price decline to the $1.9 price level on May 9, 2023, where the asset trades today.
TON is in a downtrend, forming a red candle. It has dropped below its 50-day Simple Moving Average (SMA), confirming the bearish trend. Also, TON’s Moving average Convergence/Divergence (MACD) is below its signal line and shows a negative value, which is also bearish sentiment.
The Relative Strength Index (RSI) is 42.65, dropping out of the neutral zone as it approaches the oversold region 30. The indicator is also moving downwards, reflecting the pressure from the bears.
TON’s price will likely decline till it rests on its nearest support level and the bulls rally again. Moreover, TON’s 200-day SMA shows a long-term bullish sentiment.

TON is just above the $1.8422 support as the bears mount pressure. A decline below this level will cause a price drop to $1.7525, its next support level. The bearish pressure at the $1.9918 resistance led to the current price drop for the asset. TON will likely continue its downtrend in the short term.
The Ton Foundation announced the latest network developments in a blog post for community members. These developments could lead to a positive price action soon.
Ton Wallet For KaiOS: Ton Wallet is currently available for KaiOS users. KaiOS is the world’s third largest operating system (OS), functional in over 160 million devices. This wallet enables users with low-specification phones to work on KaiOS, mostly Asian, African, and South American users.
Ton.Ski Ecosystem: This consists of various applications combined on the network. Agorata helps users create TON DNS subdomains and build and host simple TON sites. Also, Nonstorage allows users to upload files to TON storage through a web interface, making contracts with storage providers.
Monitoring Platform: This enables users to create projects, view messages, and add contracts in the TON community.
EVAA Protocol: This is the first decentralized lending protocol on the network giving users access to borrow native or wrapped assets directly.
Ton.app: It is an open-source marketplace for Ton apps already existing in the ecosystem. Also, users can submit proposals for projects to feature on this app.
These innovations could help TON’s price action if more users adopt the tokens based on utility and value. However, there are no guarantees of a price increase since cryptocurrencies are volatile.
Featured image from Pixabay and chart from Tradingview
Recently, the price of Toncoin (TON) witnessed a rapid decline, causing investors and traders to worry about the asset’s potential. The bear’s refusal to surrender control can cause TON’s price to drop, increasing the negative market sentiment around it.
The entire cryptocurrency ecosystem is always volatile and unpredictable, with many price fluctuations based on various factors.
After a slight bullish movement, a bearish momentum returned to the Toncoin (TON) market as the price fell by approximately 15.182% to a value of $2 on April 17, 2023.
However, today the bulls are gaining momentum in the market as the price of TON has increased by 5.88% to $2.0 within the last 24 hours trading session.
Notably, the 24-hour trading volume is up today by 22.76%, reaching $16 million. This indicates significant buying and selling activities, which may increase price volatility. Despite the recent pressure from the bulls, the bears may still control the market for a longer timeframe.
According to the market sentiment indicator, the current market sentiment is bearish, while the Fear and Greed index value of 50, Neutral.
TON trades below its 200-Day and 50-Day Simple Moving Averages (SMA). This suggests the market sentiment is bearish, keeping the selling pressure higher than the buying pressure.
It also indicates that the bears are pushing the price to cause a potential downtrend in TON price movement both in the long and short term.
The Relative Strength Index oscillator is currently showing 41.82, neutral. This indicates the market is now in the neutral zone; no pressure from any trend exists.
Lastly, the Moving Average Convergence Divergence (MACD) indicates bearish price movement as it is below the signal line. The massive pressure from the bears has caused the histogram to be below zero, confirming the bearish momentum.

TON is trading between its primary support level of $1.768 and resistance level of $2.099. The next significant support and resistance levels are $1.284 and $2.379, respectively.
Recently, TON published made a press release about the TON Foundation’s approved grant recipients for Round 1 of 2023 Q2.
This development will bring significant value to TON by improving the visibility of TON-based applications, enabling o-chain lending, and providing on-chain contract management.
The project will also introduce new user-friendly utilities for TON core services and will expose Toncoin (TON) to a larger audience through TON wallet integration with KaiOS. All these events will increase demand for TON, which may affect the price positively.
Featured image from Pixabay and chart from Tradingview
One of the leading scalable payment providers in the world, DASH, has attained a significant level in the crypto industry. But like other cryptocurrencies, the price of DASH is subject to volatility, and its value can fluctuate significantly in a short period.
Unfortunately, Since February 16, 2023, DASH has witnessed a loss of about 45.45%, bringing the coin down to $40.88.
This DASH downtrend has left investors and traders wondering what could be chasing the price down.
According to the 24-hour trading chart, the price has steadily decreased since the bears took full control of its market. This is a result of negative market sentiment towards DASH.

This report shows DASH’s market sentiment is bearish, while the Fear & Greed Index shows a neutral 51. Notably, data from Dash Explorer has observed that the Blockchain is experiencing more activities lately. This could be a long-term dump as investors fear to hold DASH further as Dash Explorer recorded that it has more output from its blockchain than input.
Today’s DASH price is $41.50, down by -5.89% in 24 hours. It is currently down by 17.00% within the last 7 days. But its 24-hour trading volume has gained 6.3% at $72 million.
The crypto asset is trading below its 50-day and 200-day Simple Moving Averages (SMAs) and attempting to form a Death Cross. This is generally considered a bearish sign.
As DASH tries to form a Death Cross, it could lead to further selling pressure, as traders and investors may take this as a sign to sell their holdings or to take short positions. The SMA indicator suggests that both the long-term and short-term trend is bearish.
The Relative Strength Index confirms the bearish momentum as the high selling pressure is high. The RSI with a reading of 24.50 shows that DASH is currently in the oversold zone indicating a potential selling opportunity.
The Moving Average Convergence Divergence (MACD) is below the signal line, and the histogram is below zero; this indicates a bearish trend.
When the MACD line falls below the signal line, it suggests that price trend momentum is slowing down and there’s an increase in selling pressure. In addition, when the histogram is below 0, it confirms that the bearish momentum and the decline may continue.
Overall, the combination of the above indicators suggests that the market is currently bearish, and traders should trade with an extreme risk management strategy.
Featured image from Pixabay and chart from Tradingview.com
The bullish trend that Chainlink (LINK) has enjoyed for much of its existence seems to have recently ended. The price of LINK has crumbled as the bears take down the bulls, leaving investors wondering what the future holds for the asset.
There was a significant 24.55% decrease within the past weeks in the Chainlink (LINK) market. Notably, on April 18, 2023, LINK dropped from $8.795 to a low of $6.635, changing the trend to favor the bears.
LINK is trading in the red today, May 8, 2023. As of the time of writing, the price is $6.66, representing a decline of 3.31%. Also, its 7 days price gains have declined, sitting at a loss of 3.44%.
LINK price kickstarted a downtrend from April 19, when it lost grip on the $8 price mark to $7. It fell below $7 to $6.91 and $6.99 on May 1 and 2 before reclaiming the $7 price. However, it continued declining till the current price of $6.94 today.
Related Reading: Shiba Inu: Whales Accumulate Yet Price Drops – What’s Going On?
Currently, the chainlink Fear & Greed Index is 55. This sentiment indicates that LINK’s market is presently neutral or slightly optimistic. One of the key factors contributing to the bearish sentiment around LINK is the general market trend.
One of the key factors contributing to the bearish sentiment around LINK is the general market trend. The cryptocurrency market has been highly volatile over the last two weeks, with many assets, including Bitcoin and Ethereum, experiencing significant price drops.
However, it is still uncertain whether the bulls will retake power and drive the price of LINK upward or if the bears will continue to rule the market.
The Chainlink trading chart for May 8, 2023, shows its market trend is bearish, and LINK shows negative momentum.

Currently, the asset is trading below its 200-Day and 50-Day Simple Moving Averages (SMA). This indicates a bearish trend in the market. This also shows that both long-term and short-term trends are bearish.
LINK price is lower than its average price over the past 50 days and 200 days, respectively, and the market’s selling pressure is high.
The Relative Strength Index (RSI) is at 38.68; this shows that LINK is currently low selling pressure. An RSI below 50 indicates that the bears control the market.
Lastly, the MACD line is trading below the signal line, indicating that the sellers have more control than the buyers. The MACD histogram also confirms the bearish sentiment as it is below the zero line. The momentum will continue if the bulls cannot maintain the selling pressure.
Technical analysis/indicators are subjective and do not guarantee future performance. It should be used with other forms of analysis tools.
Featured image from Pixabay and chart from Tradingview.com
Litecoin is shedding its gains in the market today as the bears take control of its price. At press time, its trading volume is down by over 15%, with a price decrease of 2.80% in the last 24 hours. Such a decline comes after major crypto assets like Bitcoin and Ethereum took a blow and entered bearish territory.
After its decline from $101.85 to $90.44 on April 19, 2023, the bears mounted more pressure pushing its price down to $81.11.
LTC is in a downtrend today, forming a bearish engulfing pattern on the daily charts as it descends to lower lows.
It has dropped below its 50-day Simple Moving Average (SMA) and is trading below its 200-day SMA, with bearish sentiment in the short and long term.
Related Reading: Shiba Inu: Whales Accumulate Yet Price Drops – What’s Going On?
Also, its Relative Strength Index (RSI) is at 34.74 and rapidly descending to the oversold region of 30. It implies that the bears are in control as more traders take short positions in the market. And the decreased trading activity is aiding the current price drop.
LTC’s Moving Average Convergence/Divergence (MACD) is below its signal line and displays a negative value. This is a bearish sentiment for the asset.
LTC has dropped below $83.30, leading to speculations of further price decline. The bears at the $88.26 resistance level have resisted a potential break to the upside for the asset. Other critical resistance levels are $90.99, approximately the psychological resistance of $100, and $100.20.
LTC will likely rest on the $80.87 support in the coming days and might decline further to the next support of $78.85. The indicators are all bearish and point to a decline. However, LTC can rally again if the $80.87 support becomes a price pivot for an uptrend.
Litecoin Halving Boost Hope For A Future Rally In 2023
Litecoin is a cryptocurrency from the original Bitcoin protocol. Litecoin halving is similar to that of Bitcoin which is an event where miners’ rewards are reduced significantly as a price control measure to increase scarcity and boost its value.
100 Days till the Litecoin Halving!
— Litecoin (@litecoin) April 24, 2023
Since its creation, LTC has held two halving events in 2015 and 2019. The block rewards were reduced from 50 LTC to 25 LTC in 2015 and 25 LTC to 12.5 LTC in 2019.

The next halving is 86 days away and will decrease the miner’s rewards per block from 12.5 to 6.25 LTC. The projected halving date is August 3, 2023.
Litecoin daily mining rewards stand at 7,200 LTC daily, equivalent to $588,600. Also, its hash rate is 625.39 TH/s which is still profitable for miners.
The halving event occurs every four years, similar to Bitcoin’s, and might trigger a price increase, although this is not guaranteed.
Featured image from Pixabay and chart from Tradingview.com
The Dogecoin market saw a significant drop in price on May 4 to a low of $0.077 but eventually increased by 5.19% the next day. Despite the bear’s pressure, Dogecoin bulls are struggling to regain positive market sentiment.
Notably, the Dogecoin price has experienced a slight 0.53% increase within 24 hours. According to CoinMarketCap, DOGE has a 24-hour trading volume of $345,154,234, up by 37.60%.
Based on its market cap of $11.02 billion, Dogecoin is presently ranked No. #8 among all cryptocurrencies with a price of $0.07.
Dogecoin market sentiment seems bearish as today’s Fear & Greed Index is 27 (Fear). This indicates a relatively low investor sentiment towards DOGE and suggests that the market may be experiencing fear or uncertainty.
Notably, DOGE is experiencing high volatility, fluctuating rapidly over short periods. Despite the downtrend, the Dogecoin bulls are trying to ease market pressure by continuing to buy the asset and pushing its price up.
Dogecoin trades below the 50-Day and 200-Day Simple Moving Averages (SMAs). These levels indicate that DOGE is in a downtrend or bearish movement due to high selling pressure.

The Relative Strength Index (RSI) indicator shows 45.24, which suggests that the asset’s momentum is relatively neutral. An RSI reading of 45.24 is closer to the oversold region than the overbought territory, which may indicate that the asset is slightly undervalued or oversold.
The MACD trades below the signal line, indicating that the sellers control the market. The MACD histogram also confirms the bearish sentiment as the histogram is below the zero line.
The momentum will likely continue going down if the bulls cannot maintain the selling pressure.
Below are some key factors affecting Dogecoin:
Endorsement From Celebrity: The involvement of celebrities, news coverage, and engagement from the community have contributed significantly to the growth of Dogecoin.
This cryptocurrency has become an important financial instrument, often included in institutional investment portfolios and widely accepted by exchanges.
Notably, famous figures such as rapper Snoop Dogg, rock band KISS leader Gene Simmons, and Tesla CEO Elon Musk have been vocal about their support for Dogecoin, with Musk tweeting about the cryptocurrency since 2019 and each tweet causing a surge in its price.
Market Sentiment: Like any other asset, the price of Dogecoin is influenced by market sentiment. If investors are optimistic about the future of Dogecoin, they may buy more, driving up the price. Conversely, if investors are bearish about the cryptocurrency, they may sell their holdings, causing the price to decline.
-Featured image from Pixabay and chart from Tradingview
On March 20, 2023, Stacks (STX) hit an all-time high of $1.30. But the price declined below the $1 mark on March 25 as the bears increased momentum. The asset has remained under the mark from March until May 5.
The 4-hour time frame chart today indicates that the STX token is trading on a downtrend movement due to high selling pressure. The token is also in a long-term downtrend, with the bears increasing its selling pressure forming lower highs and higher lows.
The overall structure of the STX market is bearish, with the bears battling with the bulls to take full control. The 4-hour chart shows that the STACK token is trading at $0.7276, with a decrease of -6.47% within the last 24 hours.
Related Reading: This Meme Coin Created By GPT-4 Is Now Worth $40 Million, Here’s Why
STX’s 24-hour trading volume is down by 56.76%, with a total market cap of $1 billion. This also shows that STX is not experiencing many activities at the moment.
Despite the increased selling momentum resulting from the investor’s sentiment, the bulls are attempting to regain control by taking advantage of the support level at $0.67.
Currently, STX is trading within the range of the 200-day simple moving average and the 50-day simple moving average, suggesting a neutral market position or consolidation phase.
Consequently, traders and investors may use the 50-day and 200-day SMAs as reliable support and resistance levels while trading.
Notably, a breach above the 50-day SMA may signal a potential short-term uptrend, presenting a buying opportunity for traders. The fact that STX lacks an obvious trend, either upward or downward, suggests that the price is stable.
Currently, the RSI level of STX is 41, which shows that the STX market is heading towards the neutral zone, and there’s indecision. The Moving Average Convergence Divergence (MACD) line is below the signal line, which suggests a potential sell opportunity.
Moreover, the histogram, which measures the distance between the MACD line and the signal line, is below the zero line, indicating that the security is trading below its long-term trend.
Additionally, the histogram is increasing, implying that the bearish momentum is gaining strength. This situation suggests that STX is facing downward pressure, which could continue for some time, allowing traders to short the token.

STX trades between the $0.6666 and $0.8275 primary support and resistance levels. Stack’s first important resistance level is $0.8275. If the price rises above this level, the next significant resistance levels are $1.0212 and 1.3103.
Conversely, with high selling pressure, the price of STX may fall below its important support levels of $0.5220 & $0.2684.
Featured image from Pixabay and chart from Tradingview
According to Uniswap’s (UNI) price chart, the coin is moving sideways on the chart. As the market opened, the price dropped to $5.30, where UNI found little support.
Bulls are trying to regain control, but selling pressure is quite strong. The coin started exhibiting bearish momentum after April 19, 2023, when sharp crashes were observed in the chart. As of today, May 2, it has continued the bearish trend.
Uniswap opened in April at $6.0603 and t traded around the same price level at the start of the next day before recording a pullback to $5.9461 at the close of the market. Luckily, UNI regained its grip above $6 on April 4.
Related Reading: Terra Classic Recent Efforts Could Benefit LUNC’s Growth Potential
UNI maintained the same price level from April 4 to 7 before dipping to $5.9191 on April 8. Thankfully, the price dip lasted for 5 days only. On the April 13 close of the market, UNI gained again above $6.
It remained at the level until April 20, when it lost the grip falling to the $5 price range and continuing till today, May 2.

The price of Uniswap is $5.31 as of today, May 02, 2023, indicating a loss of 1.74%. Also, its market cap is down by 2.05% at $3.06 billion with UNI’s 24-hour trading volume down by 26.90% at $33 million.
The 1-day price chart for Uniswap price analysis indicates that the UNI bulls are doing their best to control the price decline. However, the bears are still in charge of today’s price trend. But despite being under selling pressure today, the value of UNI/USD has only decreased by 1.74% percent over the past 24 hours.
UNI price is in a zone where investors or traders are afraid to buy UNI, and holders will likely sell due to the current market sentiment. As such, the downtrend might continue, except the bulls build back the bullish momentum.
UNI Key Price Levels
Based on the Uniswap chart today, the coin directly supports $4.628. If the bears continue this momentum, the next significant level is $3.341. The coin will have trouble breaking past the $7.761 resistance level with this low momentum.
Since April 18, 2023, when the price of Uniswap fell below its 50-day SMA, this indicator has been indicating a SELL signal.
Uniswap is also trading below the 200-day SMA. Since April 18, 2023, the 200-day SMA has indicated SELL for the previous 13 days. The Relative Strength Index (RSI) momentum oscillator is 38.58, which shows that UNI is neutral.
The MACD line is also below the signal line and trading in a downtrend, indicating bearish movement.
Featured image from Pixabay and chart from Tradingview
Internet Computer (ICP) is trading red, hovering around the $5.6 price mark today, May 2, 2023. According to its daily chart, the bearish trend began two days ago, following three-day bullish moves.
The turn in the market sentiment has resulted in the recent plunge in ICP price. Aside from this, the world’s largest cryptocurrency, Bitcoin, is also down by 1.89% over the past 24 hours.
This could also be a factor affecting ICP’s price at the moment. While a reversal is not certain, some technical indicators can show whether or not the chances are high.
Judging from the ICP price of $3.9309 at the start of 2023, the token has made more bullish moves than bearish ones. ICP currently trades at $5.719, showing a 24-hour price decline of 5.99%.
Related Reading: Terra Classic Recent Efforts Could Benefit LUNC’s Growth Potential
The token’s market cap has dropped by 6.50% in the last 24 hours to around $2.46 billion. The trading volume within the same period has also declined by 20.69%, hovering around $60,208,714.
The plummeting value of the trading volume indicates more selling pressure among investors and traders. If this trend continues, ICP may likely see its price fall to the $5 price level before the end of the day.
Moreover, data suggests that the general price prediction sentiment of the Internet Computer token is bearish. Based on its findings, 17 indicators signal a bearish trend, while 11 technical indicators display bullish signals. But let’s consider some major indicators from the daily chart to confirm its potential move further.
The price of the Internet Computer token is currently above the 50-day and 200-day Simple Moving Averages. While that is supposed to indicate a buy tendency, the Relative Strength Index (RSI) negates it, as it stands at 50.42. This figure suggests a neutral state in the ICP market but with higher odds of selling pressure.

The token made a Death Cross several days back which lead to a significant drop in its price. The market may create a Golden Cross later on, but this might come after a major decline in its price, considering the interpretation of the technical indicators.
Related Reading: AVAX Smart Contracts Hit 6-Month High – What This Means For Its Price
The chart also shows that ICP’s price fell from a resistance level of $6.339. Crypto traders and investors can expect its price to fall further to hit the closest support level of $4.996. Other resistance and support levels are $7.449 and $4.525, respectively.
Note that even while the technical indicators can be a helpful tool for analysis, investment decisions shouldn’t be made solely based on them. Traders should also consider various factors and risk management strategies.
Featured image from Pixabay and chart from Tradingview


