Mr. 100, an entity previously identified as Upbit, has bought over $147 million worth of Bitcoin for the first time since the halving, suggesting an end to the current retracement.
Cryptocurrency Financial News
Mr. 100, an entity previously identified as Upbit, has bought over $147 million worth of Bitcoin for the first time since the halving, suggesting an end to the current retracement.
Billionaire investor Anthony Scaramucci, the founder of SkyBridge Capital, recently discussed the viability of financial assets. He took to X, a social media platform previously known as Twitter and owned by Elon Musk, to highlight the decreasing purchasing power of the United States dollar in comparison to the potential of Bitcoin (BTC).
In the post on X, the SkyBridge Capital founder pointed out that a dollar from 2020 is now only worth about 75 cents, underscoring a significant devaluation due to inflation.
According to Scaramucci, this scenario illustrates why investors should reconsider traditional fiat currencies as a reliable store of value, advocating instead for the inherent benefits of digital assets like Bitcoin.
Dollar from 2020 is now worth 75 cents. Buy Bitcoin credit @balajis pic.twitter.com/WzIosKfJv2
— Anthony Scaramucci (@Scaramucci) April 26, 2024
Scaramucci’s critique comes at a time when the global economy grapples with heightened inflation rates, which have eroded the real value of fiat money.
He specifically cited a “25.14% compounded inflation rate” as a critical indicator of why the dollar is losing ground. In contrast, Bitcoin has not only maintained a strong profile but has also appreciated in value, further cementing its position as a viable hedge against inflation and a potential safe haven for investors.
So far, Bitcoin’s market performance has been quite appealing. Particularly, despite the significant downturn experienced in the past few years, the asset has managed to come out of the bloodbath and recently soared to an all-time high above $73,000 in March.
This peak performance labels Bitcoin as not just a digital asset but a major player in the global financial landscape.
However, despite Scaramucci’s bullish outlook, it’s worth noting that Bitcoin has seen its share of volatility. It has been struggling to maintain its appeal recently, with a modest 0.9% increase in the last 24 hours – a slight recovery from a 2% drop over the past week.
Further insights into the market’s behavior towards Bitcoin reveal changing dynamics. Data from CryptoQuant highlighted a negative turn in the Bitcoin funding rate for the first time since October 2023, indicating a cooling interest in speculative trading on the asset.
This shift suggests that while the long-term outlook might still be strong, short-term investor sentiment has become cautious, possibly awaiting clearer signals before making further commitments.
The current market sentiment is also reflected in the technical analysis of a prominent crypto analyst, Ali. In Ali’s recent post on X, a notable mention was made of a “death cross” seen in Bitcoin’s 12-hour chart, where the short-term moving average dips below a long-term counterpart, traditionally a bearish signal.
Additionally, the Tom Demark (TD) Sequential indicator points to potential price reversals after a consistent trend, adding another layer of complexity to Bitcoin’s trading strategy.
Despite these potentially bearish indicators, on-chain data from Santiment shows an interesting trend: Bitcoin whales have increased their holdings significantly, now owning 25.16% of the total supply.
This accumulation suggests that while retail sentiment may be bearish, large-scale investors are seeing the dips as buying opportunities, potentially prepping for a future bullish run.
Featured image from Unsplash, Chart from TradingView
Recent trends in the crypto market have indicated a notable shift in trader behavior, particularly among those investing in Bitcoin.
Using data from CryptoQuant, Bloomberg has revealed that the Bitcoin funding rate—the cost for traders to open long positions in Bitcoin’s perpetual futures—has turned negative for the first time since October 2023.
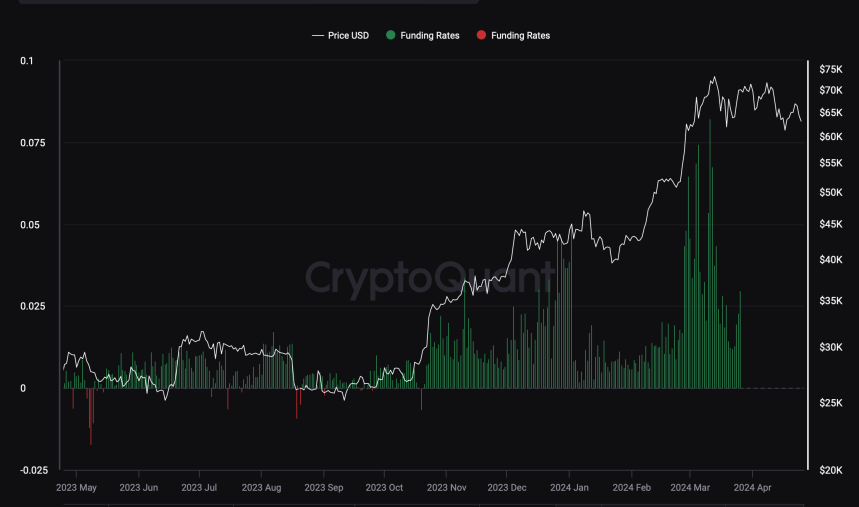
This change suggests a “cooling interest” in leveraging bullish bets on Bitcoin, coinciding with the fading impact of major market drivers.
The decline in Bitcoin’s funding rate correlates with a reduction in net inflows to US spot Bitcoin Exchange-Traded Funds (ETFs), which previously pushed the cryptocurrency to record highs.
Despite the anticipation surrounding the Bitcoin Halving—an event reducing the reward for mining new blocks and theoretically lessening the supply of new coins—the price impact has been surprisingly muted.
According to Bloomberg, this subdued response has compounded the effects of broader economic factors, such as geopolitical tensions and changes in monetary policy expectations, leading to increased risk aversion among investors.
Following the latest Bitcoin halving, the market has not seen the bullish surge many expected. Instead, Bitcoin has only seen a correction of over 10%, from its all-time high (ATH) in March with prices stabilizing in the $63,000 region, at the time of writing.
As CryptoQuant’s Head of Research Julio Moreno pointed out, the recent downturn in Bitcoin’s funding rates to below zero underscores a “decreased eagerness” among traders to take long positions.
According to Bloomberg, this trend is supported by a significant drop in daily inflows to US spot Bitcoin ETFs and a reduction in open interest in Bitcoin futures at the Chicago Mercantile Exchange (CME), which indicates a broader cooling of enthusiasm for crypto investments.
[1/4] Bitcoin ETF Flow – 25 April 2024 – UPDATE pic.twitter.com/ojRayOFlnu
— BitMEX Research (@BitMEXResearch) April 25, 2024
In a Bloomberg report, K33 Research analyst Vetle Lunde noted that the “current streak of neutral-to-below-neutral funding rates is unusual,” suggesting that the market might be entering a price-consolidation phase.
Notably, this period of reduced leverage activity could potentially lead to further price stabilization, but it also raises questions about the near-term prospects for Bitcoin’s recovery.
Interestingly, alongside these market adjustments, Bitcoin’s mining difficulty has increased for the first time immediately following the fourth halving.
The difficulty adjustment, which occurs every 2016 block, increased by 2%, reaching a new high of 88.1 trillion, according to Bitbo data.
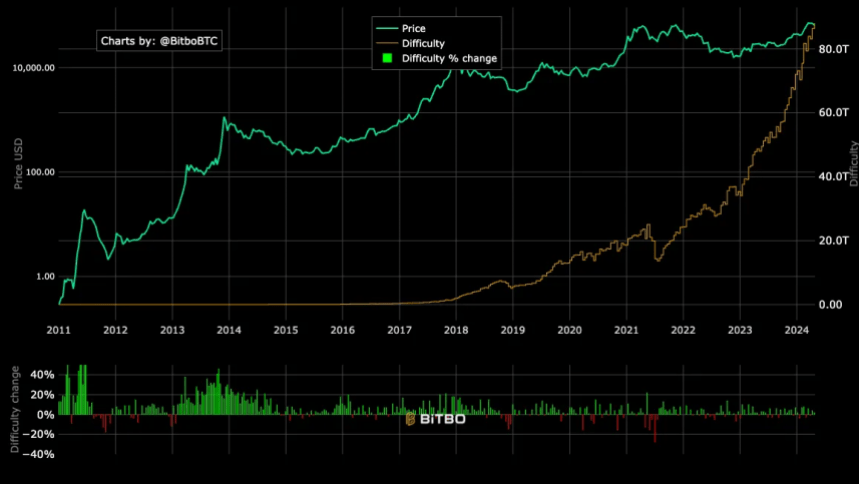
This adjustment contradicts past trends where the difficulty typically decreased post-halving due to reduced profitability pushing less efficient miners out of the market.
This anomaly in mining difficulty suggests that despite lower rewards post-Halving, miners remain active, possibly buoyed by more efficient mining technologies or strategic shifts within mining operations.
This resilience in mining activity could help sustain the network’s security and processing power. Still, it reflects the complexities of predicting Bitcoin’s market dynamics solely based on historical halving outcomes.
Featured image from Unsplash, Chart from TradingView

A new Bitcoin computational framework aims to power various applications and functions using native BTC, including token bridges and aggregator oracles.
Recent insights from Glassnode’s cofounders, shared under their X (formerly Twitter) account ‘Negentrophic’ have sparked interest in Bitcoin market dynamics, leading to a promising stabilization and possible price surge.
With Bitcoin’s value recently wavering below the $70,000 mark, a detailed analysis from the cofounders suggests that a strong support level around the $62,000 50-day Exponential Moving Average (EMA) could set the stage for a significant rebound.
This crucial support level indicates a strong buying sentiment, indicating the market’s confidence in the cryptocurrency’s value and a potential resistance against further declines.
Using the strategic placement of the 50-day EMA as a support point, the analysis suggests that investors might see the current price levels as a solid base, preventing significant downward movements.
#BTC potential trajectory may offer Buy-the-dips Opportunities
BTC’s 50-day EMA near $62k provides potential support, targeting $72k for a rebound.
Shorter EMAs signal a tendency to buy, while longer EMAs suggest a preference for selling.
Given BTC’s recent significant gains… pic.twitter.com/3NjUUqa001
— 𝗡𝗲𝗴𝗲𝗻𝘁𝗿𝗼𝗽𝗶𝗰 (@Negentropic_) April 23, 2024
This perspective is reinforced by recent price movements, where despite a pre-halving general dip, Bitcoin has experienced a 7.1% increase in value over the past week, and the same uptick continued in the last 24 hours.
Further analysis by the Glassnode cofounders delves into the behavior of EMAs over different durations. Short-term EMAs indicate a growing inclination among investors to buy, while longer-term EMAs lean towards selling.
This contrasting behavior between short and long-term EMAs sheds light on the current phase of the market, which seems to be in a period of consolidation after the notable 92% increase in Bitcoin’s price over six weeks earlier in the year.
Such insights are vital as they offer a deeper understanding of the underlying market forces and investor behavior during volatile periods.
Meanwhile, Glassnode’s team’s analytical approach extends beyond simple price movements. Yesterday, they compared the current market conditions to the early 2021 “strong correction,” which they term “wave 4” of the ongoing market cycle.
This historical perspective provides a lens through which current trends can be evaluated, suggesting a cyclic return to bullish conditions reminiscent of past market behaviors.
Bitfinex analysts have highlighted significant activities around Bitcoin withdrawals, supporting the optimistic outlook on Bitcoin. The current levels, echo those of January 2023, suggest that investors are increasingly moving their Bitcoin to cold storage—a sign that many anticipate further price increases.
Veering back to Glassnode’s projections yesterday based on their indexes and Fibonacci levels, the cofounders were boldly optimistic, anticipating a potential 350% increase from current market levels.
The #Crypto Bull Market Continues.
“OTHERS” follows Crypto excl. the largest 10 Cryptos.
Observe that we in early 2021 had a strong correction. We believe that was a wave 4.
We now have a similar strong decline.More upside is coming. This index and our Fibonacci levels… pic.twitter.com/qKtIOSXneP
— 𝗡𝗲𝗴𝗲𝗻𝘁𝗿𝗼𝗽𝗶𝗰 (@Negentropic_) April 22, 2024
Notably, this forecast highlights the expected financial trajectory and underscores a growing confidence among experts and market analysts in Bitcoin’s market performance and its foundational economic principles.
Featured image from Unsplash, Chart from TradingView
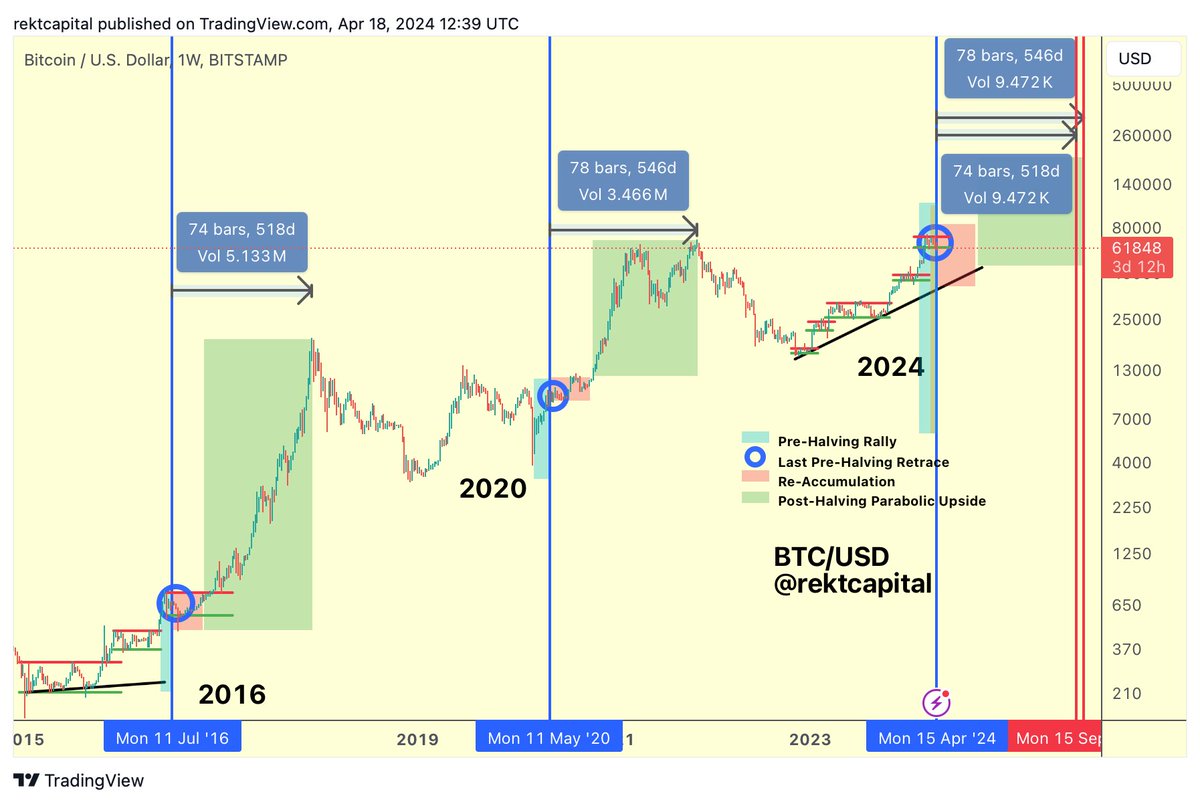
In a recent tweet, well-known crypto analyst Rekt Capital delved into the potential timeline for the next Bitcoin market peak, emphasizing the Halving cycle’s significant impact on building BTC’s market path.
As the Bitcoin Halving is set to occur between today and tomorrow, April 20, Bitcoin has shown less significant market movement. At the time of writing, the asset has a market price of $64,578.
According to Rekt Capital’s analysis, Bitcoin typically reaches its bull market peak between 518 and 546 days following a Halving event. Applying this historical timeline, the next anticipated bull market peak could fall between mid-September and mid-October 2025.
However, as disclosed by Rekt Capital, recent market trends suggest a possible acceleration in Bitcoin’s ongoing cycle compared to historical patterns, demonstrated by the cryptocurrency achieving new record levels approximately 260 days ahead of the typical schedule.
Despite this apparent acceleration, Rekt Capital noted:
Bitcoin has been experiencing a Pre-Halving Retrace for the past month or so As a result, Bitcoin has been slowing down and decelerating the cycle by 30 days thus far and counting So while Bitcoin may have been accelerating by ~260 days last month… Today this acceleration is now more close to ~230 days due to the current Pre-Halving Retrace.
Additionally, Rekt Capital introduced an alternative viewpoint termed the “Accelerated Perspective,” which factors in the duration from when Bitcoin exceeds its previous peak to the projected culmination of the bull market.
Given Bitcoin’s recent attainment of new all-time highs in March, this perspective implies that the subsequent bull market peak could happen between December 2024 and February 2025.
When Could Bitcoin Peak In This Bull Market?
Historically, Bitcoin has peaked in its Bull Market 518-546 days after the Halving (Chart 1)
This is how typical Bitcoin Halving Cycles have progressed
So if history repeats…
Next Bull Market peak may occur 518-546 days… pic.twitter.com/QXZUS7ZyjU
— Rekt Capital (@rektcapital) April 19, 2024
Meanwhile, amidst recent market fluctuations, BTC is undergoing a slight recovery. At the time of writing, it had increased marginally by 1.4%, bringing its market price to above $64,000. This recovery follows a week-long decline during which Bitcoin experienced nearly a 10% downturn.
In light of these developments, crypto expert Michaël van de Poppe has shared insights into the potential implications of the impending BTC Halving event. Van de Poppe suggests a shift in focus away from Bitcoin once the halving occurs, speculating on potential changes in market narratives.
While he did not specify the exact narrative shift, Van de Poppe previously outlined expectations for the crypto market, including an anticipated emphasis on Ethereum (ETH) and projects focused on Decentralized Physical Infrastructure Networks (DePIN) and Real World Assets (RWA) post-Halving.
Expectance:
– #Bitcoin to consolidate.
– #Altcoins bouncing in their Bitcoin pairs.
– Narrative to shift to ETH and DePIN/RWA.
– Altcoin strength from in Q2/Summer.
– Corrections in Q3.It’s going to be great, just buy the dip.
— Michaël van de Poppe (@CryptoMichNL) April 17, 2024
Featured image from Unsplash, Chart from TradingView
Legendary trader Peter Brandt has recently shared notable insights into the potential future trajectory of Bitcoin price, suggesting the possibility of a significant market move for the crypto asset.
This insight comes as Bitcoin appears to be recovering slightly from its week-long decline. The asset is up nearly 5% over the past 24 hours, with a current trading price of $64,968 at the time of writing.
Brandt’s analysis, presented through a series of charts, outlines a distinctive pattern in Bitcoin’s historical price behavior, characterized by three distinct phases.: the Hump-Slump, Bump-Rump, and Pump-Dump cycles.
As per Brandt’s observation, while Bitcoin has completed the initial two phases of the cycle, the third phase, marked by the “pump” component, remains unfulfilled, hinting at potential bullish momentum ahead.
What say you?? $btc pic.twitter.com/IDvIpkZeER
— Peter Brandt (@PeterLBrandt) April 18, 2024
Meanwhile, amid heightened market volatility and uncertainty, Bitcoin has faced notable price fluctuations, experiencing a nearly 10% decline over the past week.
However, recent bullish momentum has seen the cryptocurrency surging by 3.7% in the past 24 hours, with its price briefly climbing above $65,000 after hitting a 24-hour low of $60,000.
This upward movement aligns with Brandt’s suggestion of a pending bullish phase in Bitcoin’s price cycle, adding weight to the anticipation of a potential market “pump.”
In addition to Brandt’s analysis, industry leaders and analysts have offered their perspectives on Bitcoin’s future trajectory.
Anthony Scaramucci, founder and managing partner of Skybridge Capital, has recently projected a bullish outlook for Bitcoin, forecasting a potential price surge to $200,000 following the upcoming halving event.
Scaramucci cited various factors, including the influence of new financial products like spot ETFs and increasing institutional interest, as key drivers behind Bitcoin’s anticipated price appreciation.
However, amidst optimistic forecasts, CryptoQuant, a prominent crypto analytics platform, has cautioned that Bitcoin could face a significant downturn to $52,000 if its price breaches the critical $60,000 support level.
Derivative Uncertainty
“If the price breaks below $60,000, we might witness a decline to $52,000 before a subsequent rise.” – By @ShivenMoodley
Full post
https://t.co/XSBnfexbzZ
— CryptoQuant.com (@cryptoquant_com) April 18, 2024
A CryptoQuant analyst particularly noted:
If the price breaks below $60,000, we might witness a decline to $52,000 before a subsequent rise. However, given the significant dominance of institutional ETFs, I wouldn’t be surprised if they accumulate excess supply from liquidations near the short-term support level of $60,000.
Featured image from Unsplash, Chart from TradingView
Amidst the ongoing fluctuations in the cryptocurrency market, the price of Bitcoin has surged by 1.7% in the past 24 hours, hovering above the $62,000 mark.
However, recent warnings from CryptoQuant, a leading crypto analytics platform, suggest that Bitcoin could face a significant downturn to $52,000 if specific key levels are violated.
This cautionary note comes amidst growing uncertainty in the Bitcoin derivatives market, with derivative traders showing unprecedented caution compared to previous halving cycles.
CryptoQuant’s analysis highlights declining open interest and funding rates in the Bitcoin derivatives market, indicating a “cautious” stance among traders, particularly with the arrival of several institutional participants. CryptoQuant analyst Shiven Moodley noted:
At this halving, derivative traders exhibit far more caution than in previous instances. This season witnesses the entry of numerous new institutional players into the market.
According to the analyst, If Bitcoin’s price falls below the critical $60,000 support level, the top cryptocurrency could experience a notable correction to $52,000, signaling a potential short-term bearish trend.
Derivative Uncertainty
“If the price breaks below $60,000, we might witness a decline to $52,000 before a subsequent rise.” – By @ShivenMoodley
Full post
— CryptoQuant.com (@cryptoquant_com) April 18, 2024
However, the presence of institutional Bitcoin Spot ETFs may mitigate the severity of the decline by absorbing “excess supply from liquidations” around the $60,000 support zone.
Moodley stated:
If the price breaks below $60,000, we might witness a decline to $52,000 before a subsequent rise. However, given the significant dominance of institutional ETFs, I wouldn’t be surprised if they accumulate excess supply from liquidations near the short-term support level of $60,000.
Meanwhile, crypto trader and analyst Ali has further fuelled concerns by identifying a pivotal price level for Bitcoin. Ali’s analysis indicates that if Bitcoin drops to $50,500, over $15 billion in liquidations could occur on the Binance alone.
#Bitcoin dropping to $50,500 will trigger over $15 billion in liquidations on #Binance alone! pic.twitter.com/9wQTVwprgx
— Ali (@ali_charts) April 17, 2024
Such a significant liquidation event could exert immense pressure on the market, potentially leading to further price declines and heightened volatility.
This outlook echoes recent warnings from prominent analyst Crypto Rover, who has also cautioned about a potential liquidation event affecting short holders if Bitcoin climbs back to the crucial price mark of $71,600.
Despite these concerns, some analysts remain optimistic about Bitcoin’s long-term prospects. Crypto analyst Plan B, known for his Stock-to-Flow (S2F) model, has made bullish predictions for Bitcoin’s future price movements.
According to Plan B, Bitcoin’s upcoming Halving event will serve as a central driver for price increases, with the cryptocurrency expected to surpass $100,000 this year and exceed $300,000 by 2025.
Featured image from Unsplash, Chart from TradingView
Bitcoin stands at the forefront, with its upcoming halving event sparking excitement and uncertainty among investors. As the countdown to Bitcoin’s fourth halving narrows to roughly three days, market dynamics have taken a tumultuous turn, with significant implications for the digital asset’s price trajectory.
While the Bitcoin market has been on a decline over the past week, A CryptoQuant analyst has recently highlighted a recurring pattern in Bitcoin’s price dynamics observed before each halving cycle.
This pattern entails a significant price decline, a trend witnessed in previous halving events. For instance, during the second halving, Bitcoin experienced a price drop of 40.36%, plummeting to $465 before eventually surging to an all-time high of $19,600.
Similarly, preceding the third halving, the cryptocurrency saw a decline of 20.35%, reaching a low of $8,078 before reaching a peak of $69,000.

In the current halving cycle, the price has already decreased by 16.65%, mirroring the historical trend identified by CryptoQuant.
Pre #BitcoinHalving Price Fluctuations
“It’s essential to recognize that before each halving cycle, there’s typically a price collapse, a pattern we’ve highlighted numerous times in the past.” – By @OnchainTarek
Read more
— CryptoQuant.com (@cryptoquant_com) April 16, 2024
Despite the decline, CryptoQuant suggests that this reduction is typical before halving events, indicating that it may not necessarily warrant concern. The CryptoQuant analyst noted:
There’s no need for alarm, as this scenario repeats consistently in each cycle, albeit with varying percentages. The correct approach now is to enter the market gradually at previously identified strategic points. The path to the current cycle’s peak remains open, and we are still at the beginning of this journey.
Bitcoin’s recent price action reflects the observations made in the CryptoQuant report. The crypto has witnessed a downward trend over the past week, with a decrease of over 10% in the last seven days and a further decline of 3.1% in the past 24 hours. Currently, Bitcoin is trading at $63,098, indicating ongoing volatility in the market.
Industry experts offer contrasting perspectives on Bitcoin’s future trajectory in light of the impending halving. Kris Marszalek, CEO of Crypto.com, acknowledges the likelihood of short-term selling pressure leading up to the halving, citing the familiar adage of “buy-the-rumor, sell-the-news” trading behavior.
Nonetheless, Marszalek remains optimistic about the long-term implications of the halving, emphasizing its potential to “bolster” Bitcoin’s price trajectory over an extended period.
Echoing this sentiment, Samson Mow, head of Jan3 BTC adoption-focused company, dismisses the current price downturn as an “overreaction,” foreseeing a bullish resurgence post-halving.
Mow highlights the impending halving as a catalyst for a significant “supply shock” in the Bitcoin market, driven by the absorption of BTC by spot Bitcoin ETFs and recent regulatory approvals for Bitcoin-related financial products in Hong Kong.
You know what the halving means though. You know it’s the spark of a massive supply shock. You’re tracking ETF inflows and demand. You’re aware of the HK ETFs coming.
You’re the lion accumulating #Bitcoin amidst a herd of sheep.
— Samson Mow (@Excellion) April 16, 2024
Featured image from Unsplash, Chart from TradingView
As the crypto space eagerly awaits the highly anticipated Bitcoin halving event, top crypto analyst Willy Woo has emerged with a bullish prediction that has stirred considerable excitement among enthusiasts.
Woo particularly underscored the potential for Bitcoin’s price to surge dramatically, using the term “ballistic” to describe the expected trajectory post-Halving.
Notably, Bitcoin’s Halving is an integral component of its protocol. It occurs approximately every four years and reduces miners’ reward for validating transactions on the blockchain.
This event also effectively reduces the rate at which new BTC enters circulation, increasing the asset’s scarcity and potentially impacting its price dynamics.
Woo’s analysis delves into the profound implications of the impending Halving, particularly regarding Bitcoin’s supply dynamics. The cryptocurrency experiences an annual supply growth rate of 1.7%, which will be halved to 0.85% following the upcoming event.
This reduction favors Bitcoin’s supply growth rate compared to traditional assets like gold, which boasts an annual supply growth rate of approximately 1.6%.
Moreover, Woo juxtaposes Bitcoin’s supply growth against the US dollar, characterized by a negative growth rate attributed to inflation.
As the USD supply growth trends back to a standard range of 5% to 10%, Woo anticipates a momentous surge in Bitcoin’s price, driven by its inherent scarcity and growing recognition as a hedge against inflationary pressures.
10 days to the halvening… #Bitcoin‘s annual supply growth drops from 1.7% to 0.85%.
This beat’s gold’s number of 1.6% (gold supply doubles every 44yrs)
USD is -1.7% right now in its fight against inflation.
Normal range is 5-10%, when it reverts, BTC goes ballistic. pic.twitter.com/IQNOseFmQB
— Willy Woo (@woonomic) April 9, 2024
While Woo’s bullish forecast sets an optimistic tone for Bitcoin’s future, recent insights from a consumer survey conducted by Deutsche Bank present a more nuanced perspective.
The survey findings reveal a palpable division among respondents regarding Bitcoin’s trajectory, with approximately one-third expressing negativity about its price prospects.
These individuals anticipate Bitcoin’s value to plummet below $20,000 by year-end, representing a stark deviation from the prevailing bullish sentiment.
Adding to the discourse, Authur Hayes, co-founder of BitMEX, offers a dissenting view characterized by a bearish outlook on Bitcoin’s post-halving performance. In a comprehensive analysis shared via a blog post, Hayes outlines his concerns regarding the potential for a significant price decline after the halving.
While many analysts anticipate a bullish rally during the halving period, Hayes posits a scenario in which Bitcoin experiences a more subdued trajectory, emphasizing the need for careful consideration amid heightened market volatility.
Featured image from Unsplash, Chart from TradingView
Amidst the recent market retracement, notable crypto enthusiast and YouTuber Jeremy DaVinci has sparked optimism in the Bitcoin community.
DaVinci’s analysis revolves around a technical indicator, the Bollinger Bands, suggesting a potential rally in Bitcoin’s price trajectory.
According to DaVinci, Bitcoin has closed above the upper Bollinger Bands indicator for two consecutive months, a pattern that historically preceded significant price surges. Drawing from past occurrences, DaVinci hints at the possibility of Bitcoin’s price doubling within three months following this setup.
DaVinci, renowned for his early adoption of Bitcoin and emotional support for the cryptocurrency, has positioned himself as a prominent figure within the crypto space.
With his latest forecast, DaVinci projects Bitcoin’s price to surpass $130,000 within the next three months potentially. This bullish prediction aligns with similar sentiments echoed by other market experts, further supporting optimism among Bitcoin investors.
Things are looking very interesting now.
Bitcoin just closed two months above the upper Bollinger Band!
Historical data shows that whenever this happens, Bitcoin’s price has doubled within three months. pic.twitter.com/jmMpcVzGew
— Davinci Jeremie (@Davincij15) April 9, 2024
Adding to Bitcoin’s bullish sentiment, prominent investor Dan Tapiero has voiced his optimistic outlook for the leading cryptocurrency.
Tapiero, known for his investment insights and founding roles in Gold Bullion International and 10T Holdings, highlighted a significant macroeconomic factor that drives Bitcoin’s potential ascent.
According to Tapiero, the observed correlation in the market points to concerns regarding “monetary debasement” fueled by a substantial increase in the Treasury market over the past five years.
Tapiero’s bullish stance centers on the unique scarcity of Bitcoin as a digital asset, emphasizing its potential to outperform traditional assets like gold.
Most remarkable macro correlation break I’ve seen in some time.
Suggests extreme concern about monetary debasement driven by 60% Treasury mkt increase past 5yrs.
Theme not yet widely subscribed.
Bullish #GOLD and more so when rates drop.
Vaults #Bitcoin to 200k+

— Dan Tapiero (@DTAPCAP) April 8, 2024
While acknowledging the favorable prospects for gold in such a scenario, Tapiero remains particularly bullish on Bitcoin’s future price trajectory. His forecast hints at the possibility of Bitcoin surpassing the $200,000 mark, offering investors an opportunity for substantial gains in digital gold.
The asset has demonstrated resilience amid these speculations and predictions regarding BTC’s possible price rally in the coming months. While Bitcoin has plunged nearly 5% in the past 24 hours, it has traded above $69,000 at the time of writing.
Featured image from Unsplash, Chart from TradingView
Global investor Dan Tapiero recently shared his optimistic outlook for Bitcoin (BTC), suggesting that the leading cryptocurrency soars above the $200,000 mark might be on the horizon.
Tapiero, known for his investment insights and co-founding roles in Gold Bullion International and 10T Holdings, took to X to express this bullish sentiment.
According to Tapiero, a significant macroeconomic factor is expected to drive Bitcoin’s price to new heights, offering investors an opportunity for substantial gains. Tapiero’s bullish stance on Bitcoin’s future price trajectory revolves around a unique correlation he observed in the market.
Particularly, the expert highlighted concerns about “monetary debasement” driven by a notable 60% increase in the Treasury market over the past five years.
This factor leads Tapiero to anticipate a surge beyond $200,000 for the digital gold, Bitcoin. While acknowledging the potential for gold to perform well in such a scenario, Tapiero remains particularly bullish on Bitcoin’s prospects.
Most remarkable macro correlation break I’ve seen in some time.
Suggests extreme concern about monetary debasement driven by 60% Treasury mkt increase past 5yrs.
Theme not yet widely subscribed.
Bullish #GOLD and more so when rates drop.
Vaults #Bitcoin to 200k+
— Dan Tapiero (@DTAPCAP) April 8, 2024
In the past 24 hours, Bitcoin has exhibited bullish momentum, surpassing and reclaiming the $71,000 price level. With a 2.6% increase over the week and a 3.1% surge in the last 24 hours, Bitcoin’s upward trajectory continues to attract attention from investors and analysts alike.
Notably, the current price performance of the asset coincides with a notable event: over 600 BTC of $100,000 strike call options have recently been traded in a Block trade. This significant development, as illuminated by Greek Live, carries a notional value of up to $45 million, with $8.5 million worth of premiums alone.
Greeks Live further reported that this occurrence has propelled the entire market into a prolonged bullish momentum. In addition, with the halving event on the horizon, the prospect of reaching new all-time highs, including the milestone of $100,000, appears to be within reach.
Bitcoin broke through the $70,000 zone without warning, one step away from a new all-time high.
The rapid rise has driven all major term IVs up significantly, with BTC Dvol now over 78%, and market sentiment has quickly reversed to a long atmosphere.
More than 600 BTC of $100,000… pic.twitter.com/JY9QXyzGMi— Greeks.live (@GreeksLive) April 8, 2024
Echoing Tapiero’s optimism, analyst Michael Van De Poppe has also recently emphasized Bitcoin’s potential for unprecedented growth.
According to Van De Poppe, despite encountering resistance, Bitcoin’s ability to break through key levels could pave the way for a surge towards new all-time highs, with projections reaching as high as $300,000 in the current bull run.
Featured image from Unsplash, Chart from TradingView
Over the past week, Bitcoin (BTC) has struggled to move significantly to the upside as the leading cryptocurrency has entered a consolidation phase below the $69,000 mark.
This subdued volatility departs from Bitcoin’s usual fluctuations, raising speculation about a potential stagnation phase in its market trajectory.
The cryptocurrency community has closely monitored Bitcoin’s movements, especially as it approaches crucial resistance levels. Insights from prominent crypto analyst Captain Faibik shed light on Bitcoin’s current outlook.
Captain Faibik suggests that Bitcoin could be on the brink of a significant breakout, contingent upon surpassing the $70,000 resistance threshold. According to the crypto analyst, the BTC “Bulls must Clear the $70,000 Resistance area to Confirm the upside Breakout.”
$BTC is Bouncing back Nicely but still Consolidating within the Triangle.
Bulls must Clear the 70k Resistance area to Confirm the upside Breakout.#Crypto #Bitcoin #BTC pic.twitter.com/NxAz8Y1ktq
— Captain Faibik (@CryptoFaibik) April 5, 2024
Another crypto analyst, Jelle, Echoes similar sentiments and emphasizes the importance of patience among investors, particularly with the impending Bitcoin halving event on the horizon.
Notably, the Halving is a pre-programmed event built into the Bitcoin protocol that occurs approximately every four years within the Bitcoin network to reduce the reward for mining new BTC blocks.
Despite Bitcoin’s recent consolidation, anticipation for a potential rally above the $70,000 mark continues to build within the crypto community, especially as the halving is now less than 20 days away. This is because the halving ultimately decreases the supply of new BTC, and reduced supply often leads to increased demand and speculative buying.
Jelle’s analysis underscores the historical precedent of Bitcoin’s price movements, noting that previous all-time highs were often preceded by periods of consolidation and uncertainty.
Drawing attention to bullish indicators such as the pennant formation and strong support levels, Jelle predicts a breakout in the coming weeks, providing hope for investors seeking upward momentum in Bitcoin’s price trajectory.
While #Bitcoin did not break $69,000 in one go, it looks like it’s forming a new higher low here.
Hold $66,500, and we’ll be at $69k again soon.
Be patient – the halving is approaching fast. pic.twitter.com/LgMjodV4mF
— Jelle (@CryptoJelleNL) April 5, 2024
Meanwhile, current market data indicates a favorable environment for retail traders, with Glassnode reporting increased Bitcoin accumulation by short-term holders since December 2023.
This trend suggests growing confidence among retail investors in Bitcoin’s long-term potential, further fuelling expectations for a potential rally beyond $70,000.
Featured image from Unsplash, Chart from TradingView
Renowned venture capitalist and Bitcoin advocate Anthony Pompliano has recently sparked discussions with his post on X addressing the predictions of Bank of America.
According to Pompliano’s post, the US government may face a $1.6 trillion annual interest payment by December, should the Federal Reserve persist with its current monetary policies.
This projection has ignited speculation among market observers, with suggestions pointing to a scenario that heralded inflation in the US economy.
Notably, Bitcoin is emerging as a focal point in discussions, touted by some as a potential hedge against inflation and a contender for the future standard of currency if the US dollar falters.
Time for the FED to cut interest rates and let inflation explode higher.
OR
Leave interest rates high and allow annual interest payments to be insanely high thus causing inflation to explode higher.
I will keep stacking #Bitcoin to hedge against this mess.
— Not Larry Fink (@NotLarryFink) April 1, 2024
Meanwhile, during a recent feature on CNBC’s Squawk Box, Anthony Pompliano delved into the multifaceted nature of Bitcoin’s role in the financial landscape. He highlighted the varied perceptions of Bitcoin among different market participants, ranging from a “speculative asset” to a “hedge against inflation and store of value.”
Pompliano underscored the distinction between investors seeking short-term gains through spot Bitcoin exchange-traded funds (ETFs) and those adopting Bitcoin as a long-term hedge against inflation.
Bitcoin provides hope & protection for anyone.
The US dollar has lost 25% of its purchasing power in 4 years, while bitcoin has gained over 800%.
We are watching a global store of value be adopted.
Here is my full segment on @SquawkCNBC this morning. pic.twitter.com/XvO0B4yE0o
— Pomp
(@APompliano) April 1, 2024
Drawing on global examples, Pompliano elucidated how individuals in different regions, such as Nigeria and Argentina, are leveraging on buying BTC and stablecoins, respectively, reflecting diverse strategies in response to economic circumstances.
Pompliano noted:
You don’t have to go to emerging market to find out why people want to buy this. If you look at the United States Dollar it has lost 20% of its purchasing power since 2020, Bitcoin is up 800% during that same time period.
It is worth noting that despite recent market volatility, characterized by Bitcoin’s notable decline over the past week, Pompliano’s remarks shed light on Bitcoin’s resilience and potential for future growth.
Notably, Bitcoin has experienced a significant pullback, losing nearly 10% of its value over the week and further declining by 6% in the past 24 hours alone. Its current market price hovers around $65,234.
Market analysts attribute this downturn to diminishing expectations of Federal Reserve interventions and waning demand for spot Bitcoin ETFs, as highlighted in a Bloomberg report.
Stefan von Haenisch, who serves as the Head of Trading at OSL SG Pte., remarked on the prevailing pessimism regarding potential rate cuts, stating that it has significantly impacted the crypto space. He noted a sell-off occurring as the week commenced, affecting various sectors, particularly those with better performance than Bitcoin over the last six months, such as meme-based cryptocurrencies.
Featured image from Unsplash, Chart from TradingView
As the crypto market braces for the upcoming Bitcoin (BTC) halving in April 2024, the discussion surrounding Bitcoin’s price trajectory has continued to gain momentum. Particularly, Michaël van de Poppe, a well-regarded figure in the crypto analysis domain, has shared his latest analysis on Bitcoin.
In a post shared on X, Van de Poppe suggests that Bitcoin is on the cusp of a notable rise, eyeing a target range between $75,000 to $80,000 in the lead-up to the halving event.
This prediction is based on the current consolidation phase of Bitcoin, indicating a buildup toward testing its all-time high with the potential for a subsequent correction.
#Bitcoin consolidating.
I think that we’re close to the peak of this run, but I think we’ll have another ATH test, perhaps even $75-80K pre-halving and then we’re correcting.
During that consolidation / correction phase, I expect altcoins to outperform. pic.twitter.com/bnQjYuIzrr
— Michaël van de Poppe (@CryptoMichNL) March 27, 2024
Notably, Bitcoin halving plays a crucial role in this scenario, serving as a pivotal event that historically influences Bitcoin’s market dynamics.
The halving, scheduled to occur in April 2024, will see the reward for mining new blocks halved, thereby reducing the rate at which new BTC are created and entering the market.
This event, occurring approximately every four years, is anticipated to create scarcity, pushing the demand and possibly the price higher than past patterns have suggested.
In addition to Van de Poppe’s predictions, other analysts have shared their optimistic outlooks regarding Bitcoin’s potential price movement. Jelle, another esteemed crypto analyst, posits that Bitcoin is poised for a significant leap, potentially breaching the $100,000 mark sooner than expected.
This bullish sentiment is also echoed by Doctor Profit, who highlights the importance of understanding Bitcoin’s current market behavior, including its recent sideways movement. He identifies this movement as an accumulation phase poised to catalyze a surge past the $80,000 mark, aiming for $100,000.
#Bitcoin – What’s Next?
The big Sunday report, all you need to know:
TA/LCA/Psychological Analysis: In last week’s Sunday report, we discussed an anticipated sideways movement in the larger timeframe. As observed, Bitcoin is perfectly moving in this sideways region as… pic.twitter.com/BhE5Weycxv
— Doctor Profit
(@DrProfitCrypto) March 24, 2024
The significance of accumulation in this context cannot be overstated. As recently reported by NewsBTC, there is an increase in the number of addresses holding at least 1,000 BTC, suggesting that institutions and large-scale investors are gearing up for what may come post-halving.
However, despite this accumulation, Bitcoin over the past 24 hours has declined by nearly 2%, with a current market price below $70,000.
Featured image from Unsplash, Chart from Tradingview
Amid a recent downturn in the broader crypto market, the concept of “buying the dip” has once again surfaced, tempting traders and investors with the prospect of snagging assets at lower prices. However, caution is the watchword from Markus Thielen, CEO of 10x Research, a top analyst in the crypto space.
Thielen’s latest advisories suggest that the current market conditions may not yet be ripe for the optimistic strategy of dip purchasing.
Thielen’s recent analysis, released earlier today, underscores a bearish outlook on flagship cryptocurrencies Bitcoin (BTC) and Ethereum (ETH), advising that it may be premature to buy the dip.
This guidance is rooted in a comprehensive approach to market analysis, combining analog models, data-driven predictive models, and objective analysis.

At the heart of Thielen’s cautionary stance is a detailed report outlining the factors contributing to the firm, 10x Research’ bearish outlook on Bitcoin and Ethereum.
Despite a seemingly attractive price point for these cryptocurrencies, Thielen believes the market has not yet bottomed out, suggesting further declines before any significant rally.
The report pinpoints $63,000 and $60,000 as critical support levels for Bitcoin. A breach below $60,000, Thielen warns, could precipitate a fall into the $52,000-$54,000 range.
Yet, despite these short-term bearish indicators, Thielen remains optimistic about Bitcoin’s potential, envisioning a climb to heights of over $100,000 within the year. Thielen noted:
Buying this dip is still too early. Technically, we still expect Bitcoin to trade below 60,000 before a more meaningful rally attempt is started. Based on the previous new high signals, we could paint a rosy picture of 83,000 and 102,000 upside targets, but for the time being, we are more focused on managing the downside.
The current state of the crypto market reflects a tense anticipation of the upcoming central bank announcements from the US Federal Reserve.
This decision is expected to significantly influence monetary policy and, by extension, the cryptocurrency market. Particularly, insights from crypto futures exchange Blofin suggest that the outcome of this announcement could sway market sentiment substantially.
Meanwhile, the market reacts in real-time, with Bitcoin slightly increasing 2.4% in the past 24 hours but still showing a notable decline over the past week. Adding to the complexity of the market dynamics are observations from Alex Krüger, a respected figure in macroeconomics and cryptoanalysis.
Krüger attributes the recent price collapse to several factors, including market over-leverage, the negative sentiment ripple from Ethereum, and speculative fervor around certain altcoins. These elements combine to paint a picture of a market at a crossroads, with significant volatility and uncertainty ahead.
Reasons for the crash, in order of importance
(for those who need them)
#1 Too much leverage (funding matters)
#2 ETH driving market south (market decided ETF not passing)
#3 Negative BTC ETF inflows (careful, data is T+1)
#4 Solana shitcoin mania (it went too far)— Alex Krüger (@krugermacro) March 20, 2024
Featured image from Unsplash, Chart from TradingView
A recent report from CryptoQuant has sparked discussions, suggesting that a Bitcoin spot exchange-traded fund (ETF) approval by the US Securities and Exchange Commission (SEC) could lead to a significant market event.
This possibility arises amid the Bitcoin (BTC) price stabilizing above $40,000, leaving many market participants sitting on substantial unrealized profits.
The report by CryptoQuant particularly posits that this scenario could trigger a “sell the news” event, historically linked to market corrections.
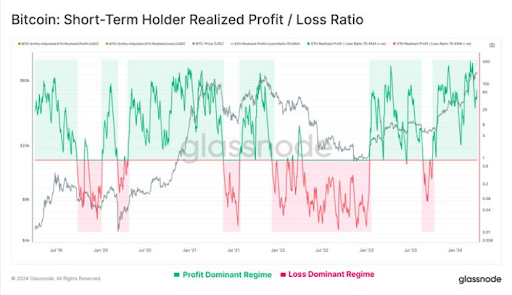
CryptoQuant’s analysis points to the current state of Bitcoin holders as a reason for the possible drop in BTC price when the approval of spot Bitcoin ETF happens.
Particularly the short-term ones, experiencing unrealized profit margins of around 30%. According to CryptoQuant, such high-profit levels have often preceded price drops.
Additionally, the report notes an uptick in selling activity from Bitcoin miners, adding to the potential sell pressure on BTC. This, combined with the market’s anticipation of a spot Bitcoin ETF approval, could create a volatile environment, as highlighted by CryptoQuant.

Based on CryptoQuant’s analysis, during downturns within bullish markets, Bitcoin’s value often falls back to the level where short-term investors have historically realized their prices.
Considering this, the report suggests that in a scenario where “sell the news” occurs, Bitcoin’s value might see a downturn, with a possible dip to around “$32,000.”
The conversation around a Bitcoin spot ETF’s potential approval is not one-sided. Several analysts predict a positive outcome, with firms like Matrixport and prominent analysts like Michael van de Poppe suggesting that the approval could catapult Bitcoin’s price to new highs.
Matrixport anticipates that the approval of Bitcoin spot ETFs by the US SEC could drive BTC’s value to around $50,000 in early 2024. Van de Poppe echoes this sentiment, foreseeing a potential rise to the $47,000-$50,000 range.
#Bitcoin did test the lows, didn’t take the liquidity beneath the lows.
Anyway, correction seems over and pre-ETF we’re likely to test $47-50K.
Buy the dips. pic.twitter.com/Ar4mqvYRjJ
— Michaël van de Poppe (@CryptoMichNL) December 19, 2023
Additionally, while CryptoQuant predicts a possible drop to $32,000, other analysts’ prediction of BTC bottom doesn’t go that low. Analyst Ali, for instance, has highlighted a robust support zone between $37,150 and $38,360.
In case of a deeper correction, #Bitcoin finds solid support between $37,150 and $38,360. This zone is backed by 1.52 million addresses holding 534,000 $BTC.
Also, watch out for two resistance walls that could keep the #BTC uptrend at bay: one at $43,850 and another at $46,400. pic.twitter.com/NGm1XpMOLf
— Ali (@ali_charts) December 11, 2023
This range is reinforced by the activities of approximately 1.52 million addresses holding about 534,000 BTC. Notably, such a strong foundation of support might mitigate the risks of a drastic price fall even if a “sell the news” event were to occur following the spot ETF approval.
Featured image from Unsplash, Chart from TradingView

Bitcoin is likely to reach $1 million quickly due to a “torrent of money” coming from institutional investors in 2024, according to the JAN3 CEO.
The crypto market, especially Bitcoin (BTC), has recently declined. Amid these fluctuations, the flagship cryptocurrency has been intensely scrutinized.
Despite its decline from the recent peak of $44,000, a crypto analyst urged the community not to “succumb to panic.” The current market situation reflects a typical correction phase rather than a long-term bearish trend.
According to Ali Charts, a prominent crypto analyst, Bitcoin has established a “robust” support zone between $37,150 and $38,360. This critical range is bolstered by the activity of approximately 1.52 million addresses that collectively purchased roughly 534,000 BTC at that price point, as indicated by Ali.
The analyst suggests that the significant accumulation forms a “strong” foundation, potentially preventing further declines in Bitcoin’s value.
Despite the recent market downturn, Bitcoin’s potential for recovery and continued growth remains a subject of interest. Ali has also identified two key resistance levels at $43,850 and $46,400 that could challenge Bitcoin’s upward momentum.
These points represent significant thresholds where selling pressure may intensify, potentially hindering Bitcoin’s ability to reclaim its recent highs.
In case of a deeper correction, #Bitcoin finds solid support between $37,150 and $38,360. This zone is backed by 1.52 million addresses holding 534,000 $BTC.
Also, watch out for two resistance walls that could keep the #BTC uptrend at bay: one at $43,850 and another at $46,400. pic.twitter.com/NGm1XpMOLf
— Ali (@ali_charts) December 11, 2023
Meanwhile, the past 24 hours have seen Bitcoin’s price dip by 0.3% with a price below $42,000, continuing its retreat from the $44,000 mark. This reduction in value is mirrored in the crypto’s trading volume, which has fallen from $37 billion to $21 billion. This decline indicates a decreased trading activity, suggesting a cooling-off period following the recent market rally.
Amid concerns over Bitcoin’s price fluctuations, experts like William Clemente, co-founder of Reflexivity Research, offer a different perspective. Clemente emphasizes that the current pullback, potentially bringing Bitcoin’s price to around $40,000, is not necessarily a negative development.
Clemente argues that this correction is essential for “shaking out weak hands” and reducing leverage in the market, ultimately laying a more solid foundation for future growth.
The Co-founder of Reflexivity Research further noted that “Bitcoin’s volatility is a feature, not a bug.”
BTC just ~doubled in 2 months with no pull backs, a correction is not that surprising.
Corrections shake out “weak hands” and leverage, allowing for a stronger foundation for eventual moves higher.
Bitcoin’s volatility is a feature, not a bug.
Chill with the leverage
https://t.co/BdvvS8KDZU
— Will (@WClementeIII) December 11, 2023
Featured image from iStock, Chart from TradingView
Controversial Stock-to-Flow (S2F) model creator PlanB has recently made a bold prediction about Bitcoin (BTC) that’s captured the crypto community’s attention.
Via his social media handle X, PlanB stated that Bitcoin’s price would never plummet below the $35,000 threshold again. PlanB supported his claim with a chart illustrating Bitcoin’s valuation trend about its intrinsic hash rate. According to PlanB, this relationship is a critical indicator of the digital currency’s enduring value.
Despite acknowledging potential black swan events or short-term market volatility, PlanB insists that based on the current fundamentals, particularly the cost of electricity ($/kWh) used in mining Bitcoin, the asset’s market value is “unlikely” to retract below the mentioned support level – $35,000.
The crux of PlanB’s argument lies in the unique arbitrage opportunity that exists between Bitcoin miners and everyday users. Miners, who invest heavily in electricity to mine the digital asset, and users, who typically purchase Bitcoin with fiat currency on exchanges, create a dynamic market environment.
According to PlanB, this arbitrage might become even more pronounced with the advent of a potential launch of a spot Bitcoin Exchange-Traded Fund (ETF) in the US.
BREAKING: Bitcoin valuation based on difficulty (hashrate) increased to $35k yesterday. IMO this could mean that, apart from possible black swans or short term volatility, based on $/kWh-arbitrage fundamentals … BTC will never go below $35k ever again. pic.twitter.com/JPLkXieQAP
— PlanB (@100trillionUSD) November 27, 2023
PlanB suggests that miners, equipped with specialized knowledge about the market and the actual cost of producing Bitcoin, might begin to demand a premium when selling the cryptocurrency. This shift could fundamentally alter the way Bitcoin is traded and its perceived value.
The introduction of BTC spot ETFs, in particular, is expected to bring a new level of mainstream acceptance and investment into Bitcoin, potentially solidifying its price floor as predicted by PlanB.
Delving deeper into the concept of Bitcoin’s hash rate, it’s essential to understand its role in securing the network and validating transactions. The hash rate basically measures the computational power being used to mine and process transactions on the blockchain.
A higher hash rate indicates more robust security and efficiency in the network, often correlating with increased investor confidence and, consequently, a higher asset valuation.
PlanB’s analysis posits that Bitcoin’s valuation will follow suit as the hash rate continues to rise, driven by technological advancements and increased mining activities. This relationship forms the basis of his prediction that Bitcoin will maintain a strong market position, unlikely to fall below the $35,000 mark.
Currently, BTC is trading above $37,000, marking an increase of over $2,000 from the support level PlanB mentioned. Specifically, at the time of writing, Bitcoin’s price stands at $37,605, reflecting a 2% rise in the last 24 hours.
Featured image from Unsplash, Chart from TradingView