Bitcoin Plunges To $26,000 As Miners Sell Big

Bitcoin has plunged towards the $26,000 level as on-chain data shows the Bitcoin mines have been participating in a selloff.

Bitcoin Miner To Exchange Flow Has Spiked During The Past Day

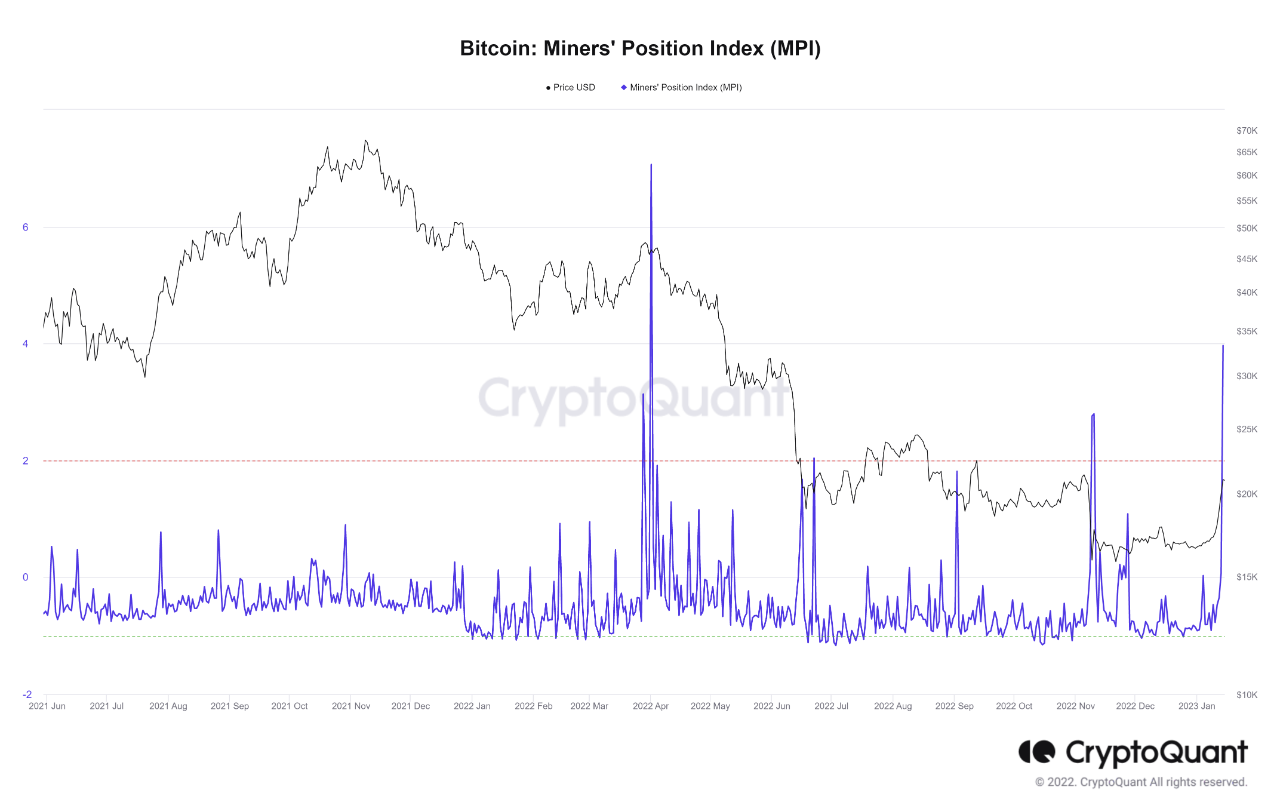
As pointed out by an analyst in a CryptoQuant post, the miners have been showing signs of selling recently. The relevant indicator here is the “miner to exchange flow,” which keeps track of the total amount of Bitcoin that miners are depositing to exchanges.

Generally, these chain validators only make such transactions when they intend to sell, so the indicator’s value observing a spike can be a sign of a selloff.

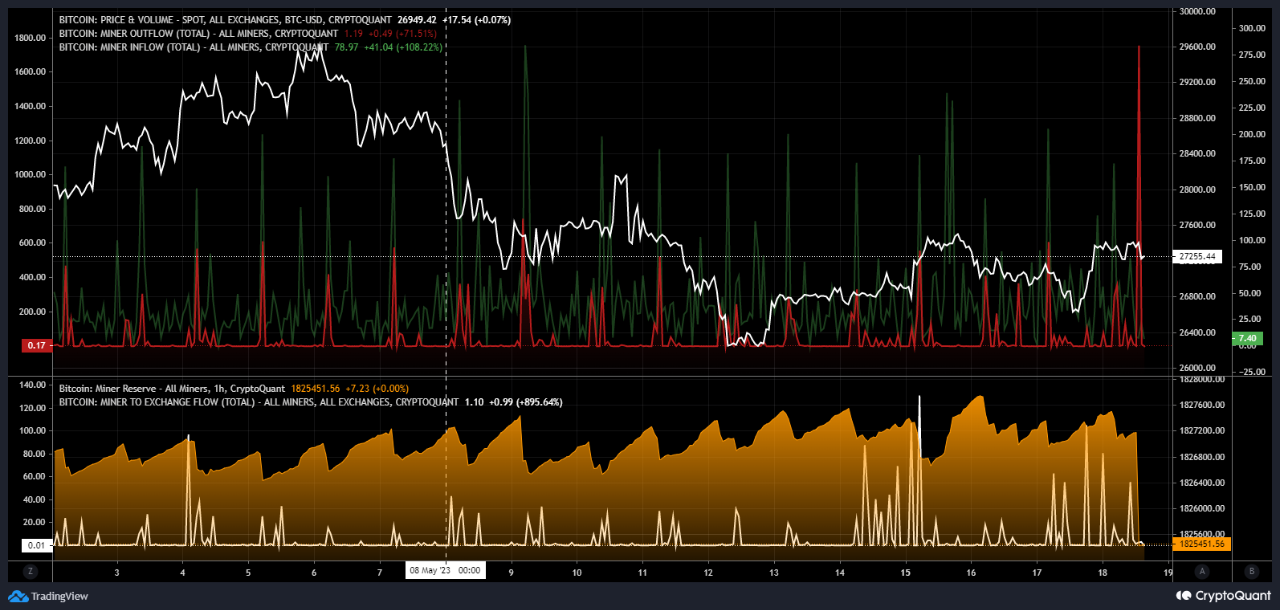
The below chart shows the trend in the 7-day moving average (MA) BTC miner to exchange flow over the past couple of weeks:

Bitcoin Miner To Exchange Flow

As displayed in the graph, the 7-day MA Bitcoin miner to exchange flow has seen a huge spike during the past day. The quant has also highlighted the previous instances of high values of the indicator that occurred in the past two weeks.

It would appear that the BTC price has generally registered a drawdown whenever the miners make large deposits to these platforms. With the latest spike in the metric, too, the cryptocurrency has taken a plunge, as its price has now returned back to the $26,000 level, completely erasing the recovery that the Grayscale rally had brought.

It’s never a certainty that the deposits that these holders are making are indeed for selling, but given the timing of the price drawdown, it would appear likely that the miners were looking to sell after all.

In the chart, the analyst has also attached the data for a few more metrics. First, there are the “miner inflow” and “miner outflow” indicators, which, as their name suggests, measure the amount of Bitcoin that the miners are transferring into and out of their wallets, respectively.

From the graph, it’s visible that the BTC miner outflow spiked during the crash, which makes sense as the miners had made some transfers from their wallets toward exchanges.

The miner inflow, however, had also registered high values at the same time, meaning that fresh coins had entered back into the wallets of these chain validators.

This would suggest that some of the miners may have used the opportunity of the crash to expand their holdings. The “miner reserve,” the other metric of interest here, measures the total amount of Bitcoin that this cohort is carrying in its wallets right now and this indicator’s data would confirm that the holdings of the miners have actually gone up during the price drop.

So, while some Bitcoin miners may have contributed to the selling pressure, others have more than made up for it by accumulating more of the cryptocurrency.
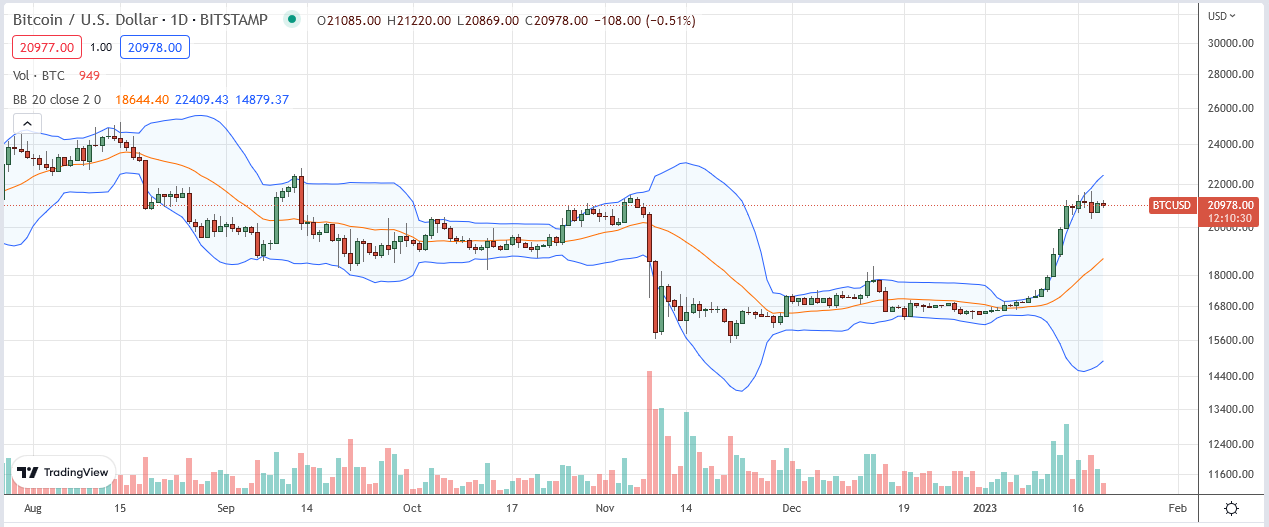
BTC Price

As mentioned before, Bitcoin has now seen a complete retrace of the returns from the latest rally, bringing the asset back to the $26,000 level it had previously been consolidating at.Bitcoin Price Chart

Another Bitcoin Metric Is About To Reach A New All-Time High Despite The Bear Market

The price of Bitcoin has taken a beating in the past month. The leading cryptocurrency by market cap is down by more than 11% from its price in July and has lost more than $50 billion in market cap since then. 

While the price plunge has been painful for investors, Bitcoin miners have also been feeling the sting as mining revenue per computing power has been dwindling for the past few months. On the other hand, Bitcoin’s hashrate has soared to high levels as mining farms continue to come online.

Bitcoin Hashrate Reaches All-Time Highs Despite Bear Market

Over the last year, Bitcoin’s hashrate (the total combined computing power of miners) has almost doubled. Data from Blockchain.com shows that the Bitcoin network hash rate surpassed 414 terahashes per second (TH/s) for the first time on August 16. 

This metric has since retraced to 390 TH/s, but it is expected to rise further in the coming weeks as miners bring on more computing power to break even on their mining operations. The higher the hashrate, the more difficult it becomes to mine BTC and earn rewards. This means that miners are now making less BTC per terahash of computing power than ever before. 

Data from Hashrate Index shows this figure is now at $0.06016 per terahash/second per day. In comparison, this figure was at $0.08124 on May 8 during the rise of Bitcoin Ordinals and Inscriptions. A further decline from here would see mining revenue fall below the lowest point in November 2022.

How Miners Are Adapting To Stay Profitable

The Bitcoin mining industry has proven itself resilient, even during the depths of the crypto winter. According to data from investment information platform MacroMicro, the current average cost to mine a BTC stands at $45,877 with the current price of BTC now at $25,936. 

Bitcoin price cap chart from Tradingview.com (Metric)

To remain profitable with the rising hash rate, Bitcoin miners have had to adjust their operations. Publicly traded mining companies like Marathon Digital and Riot Platforms have had to raise about $440 million through stock sales. 

Bitcoin miners have also avoided selling their $900 million BTC, as it could trigger a major selloff from investors. While previous on-chain data have shown miners sending a significant amount of coins to exchanges, miners have been expanding their reserves recently. 

BTC Mining Outlook

The outlook for Bitcoin mining economics in the coming months is uncertain but potentially promising if the hashrate continues to increase. The next Bitcoin halving is expected to take place in April 2024, slashing block reward by 50%. 

When the halving occurs, things could even get tighter for miners, as they would have to increase mine more blocks to break even. Nevertheless, big BTC mining companies are already on track for this adjustment. Marathon Digital, for example, was able to achieve a 54% boost in its hashrate during the second quarter but reported a net loss of $21.3 million.

Bitcoin Miners Show Accumulation Again, Bullish Sign?

On-chain data shows that Bitcoin miners have been expanding their reserves recently, a sign that could be bullish for the asset’s price.

Bitcoin Miner Reserve Has Been Trending Up Recently

As pointed out by an analyst in a CryptoQuant post, BTC miners have been accumulating during the past 48 days. The indicator of interest here is the “miner reserve,” which measures the total amount of Bitcoin that all miners are holding in their wallets right now.

Related Reading: These Bitcoin Metrics Are At Important Retests, Will Bullish Trend Prevail?

When the value of this metric goes down, it means that the miners are withdrawing coins from their wallets currently. Generally, these chain validators only transfer coins out of their reserve whenever they want to sell them, so this kind of trend can have bearish implications for the price.

On the other hand, the indicator increasing in value implies the miners are adding a net amount of BTC to their wallets. Such a trend can be a sign that these investors are accumulating at the moment, and hence, can be bullish for the cryptocurrency.

Now, here is a chart that shows the trend in the Bitcoin miner reserve over the last couple of months:

Bitcoin Miner Reserve

As shown in the above graph, the Bitcoin miner reserve had observed a large rise back in May, but soon after this increase, this cohort started selling as the asset’s price continued to show struggle.

After the rally had taken place in June, however, the indicator’s value had stabilized, meaning that these investors were selling the same amount as they were adding to their holdings.

In the last few weeks, this sideways trend has slowly turned into an uptrend, as the miners have been gradually expanding their reserves. In the past 48 days, these chain validators have added a total of around 4,060 BTC to their holdings.

This amount is worth around $118 million at the current exchange rate, which isn’t a ton given the scale of the total miner reserve, but it’s still nonetheless a positive sign that the miners have been accumulating despite the cryptocurrency’s price observing some decline recently.

A notable portion of this latest accumulation by the miners has come from one mining pool, AntPool, as the below chart displays.

Bitcoin Antpool Reserve

In the past 52 days, the AntPool Bitcoin mining pool has added a total of about 1,020 BTC to their reserves, which is more than 25% of the total accumulation that all the miners have participated in during this period.

The quant has also attached the data for the exchange flows (as well the normal outflows/inflow) for this mining pool. Earlier, there was some concern around the market that these miners may have been selling as they were depositing to exchanges, but as it turned out, this cohort was merely transferring their coins back and forth from these platforms.

BTC Price

At the time of writing, Bitcoin is trading around $29,100, up 1% in the last week.

Bitcoin Price Chart

Bitcoin Plunges Below $27,000 As Miners Show Signs Of Selling

Bitcoin has now dipped below the $27,000 level as on-chain data shows the miners have possibly been selling the asset recently.

Bitcoin Miner Reserve Has Taken A Sharp Plummet Recently

As pointed out by an analyst in a CryptoQuant post, miners have taken out about 1,750 BTC from their wallets during the past day. The relevant indicator here is the “miner outflow,” which measures the total amount of Bitcoin that miners are transferring out of their wallets currently.

The counterpart metric of the outflow is called the “inflow,” and it naturally tracks the total number of coins going into the addresses of these blockchain validators.

Here is a chart that shows the trend in the Bitcoin miner outflow, as well as the inflow, over the last few weeks:

Bitcoin Miner Outflow

Whenever the miner inflow has a high value, it means that this cohort is depositing a large amount of Bitcoin into their wallets. Such a trend, when prolonged, can be a sign that the miners are accumulating right now. Naturally, this can have bullish implications for the price.

When the outflow is high, on the other hand, it suggests that a large amount of the asset is exiting from the supply of the miners. Generally, the main reason why these holders transfer their coins out of their wallets is for selling-related purposes, so this kind of trend can be bearish for the cryptocurrency’s value.

In the above graph, it’s visible that the miner inflow has been at relatively low values during the past day, implying that these investors aren’t depositing any significant amounts to their wallets.

The miner outflow, however, has registered a pretty high spike in the same period. In total, around 1,750 BTC ($47 million) has exited the supply of the miners with this surge in the indicator.

Since there haven’t been any inflows to counteract these outflows, a net amount of the asset has now left the miners’ wallets. This would mean that if the outflows were made for selling purposes, a net bearish effect should appear on the price.

An indicator that helps better identify whether these transfers were for selling or not is the “miner to exchange flow,” which tracks only the miner outflows heading towards centralized exchanges.

Usually, this cohort uses the exchanges when they want to take part in distribution. As shown in the above chart, however, the metric has remained low recently, meaning that these outflows haven’t directly entered into the wallets of these platforms.

Though, the quant has discovered that the destination wallet of the 1,750 miner outflow made another transfer, which was indeed towards an exchange. “There is a high probability that 1,750 BTC ultimately went to Binance,” explains the analyst.

When these outflows took place yesterday, Bitcoin was above the $27,000 level. Following them, however, the asset has observed a plunge and is now below this mark, suggesting that this latest selling pressure from the miners may have been behind the decline.

BTC Price

At the time of writing, Bitcoin is trading around $26,800, up 2% in the last week.

Bitcoin Price Chart

Bitcoin Miners Continue To Sell, Bearish Sign?

On-chain data shows that Bitcoin miners have continued to sell recently, something that could be bearish for the cryptocurrency’s price.

Bitcoin Miners Have Been Shedding Their Reserves Recently

As pointed out by an analyst in a CryptoQuant post, there has been some intense pressure from miners in recent days. The relevant indicator here is the “miner reserve,” which measures the total amount of Bitcoin that’s currently sitting in the wallets of all miners.

When the value of this metric goes up, it means the miners are depositing a net amount of coins into their addresses right now. Such a trend can be a sign that these chain validators are accumulating currently, and hence, can have bullish consequences for the asset’s value.

On the other hand, the indicator’s value going down implies that these investors are transferring some BTC out of their wallets at the moment. As the miners generally only withdraw their coins whenever they want to sell them, this kind of trend can be bearish for the price of the cryptocurrency.

Now, in the context of the current discussion, the actual metric of interest is the 14-day rate of change (ROC) of the Bitcoin miner reserve, which tells us about the pace at which the indicator is registering fluctuations, as well as the direction these fluctuations are in (negative or positive).

Here is a chart that shows the trend in the 14-day ROC BTC miner reserves over the last few months:

Bitcoin Miner Reserve

As shown in the above graph, the 14-day ROC of the Bitcoin miner reserve has had a negative value during the last few days. This means that the holdings of these chain validators have been decreasing in this period.

Not too long ago, though, the indicator had some positive values, implying that these chain validators had been buying. Things changed once the asset’s price started to slip below the $30,000 level, however.

When the price hit around $28,000, the turn towards red values came for the indicator, implying that the miners may have possibly joined in on the market-wide selloff.

Following the selling spree from the miners, the asset’s value continued its decline and dropped all the way to the low $26,000 level. Since then, however, the decline has stopped, possibly suggesting that those levels may have offered the local bottom for the asset.

The selling pressure from the miners has also started slowing down recently, as the latest negative spike of the metric has been lesser in scale than the previous ones, which can be seen in the chart.

During the past day, the asset’s price has also bounced back above the $27,000 level again, implying that the market may now be able to absorb the current levels of selling pressure from this cohort.

This kind of trend had also been seen during the selloff back in March, where the price formed a bottom and then rebounded up as the selling pressure died out from the miners.

It now remains to be seen whether the miners will decrease their selling in the next few days (like back in March), or if they will continue to sell, possibly causing more bearish price action for the asset.

BTC Price

At the time of writing, Bitcoin is trading around $27,300, down 2% in the last week.

Bitcoin Price Chart

Bitcoin Bearish Signal: Miners Continue To Sell

On-chain data shows that Bitcoin miners have continued to sell recently, a sign that can be bearish for the price of the cryptocurrency.

Bitcoin Miner Reserve Has Been Going Down Since Rally Started

As an analyst in a CryptoQuant post pointed out, BTC miners have continued to shave coins off their reserve recently. The “miner reserve” is an indicator that measures the total amount of Bitcoin that all miners are holding in their wallets currently.

Related Reading: Bitcoin Emerges As the King Of Assets,10X Growth Over Gold During US Banking Crisis

When the value of this metric goes up, it means the miners are depositing a net number of coins into their wallets. This trend suggests these blockchain validators are accumulating the cryptocurrency. As miners are often a source of selling pressure in the market, their holding on and adding to their supply can be bullish for the price.

On the other hand, a decreasing value in this indicator implies that miners are transferring some BTC out of their reserve. Since one of the main reasons why these investors may withdraw from their wallets is for selling-related purposes, such a trend can have bearish consequences for the asset’s value.

Now, here is a chart that shows the trend in the Bitcoin miner reserve over the past year:

Bitcoin Miner Reserve

The above graph shows that the Bitcoin miner reserve saw a sharp plunge just as the rally began in January, suggesting that these investors sold to take advantage of the profit-taking opportunity. The drawdown in the metric was also quite sharp in this case and surpassed the levels seen during the FTX crash last November.

The miner reserve has only moved sideways or down since this selloff, suggesting that these holders haven’t participated in any accumulation in recent months; they have only been looking at chances to exit.

Recently, when Bitcoin plunged from the $30,000 mark, the indicator again saw a sharp leg down, meaning that this cohort was again selling their BTC.

The drawdown in the indicator has also continued through the volatile price action observed in the last few days, suggesting that the BTC miners are still disposing of their coins.

Though these investors may have been selling a net amount of coins recently, the actual scale of their selling isn’t that significant compared to their total reserve (they currently hold upwards of 1.82 million BTC in their wallets).

The quant notes, however, that the miners holding onto their coins for longer periods could be one of the crucial factors for the bullish trend’s health.

It now remains to be seen whether these holders can reverse the trend anytime soon or if they will continue to sell Bitcoin in the short term. Either possibility is likely to have a profound effect on the BTC price.

BTC Price

At the time of writing, Bitcoin is trading around $28,100, up 3% in the last week.

Bitcoin Price Chart

What’s Behind The Recent Bitcoin Drop? Here’s What On-Chain Data Says

Bitcoin on-chain data hints that selling from the miners may have been behind the latest plunge in the asset’s price below the $28,000 mark.

Bitcoin Miners Have Shown Signs Of Selling Recently

As pointed out by an analyst in a CryptoQuant post, miners had been putting on some selling pressure on Bitcoin while the decline had happened. A relevant indicator here is the “miner netflow,” which measures the net amount of Bitcoin entering into or exiting the wallets of all miners.

When this metric has a positive value, it means a net number of coins is being transferred into the wallets of miners right now. Such a trend implies that these chain validators are accumulating currently, which is naturally something that could be bullish for the price.

On the other hand, negative values suggest miners are transferring some BTC out of their holdings at the moment. Usually, miners transfer out their coins whenever they want to sell them. Hence, negative netflow values can have bearish consequences for the asset.

Now, here is a chart that shows the trend in the 30-day simple moving average (SMA) Bitcoin miner netflow over the past week or so:

Bitcoin Miner Netflow

As displayed in the above graph, the 30-day SMA Bitcoin miner netflow registered a very sharp red spike when the cryptocurrency’s price was in the middle of its decline a few days ago.

BTC was just above $28,000 when this spike came, but the asset rapidly plummeted to the low $27,000 level following it. The timing of these large net outflows taking place from the miners may be a sign that it was this cohort’s selling that at least partially contributed to the coin’s drawdown.

The chart for the 30-day exponential moving average (EMA) Bitcoin miner reserve, a metric that measures the total amount of BTC all miners are holding right now, also shows this spike:

Bitcoin Miner Reserve

This plummet in the Bitcoin miner reserve from a few days ago naturally makes sense, as the netflow is nothing but a measure of the changes taking place in this metric. From the chart, it’s visible that while the outflows may have been sizeable, they still haven’t significantly affected this cohort’s total holdings, meaning that many miners are still sitting still on their wallets.

Nonetheless, compared to the average during the last 365 days, the current outflows are very large, as the data for the 14-day EMA Miners’ Position Index (MPI) below displays.

Bitcoin MPI

It looks like the rate at which Bitcoin miners are selling right now (proportional to the past year) is greater than what even the FTX crash back in November 2022 saw.

All these indicators suggest that this extraordinary selling pressure from these holders could be why BTC plunged to low $27,000 levels a couple of days ago, something that the coin is yet to recover.

BTC Price

At the time of writing, Bitcoin is trading around $27,300, down 8% in the last week.

Bitcoin Price Chart

Sell Pressure Mounts On Bitcoin As Miners Offload More BTC

CryptoQuant data on January 20 shows an unusually sharp spike in Bitcoin miners’ outflow, an unexpected development considering the solid performance of BTC prices in the past few trading days.

Miners’ Position Index (MPI) Rising

The Miners’ Position Index (MPI) is up from -0.85 registered on December 31, 2022, to +3.25 on January 19, 2023. The expansion could indicate that miners are moving their coins, at a faster pace, to centralized exchanges. 

Rising Miners' Position Index

The MPI is a moving ratio between the total miner outflows to the total one-year moving average of the total miner outflows. All denominations are in USD.

Per CryptoQuant’s interpretation, the higher the MPI ratio, the higher the odds that miners are sending mined coins to centralized exchanges, heightening the risks of a price plunge.

For a wholesome picture, it is recommended that the MPI be used with other metrics since there are assumptions that miners are expressly selling their coins in top exchanges like Binance, Coinbase, or even in over-the-counter (OTC) exchanges.

Nonetheless, when used with different technical indicators, MPI flows can provide a rough indicator of Bitcoin miners’ financial state. The actions of the miners may provide an indication of where the market might be headed next.

In proof-of-work networks like Bitcoin, miners are compensated with coins to secure the platform against external attacks and confirm transactions. Bitcoin distributes 6.25 BTC for every block they successfully mine. This translates to around $131,000 in BTC. A block is released roughly every 10 minutes.

Bitcoin Price Action

The price of Bitcoin explains the higher interest from miners compared to other proof-of-work networks like Litecoin. With a hash rate of 275 EH/s as of January 20, Bitcoin remains the most secure blockchain by this metric.

Bitcoin Miners Have to Sell

Miners have to expend energy and buy gear and this is why they are said to be mandatory sellers. Miners, therefore, have to move coins to crypto exchanges for cash to pay for services such as electricity or chipset manufacturers to remain competitive.

Since the Bitcoin network is transparent and all movements can be tracked, dedicated analytics’ platforms and traders often monitor their activities. Recent data points to these miners moving coins, possibly to exchanges for cash.

The spike from -0.85 to +3.25 coincides with the stalling of Bitcoin prices below $21,500. This retracement follows a sharp expansion that saw the coin power above $20,000 with increasing participation levels, as trading volumes show. 

Analysts said the revival is because of shifting macroeconomic factors, especially in the United States, and recent data shows that inflation is falling and labor conditions are firming after the effects of COVID-19.

Bitcoin Drops To $20,700 As Miner Outflows Surge

On-chain data shows the Bitcoin miner outflows have surged, suggesting that selling from this cohort may be behind the crypto’s decline to $20,700.

Bitcoin Miner Outflows Have Registered Multiple Spikes Recently

As pointed out by an analyst in a CryptoQuant post, on Wednesday, miners deposited 669 BTC to exchanges. A relevant indicator here is the “miner reserve,” which measures the total amount of Bitcoin that miners as a whole are currently holding in their wallets.

The “miner outflow” is a metric that tells us the total number of coins that these blockchain validators are transferring out of the miner reserve right now. Naturally, the reserve’s value goes down whenever the outflow records a spike, given that an equal or higher amount of the crypto doesn’t flow inside at the same time.

Generally, miners take BTC out of their reserve for selling purposes. Thus, whenever the outflow registers high values (or alternatively, the reserve observes a steep decline), it means this cohort might be participating in large amounts of selling at the moment.

Now, here is a chart that shows the trend in the Bitcoin miner outflow and miner reserve over the past couple of months:

quicktake-image

As displayed in the above graph, the Bitcoin miner outflow saw two very large spikes in the last few days. The spike on January 14 measured around 4,089 BTC, while the one on January 17 amounted to 2,500 BTC.

At the same time as these outflows, their reserves also plunged, which means that there wasn’t much incoming volume to compensate for these outflows. On Wednesday, there was also a third spike, but it was significantly smaller in scale than the other two.

However, there was still something about this outflow that’s worth paying attention to. About 669 BTC from this outflow was headed toward centralized exchanges. This can be seen in the data for the “miner to exchange flow” metric, which is also shown in the chart.

Usually, exchanges are what investors use for quickly swapping their Bitcoin in favor of altcoins or stablecoins, or for simply withdrawing to fiat. While miner outflows alone can be a sign that there is some selling going on (as these holders may just use over-the-counter (OTC) deals instead of exchanges), deposits straight to exchanges do provide more evidence that selling could be the intent behind the outflows.

While a part of the third outflow was headed toward the exchanges, the first two, larger spikes didn’t seem to have coincided with any significant deposits toward these platforms.

Nonetheless, the fact remains that following the first two outflows, the Bitcoin rally slowed down to a crawl, and after the third one (that went towards exchanges), BTC outright declined and hit $20,700. This could suggest that selling from miners may have played some part in these developments in the asset’s price.

BTC Price

At the time of writing, Bitcoin is trading around $20,700, up 14% in the last week.

Bitcoin Price Chart

Bitcoin Miners Show Signs Of Dumping, Bad For Rally?

On-chain data shows Bitcoin miners could be dumping right now, a sign that could provide an impedance to the rally.

Bitcoin Miners’ Position Index Has Shot Up Recently

As pointed out by an analyst in a CryptoQuant post, miners may be putting selling pressure on the market currently. The relevant indicator here is the “Miners’ Position Index” (MPI), which measures the ratio between the miner outflows and the 365-day moving average of the same.

The “miner outflows” refer to the total amount of Bitcoin that all these chain validators are transferring out of their wallets at the moment. Usually, miners withdraw coins from their reserves with the main purpose of selling them. Thus, a high value of the outflows can suggest that this cohort is dumping large amounts right now.

As the MPI compares these outflows with their yearly average, the metric’s value can tell us how the current miner selling is compared with the mean for the last 365 days.

When this indicator has a high value, it means miners are selling at a higher degree than usual currently, while the metric having a low value could suggest there is lesser selling pressure coming from these chain validators than the average for the past year.

Now, here is a chart that shows the trend in the Bitcoin MPI over the past year and a half:

Bitcoin MPI

As shown in the above graph, the Bitcoin MPI has spiked up recently and has hit a value of about 4, the highest level that the indicator has observed since April of last year. The metric having such a large value would suggest miners are taking out way more coins than usual, and are therefore potentially putting extraordinary selling pressure on the market currently.

From the chart, it’s apparent that spikes in the metric have usually been followed by declines in the price of the crypto. The most extreme example was back in April 2022, when the price saw a very sharp drawdown not too long after the metric recorded even higher values than now.

The last time the indicator observed high values were back during the collapse of the crypto exchange FTX when the price once again saw a rapid downward move.

Bitcoin has been busy rallying during the past week or so, touching as high as $21,000 so far, so these increased withdrawals right now would suggest miners want to take advantage of this profit-taking opportunity while they still can, and dump their coins.

If this cohort indeed intends to sell with these transfers, then the crypto’s rally could possibly find some impedance and temporarily halt here, if not outright reverse its direction.

BTC Price

At the time of writing, Bitcoin is trading around $20,800, up 20% in the last week.

Bitcoin Price Chart

Bitcoin Mining Difficulty Sees Sharp 3.59% Drop

The bitcoin mining difficulty had adjusted upward for the majority of 2022, recording its highest correction in the same year. However, 2023 kicked off with a downtrend as the mining difficulty has begun to drop. A sharp drop in this metric recorded in the early hours of Tuesday could be the start of a trend reversal in this regard.

Bitcoin Mining Difficulty Plunges

The bitcoin mining difficulty declined suddenly on Tuesday morning during Asia hours. Data from CoinWarz shows that it had fallen almost 3.6% in a sharp downward correction. This took the mining difficulty from the 35.36T that it was trending at to 34.09T following the adjustment. 

The bitcoin mining difficulty is important in the fact that it actually measures how much power is needed to verify transaction blocks on the network. The higher this figure is, the more demand it shows for the bitcoin network. And the lower it becomes, it means there are fewer miners on the network.

One factor that has had a profound effect on the mining difficulty in the last month was the blizzard that blew through the United States. As temperatures dropped dangerously low in some places, miners had to disconnect their machines to free up the energy grid. This was in a bid to leave enough energy for citizens to power their homes.

Bitcoin price chart from TradingView.com

Impact Of This On BTC

The bitcoin price is still stalling despite the sharp downward correction in the mining difficulty. The digital asset is still trending in the mid-$16,000s and has refused to budge. Even the return of some momentum with the new year has not been enough to trigger a movement beyond this point.

So when looking at the broader picture with the difficulty adjustment and price, it does not look like there would be any profound effect on price. Also, miners are still seeing similar profitability in their mining operations, so there is no tipping of the scale toward sell-offs or holding.

As long as the price continues to hold up above the $16,600 level, there should be no downtrend in price. Although if it does break below this support, then $16,000 is more likely than $17,000 in the short term. Also, add in the fact that there are multiple events such as the DCG and Gemini debacle unfolding over the next month, and it becomes imperative for the cryptocurrency to hold support. 

Bitcoin was changing hands at a price of $16,700 at the time of this writing. It remains the largest cryptocurrency in the sector with a market cap of $322 billion.

Most Public Crypto Firms Underperformed Bitcoin In 2022, Miners Hit Worst

Data shows almost all the big public crypto companies have underperformed Bitcoin this year, with the mining firms taking an especially hard hit.

Most Public Mining Companies Saw Drawdowns Of 90% Or More In 2022

As per the year-end report from Arcane Research, 2022 was a very challenging year for public firms in the crypto sector. The below chart displays the drawdowns in the valuations of some of the big players in the market, as well as that of Bitcoin, during the last twelve months:

Crypto Firms And Bitcoin Miners

As the graph shows, Bitcoin performed terribly this year, seeing negative returns of around 65%, but the large public crypto firms have done worse still. Even Microstrategy, the company whose stocks’ main attraction is exposure to BTC through its large reserves, couldn’t perform comparably to the asset and observed a deeper year-to-date drawdown of about 74%.

The market cap of the popular crypto exchange Coinbase has gone down by 87% this year, which has led to the firm being valued lower than meme coin Dogecoin. The worst performer in the list seems to have been Core Scientific, recording a drawdown of 99%. Core Scientific is one of the biggest Bitcoin mining companies, but due to these large losses, the firm had to file for Chapter 11 bankruptcy earlier in the month.

Similarly to Core, other BTC miners have also sustained major drawdowns this year, with most of them being 90% or more underwater for the period. But why did the mining firms perform especially poorly? The explanation behind that is multifold.

“Similar to how crypto lenders were incentivized to prioritize short-term growth over long-term sound business decisions to attract private capital, public miners were incentivized to take on debt and rapidly expand its hashrate share to attract more capital,” the report explains.

But three factors meant that this bet from these companies couldn’t pan out. First, the interest rates kept rising this year. Second, the bear market meant that the price of Bitcoin kept plunging, leading to the value of miners’ rewards also becoming lower.

And finally, the third nail in the coffin was the rising energy prices, which resulted in very low or no profits for miners as they have to constantly pay electricity bills to keep their facilities running. All these factors lead to the public miners collapsing under the weight of their short-sighted decisions.

For 2023, Arcane Research’s prediction for these public crypto companies is that there will be new Chapter 11 bankruptcies filed in the year.

BTC Price

At the time of writing, Bitcoin is trading around $16,500, down 2% in the last week.

Bitcoin Price Chart

Why The Bitcoin Mining Hashrate May Not Be Out Of The Woods Just Yet

The bitcoin mining hashrate took a sharp nosedive as a historical storm tore through multiple US states. This saw power grids consolidate power to be able to provide enough energy for residents to heat their homes and some mining operations had to wind down to free up more of the electrical. There has been an increase in the hashrate since then but the worst may not be over yet.

Bitcoin Hashrate Takes A Beating

Electricity grids across the United States came under immense pressure as the country recorded one of its coldest winters yet. Temperatures dropped drastically across various states and the electricity grid was stretched thin to provide enough energy to heat homes. As a result, a number of bitcoin miners decided to pause their operations to free up some energy and this affected the hashrate contributed by the country.

By Christmas Day, the global hashrate had tanked almost 40%, dropping from its Dec. 24 peak of 276 exahashes per second (EH/s) to 175 EH/s. However, there was a 39% increase in hashrate on the same day which brought it back up to around 244 EH/s.

Bitcoin mining hashrate

Since then, the hashrate has continued to wobble day to day and has now dropped back to the 212 EH/s level once more. This shows that while miners may have turned some of their machines back on, they may be shutting them down once more as the extremely cold weather persists.

How Long Will This Last?

Winter storm expert for Atmospheric Environmental Research Judah Cohen said that the Arctic blast currently being experienced in the United States should be short-lived and last about a week before temperatures begin to return to normal. 

Bitcoin price chart from TradingView.com

However, this still leaves a couple of days before it is expected to completely subside. This is evidenced by the zig-zag recovery and dips in the bitcoin hashrate in the last two days following Dec. 25. Miners who have taken their operations offline to help stabilize the electricity grid will likely leave them offline for a while longer until authorities are convinced the weather has stabilized. An example of this was back in July when Riot Blockchain had to shut off its mining machines in Texas as the state faced a heat wave.

Related Reading: Bearish Indicator: Bitcoin Volatility Hits All-Time Low

Given this, the bitcoin mining hashrate is expected to trend low for another couple of days before bouncing back up. As for the miners, given that Riot had received $9.5 million in energy credits for turning off operations in July, it is possible that some sort of recompense will be offered to the miners.

Analyst Explains Why Ethereum Is Bullish Against Bitcoin

An analyst has explained that the absence of miners on the Ethereum network could be bullish for the ETHBTC ratio.

Miners Provide A Persistent Selling Pressure On Bitcoin

As explained in a tweet by Tom Dunleavy, a Messari research analyst, BTC miners sell almost all the coins they mine. The below chart contains data about the top ten public Bitcoin mining companies, displaying information such as how much each of them mined this year, the amounts that they sold, and the size of their current holdings:

Bitcoin Public Miners

In total, the ten largest mining companies in the space mined a collective 40.7 BTC this year and sold 40.3 BTC. This means that they roughly dumped the entire supply that they mined in 2022 and in the process, applied constant selling pressure on the network.

Earlier in the year, Ethereum successfully transitioned to a Proof-of-Stake (PoS) consensus mechanism, which means the blockchain no longer uses miners for handling transactions, and rather uses stakers (investors that have locked 32 ETH in the PoS contract) to act as validating nodes.

In a Proof-of-Work (PoW) system, miners compete with each other using large amounts of computing power. Therefore, many expenses are involved in getting up their facilities, but one cost, in particular, stays with them as long as they continue to operate: the electricity bills. It is because of these electricity bills that miners have to continuously sell what they mine to keep their business sustainable.

Some miners try to hold onto their reserves for as long as possible, like Marathon, and Hut8 can be seen doing in the chart. Still, in a market like right now, where electricity prices have shot up while the BTC price has plummeted due to the bear, margins are fine for the already debt-ridden public miners, and thus most of them can’t afford to accumulate.

In the case of a PoS chain, however, stakers don’t incur such expenses and thus don’t have any particular need to sell the rewards they earn while staking. This implies that the type of selling pressure that miners put on Bitcoin isn’t present on the Ethereum blockchain.

The analyst believes that this fact provides a good thesis to be bullish on the ETHBTC ratio.

Ethereum Price

At the time of writing, ETH is trading around $1,200, down 1% in the last week.

Ethereum Price Chart