Bitcoin Whales Continue Buying, Now Hold 25.16% Of All Supply

On-chain data shows that the Bitcoin whales’ holdings have grown to 25.16% of the entire supply, and their net accumulation has continued recently.

Bitcoin Investors With 1,000 To 10,000 BTC Have Continued To Buy Recently

According to data from the on-chain analytics firm Santiment, the BTC whales have accumulated more than 266,000 BTC since the start of the year. The indicator of interest here is the “Supply Distribution,” which keeps track of the percentage of the total circulating Bitcoin supply that the various wallet groups are holding right now.

The addresses are divided into these cohorts based on the number of coins they currently have in their balance. The 10 to 100 coins group, for example, includes all wallets that own at least 10 and, at most, 100 BTC.

The Supply Distribution sums up the amount that investors belonging to a particular group as a whole are carrying and calculates what percentage of the supply they contribute.

The 1,000 to 10,000 BTC cohort is of interest in the current discussion. At the current exchange rate, the lower limit for this cohort is $65 million, while the upper one is $650 million.

Clearly, the investors belonging to the group are quite massive, and as such, they are popularly known as “whales.” As the whales can quickly move large amounts, they have the potential to influence the market. Due to this, their behavior can be worth watching.

There are whales beyond this cohort’s 10,000 BTC upper limit as well, but at such massive scales, entities like exchanges also start coming into play, who aren’t exactly normal investors.

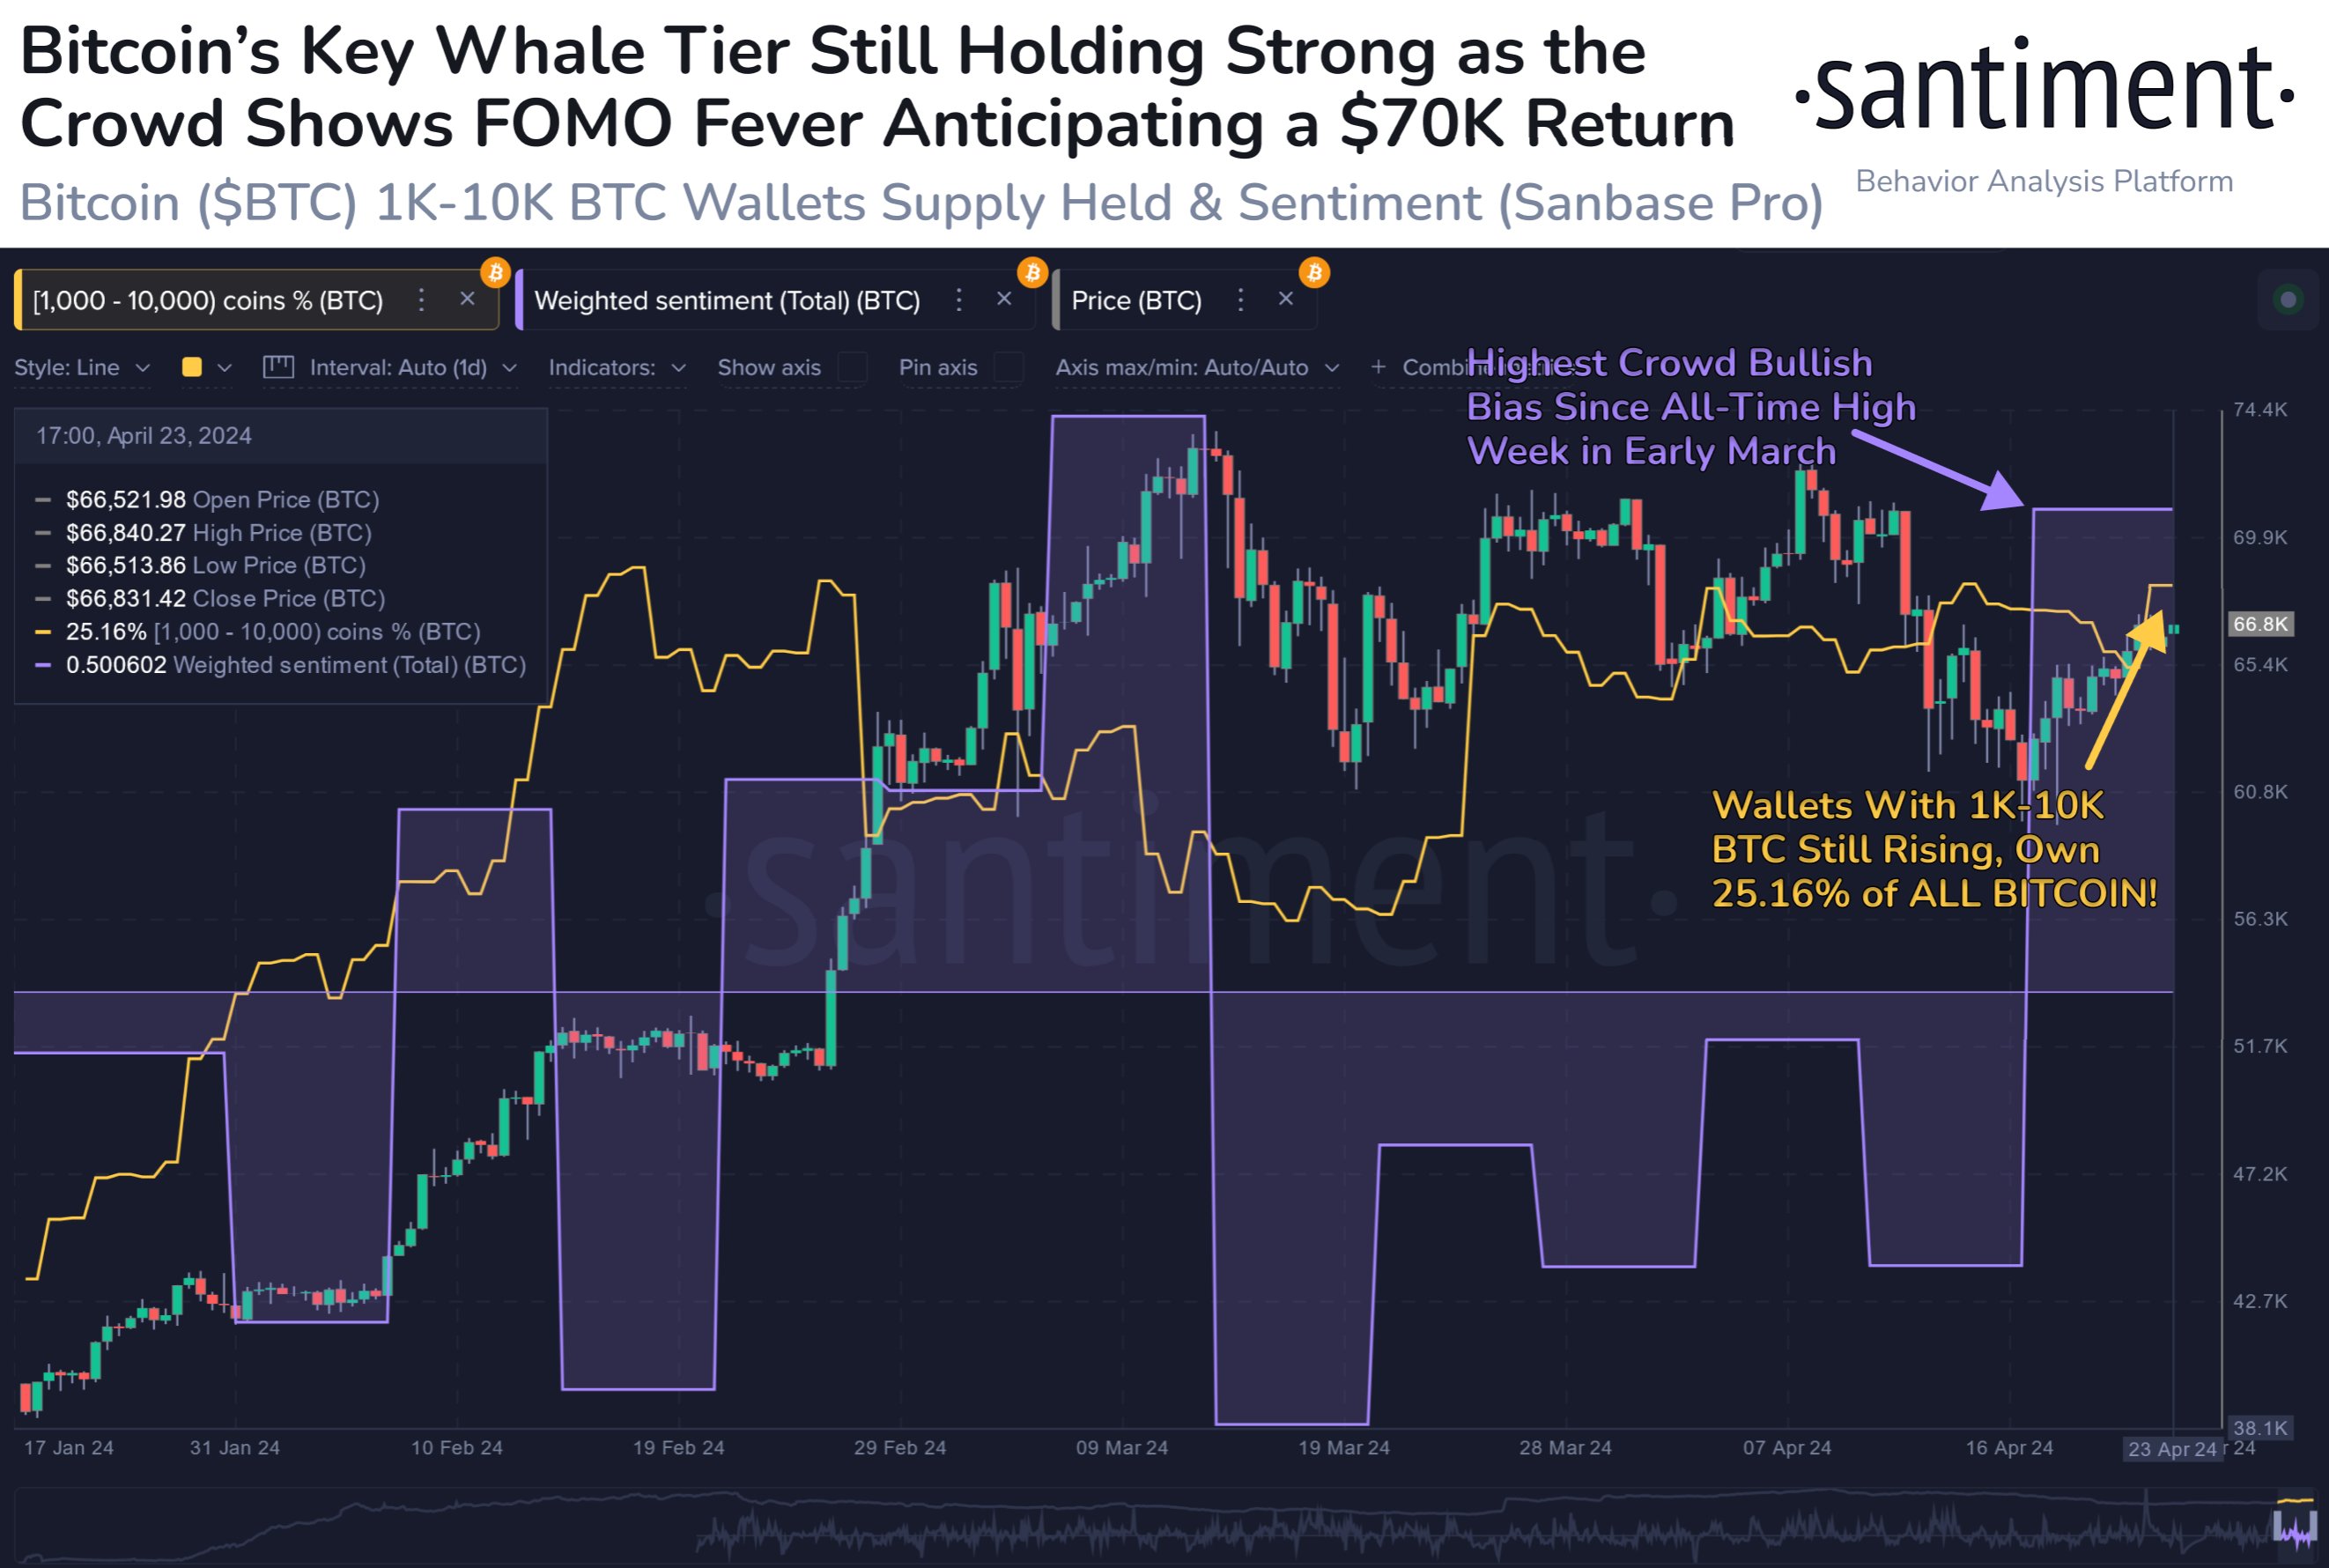
Now, here is a chart that shows the trend in the Bitcoin Supply Distribution for the 1,000 to 10,000 coins group over the last few months:

Bitcoin Whale & Sentiment

As displayed in the above graph, the Bitcoin Supply Distribution for this key investor group has observed a net rise over the year 2024 so far. The whales have bought 266,000 BTC ($17.2 billion) over this period.

However, this accumulation hasn’t been consistent. As is visible in the chart, the whales sold into the rally that would eventually lead to the asset’s new all-time high, and they bought back in once the drawdown was over.

As BTC has consolidated, so has its supply. Still, the latest change in the metric has been towards the upside, implying that these humongous holders are perhaps backing the current recovery push.

Following the latest accumulation, the 1,000 to 10,000 coins group holds 25.16% of the supply, which means that more than a quarter of all Bitcoin in circulation is sitting in the wallets of these large investors.

While whale buying is bullish, the current investor sentiment may not be so. As the data for the “Weighted Sentiment” metric attached by Santiment in the chart suggests, investors are currently showing FOMO towards the asset.

Historically, Bitcoin has tended to move against the majority’s expectations, so FUD/fear has been ideal for uptrends to start. FOMO/greed, on the other hand, has been where tops have become probable.

BTC Price

At the time of writing, Bitcoin is trading at around $64,700, up more than 7% over the past week.
Bitcoin Price Chart

Bitcoin Supply On Exchanges Hit 4-Year Low, But Why Is Price Crashing?

Certain Bitcoin fundamentals suggest the flagship crypto token is well primed for further growth in this bull market. However, its recent price decline has sparked concerns about the reason for this downward trend despite everything pointing to a sustained upward movement. 

Bitcoin Supply On Exchanges Hit 4-Year Low

Data from the on-chain analysis platform CryptoQuant highlighted that the supply of Bitcoin on exchanges has seen nearly a 40% drop in 4 years and is reducing ahead of the Bitcoin halving. This underscores the bullish sentiment around the Bitcoin ecosystem as the decreasing supply on supply suggests that most investors have no plans to sell their holdings anytime soon. 

The CryptoQuant data also noted that Bitcoin’s demand is outpacing its supply, which is said to have been the prevailing trend since 2020. This development offers a bullish narrative as it can continue to increase Bitcoin’s value since “scarcity boosts perceived value.” This trend is also expected to be sustained once the Halving occurs since miners’ supply will be cut in half

Interestingly, the imbalance between Bitcoin’s demand and supply has led crypto analysts like MacronautBTC to believe that BTC’s price could rise to as high as $237,000. As such, there are still high expectations for Bitcoin despite the crypto token hitting a new all-time high (ATH) of $73,750. 

Why Bitcoin’s Price Is Crashing

Crypto analyst Alex Kruger has outlined different reasons why Bitcoin’s price is crashing despite its strong fundamentals. The first reason he alluded to was the fact that crypto traders in the derivatives market look to be overleveraged, possibly because greed seems set to be setting in with traders deploying more capital in anticipation of further price surges. 

Kruger mentioned that the ETH could also be dragging the market down with the hopes of the SEC (Securities and Exchange Commission) approving the Spot Ethereum ETFs waning. Bitcoinist recently reported that the approval odds for these investment funds have plummeted immensely in the past few months, dropping to an alarming 35%. 

The third reason that Kruger mentioned is the negative Bitcoin ETF inflows, which have become a trend lately. Interest in these Bitcoin funds has cooled off, with investors opting to take profit instead. On March 19, BitMEX Research revealed that these ETFs saw a record net outflow of $326m. 

Crypto trader and analyst Rekt Capital also suggested that Bitcoin is already in the ‘Final Pre-Halving Retrace.’ Therefore, significant price corrections can be expected ahead of the Halving event, which is set to take place in April. 

At the time of writing, Bitcoin is trading at around $63,000, down in the last 24 hours, according to data from CoinMarketCap. 

Bitcoin price chart from Tradingview.com

Bitcoin Demands Exceeds Miner Supply By 1,300%, Why A Push To $237,000 Is Possible

As the Bitcoin Halving draws nearer, there is so much optimism about what could happen to Bitcoin’s price in the aftermath of this event. This optimism is further heightened by a recent development showing how Bitcoin’s demand far outpaces its supply, which could see the flagship crypto token rise to as high as $237,000. 

Bitcoin Demand Significantly Outpacing Its Demand

Crypto analyst Willy Woo mentioned in an X (formerly Twitter) post that the Bitcoin network receives an average of $607 million of new investor demand daily. On the other hand, this demand is said to be met by a supply of just $46 million daily in terms of Bitcoin mined. This development is more significant considering that the Halving is fast approaching. 

This is when Bitcoin Miners’ rewards are cut in half, acting as a deflationary measure and reducing the rate at which more BTC comes into circulation. This also offers a bullish narrative, as the already insufficient supply will decline further after the Halving event. Once that happens, Bitcoin is expected to become more valuable, with more price increases imminent. 

Industry expert Anthony Pompliano also highlighted this phenomenon when he noted how institutional investors were gobbling up BTC almost 13x faster than its production rate. He added that the flagship crypto token was bound to see a new all-time high (ATH) if this trend continues. 

This institutional demand for BTC is mainly driven by the Spot Bitcoin ETFs, which were approved in January. Due to the impressive demand for these funds, fund issuers like BlackRock have continued to accumulate a significant portion of the BTC supply on a daily. Interestingly, these Bitcoin ETFs were reported to hold 3.3% of Bitcoin’s circulating supply earlier in the month. 

Bitcoin’s Road To $237,000

In response to Willy Woo’s post, crypto analyst MacronautBTC made a “conservative” calculation of how Bitcoin’s price could rise to $237,000. Using a multiplier of 3x the Dollar currently flowing into the Bitcoin ecosystem, the analyst mentioned that Bitcoin could see an added market cap of 4.38 trillion. 

He then added the 4.38 trillion to Bitcoin’s current market cap of 1 trillion, which sums up to a 5.38 trillion market cap. This potentially puts Bitcoin’s price at $273,000 (a year from now, going by MacronautBTC’s calculation. 

The analyst also highlighted how this price level coincides with predictions made by notable Bitcoin bulls. One of them is Tim Draper, who recently stated that BTC will hit $250,000 in 2025. 

At the time of writing, Bitcoin is trading at around $50,900, down almost 2%% in the last 24 hours, according to data from CoinMarketCap. 

Bitcoin price chart from Tradingview.com

Bitcoin Supply Metric Touches New All-Time High, Time For Reversal?

Bitcoin has been named the best performer among asset classes in 2023, but the cryptocurrency is still struggling to break new levels in its price. Despite the current bearish sentiment, many analysts have hinted and predicted a bull run in the coming months, especially as the market awaits the approval of a spot Bitcoin ETF

This has probably prompted many investors to hold on to their coins, as on-chain metrics have shown that the amount of Bitcoin supply idling recently reached a new all-time high. 

Unmoved Bitcoin Supply Reaches Record High

The industry expects the SEC’s approval of spot Bitcoin ETFs to ignite the next bullish run for the price of Bitcoin. Although the SEC has so far rejected a number of requests for Bitcoin ETFs, many analysts believe it will not be long until one is accepted. 

Considering Bitcoin’s dominance of the entire crypto market capitalization, a spike in Bitcoin’s price is expected to flow into all other cryptocurrencies. As a result, investors have been keeping their holdings in expectation of a future price increase. 

Recent data has shown that 94.8% of the total Bitcoin supply has not moved in the past month, indicating a new all-time high for the metric. 

Similarly, a recent post by on-chain intelligence platform Glassnode alerts revealed that the amount of HODLed or lost Bitcoin reached a 5-year high of 7,906,288.227 BTC.

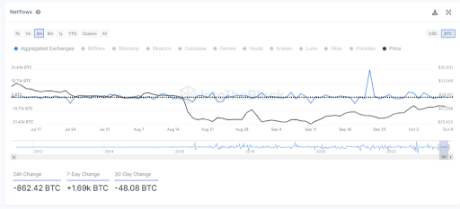
The overall Bitcoin net flow into exchanges has decreased by 862.42 BTC ($23.27 million) in the past 24 hours, according to chart insights provided by IntoTheBlock. While this is relatively small compared to Bitcoin’s market cap, it shows investor mood might be changing into a bullish sentiment.

Bitcoin supply metric

Time For Reversal?

Bitcoin’s price just rebounded up to $27,100 after failing to gain traction above the $27,800 resistance in the midst of escalating Israel-Hamas tensions in the Middle East. Despite this, BTC still remains the best-performing investment asset this year, outperforming stocks and bonds with its year-to-date (YTD) return of 63.3%.  

Some investors view unmoved Bitcoin as a sign of solid faith in the network and adoption of a long-term mindset. Whatever the reason, Bitcoin’s unmoved supply metric is worth watching as an indicator of holder sentiment and potential future price pressure. 

Recent happenings, particularly the tension of an oncoming recession in the US, have prompted billionaire hedge fund manager Paul Tudor Jones to assert that this is the best time to buy Bitcoin. 

Bitcoin price chart from Tradingview.com (Unmoved supply)

Bitcoin Supply Is Moving From American Holders To Asian Wallets: Glassnode

Data from Glassnode reveals the Bitcoin supply has been observing a shift from wallets based in America to those in Asia recently.

Bitcoin Supplies Held By Asian And US Investors Have Gone Opposite Ways Recently

According to data from the on-chain analytics firm Glassnode, an interesting dichotomy has formed between the different regional supplies of the cryptocurrency recently.

Glassnode has divided the Bitcoin addresses into different regions based on the hours they have been making transactions in. “Geolocation of Bitcoin supply is performed probabilistically at the entity level,” notes Glassnode. An “entity” here refers to one or more wallets that are under the control of a single investor (or an investor group).

“The timestamps of all transactions created by an entity are correlated with the working hours of different geographical regions to determine the probabilities for each entity being located in the US, Europe, or Asia,” explains the analytics firm.

The three main regions are the US (13:00 to 01:00 UTC), Europe (07:00 to 19:00 UTC), and Asia (00:00 to 12:00 UTC). In the context of the current discussion, however, only the supplies based in the US and Asia are relevant.

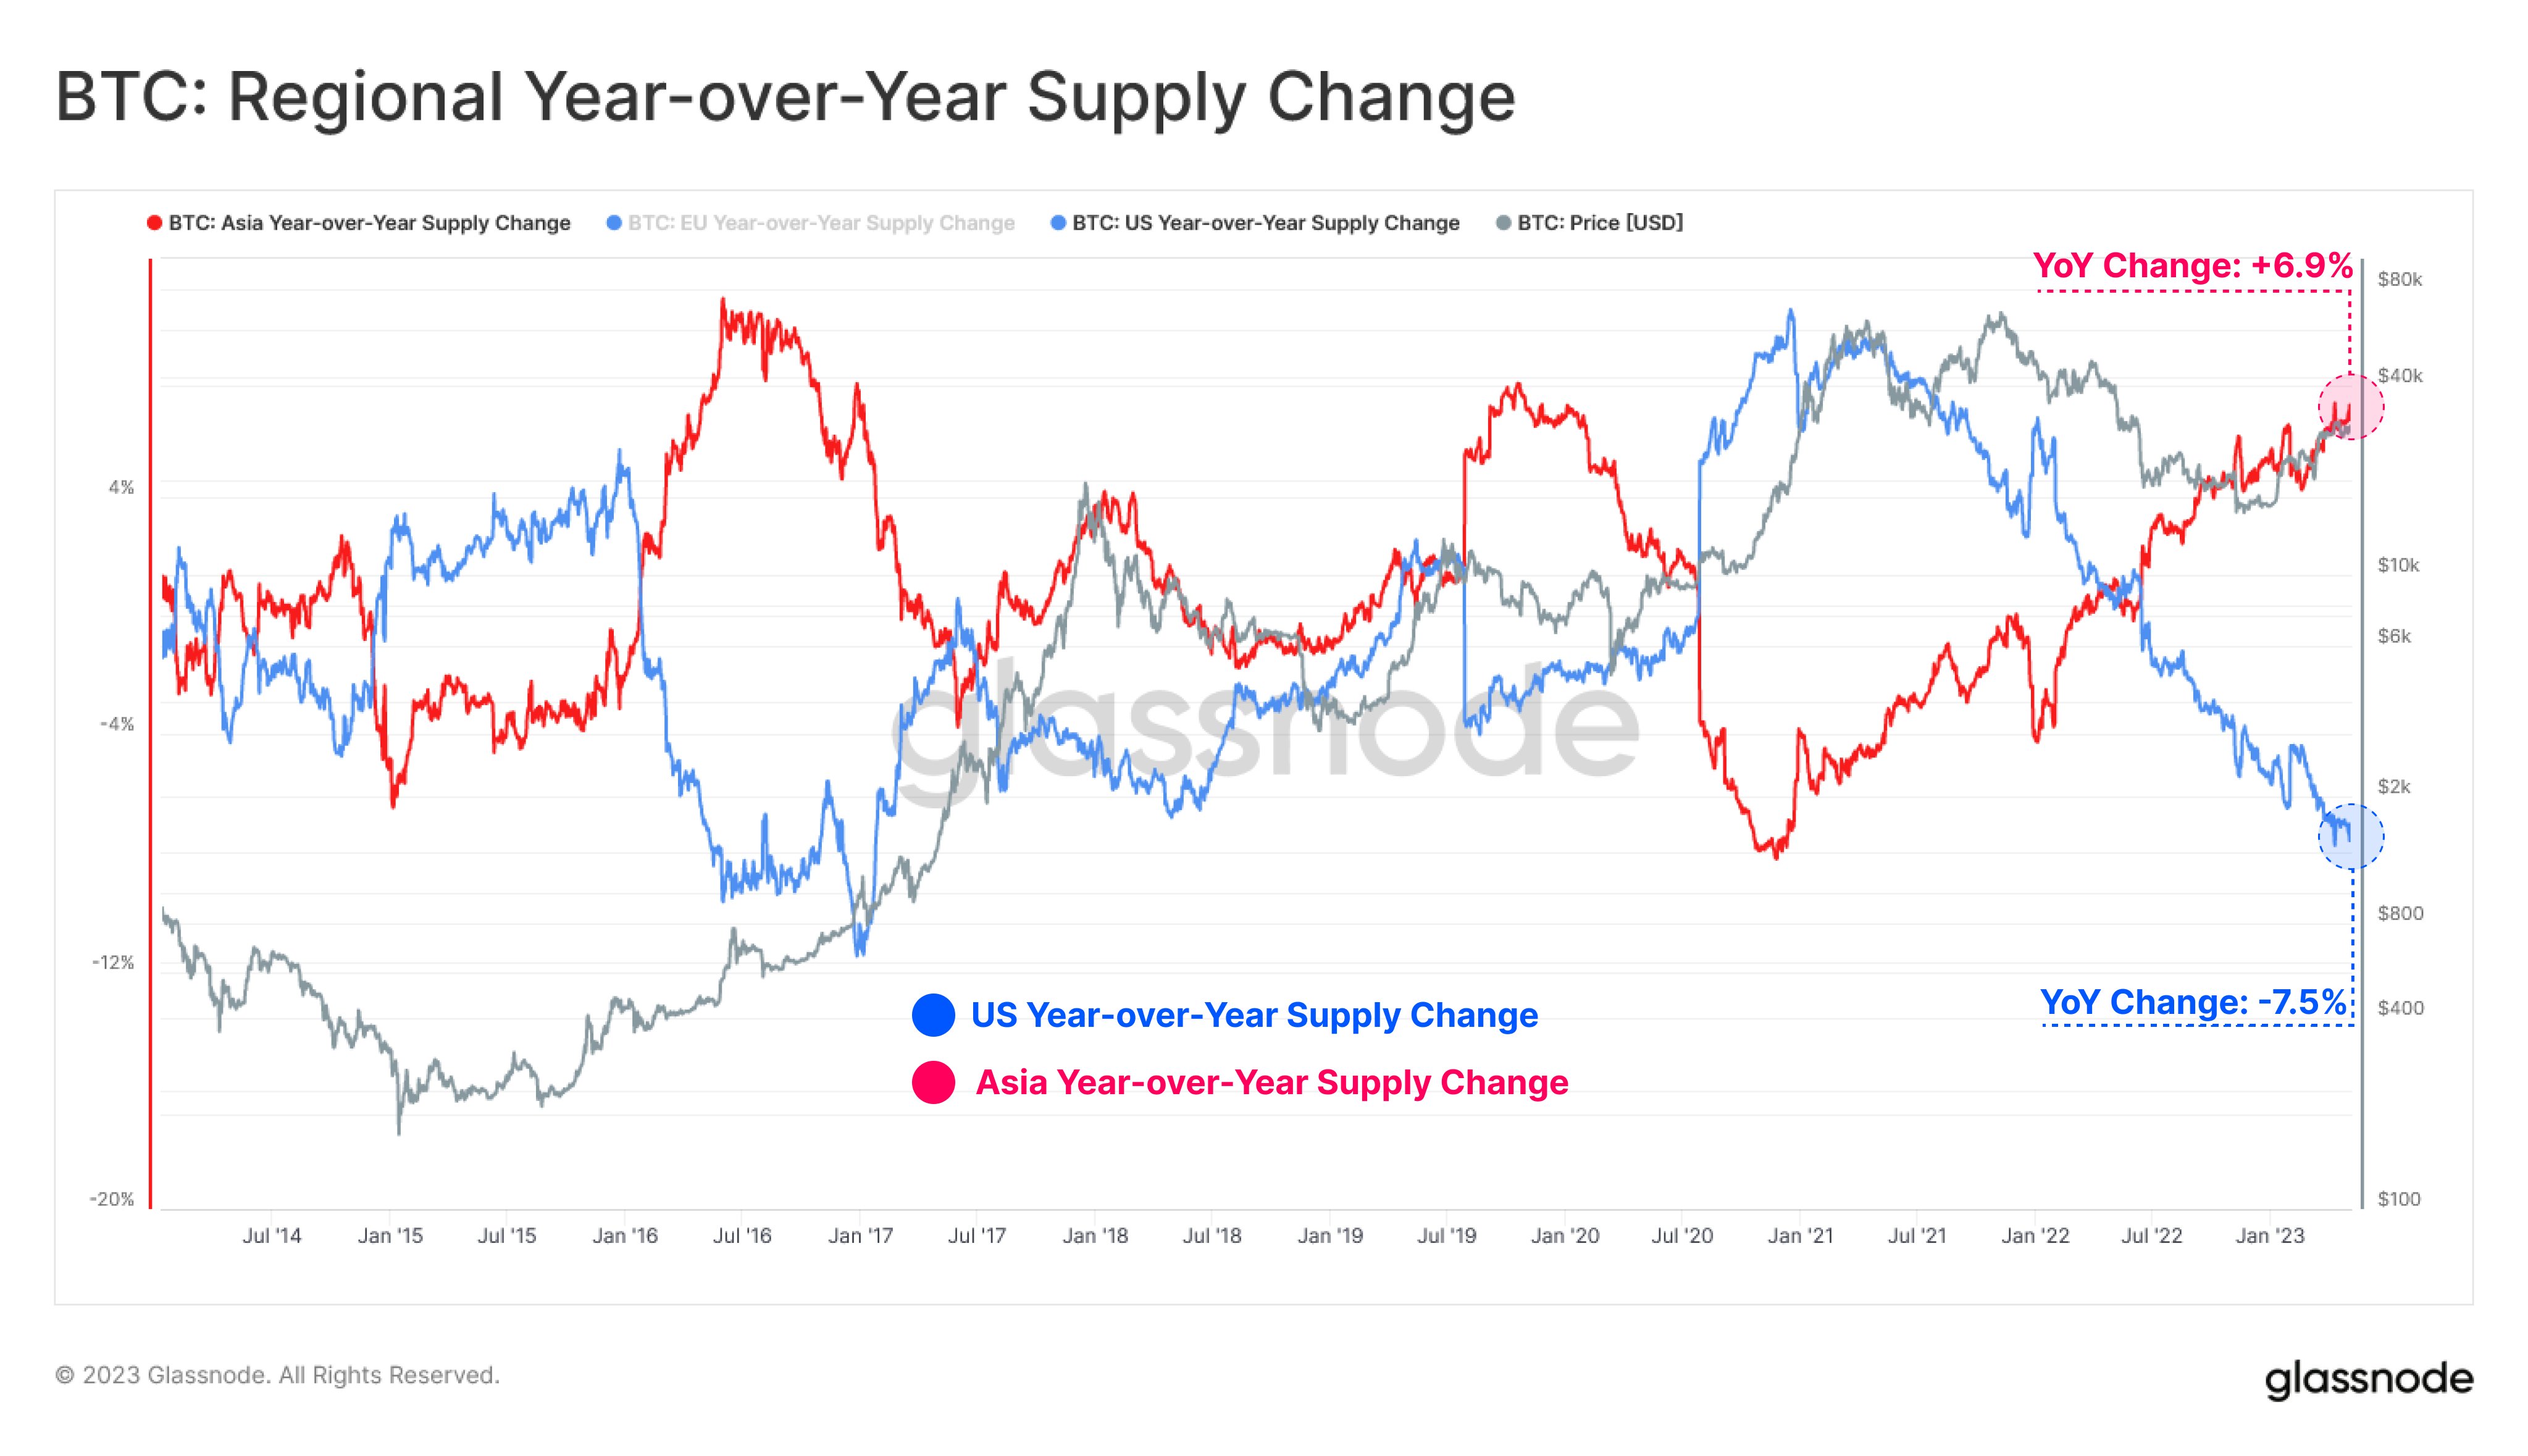
Here is a chart that shows the trend in the year-over-year supply change in these two regional Bitcoin supplies over the last few years:

Bitcoin Supply From US to Asia

As displayed in the above graph, the Bitcoin supply held by the US investors was growing faster and faster in the leadup to and during the bull run in the first half of 2021 as the year-over-year change was constantly going up.

The change slowed down in the second half of the year, but still remained positive, suggesting that the supply was still growing, albeit at a slower pace. In 2022, however, the supply started decreasing, as the bear market took over and the LUNA and 3AC crashes took place.

The year-over-year change of the US-based BTC supply has continued to grow more negative since then and today stands at a value of -7.5%, suggesting that the supply has shrunken by 7.5% since May 2022.

The Asian Bitcoin supply, however, has displayed a very contrasting behavior, as it started going up just as the American investors started shedding their holdings.

Interestingly, the pace at which the supply held by the Asian traders has transformed is almost exactly the same as what the balances of the US-based wallets saw (although, of course, the change has been in the opposite direction).

Currently, the year-over-year change in the Asian supply stands at +6.9%. The fact that the Asian investors have bought a similar amount to what the US holders have sold suggests a direct transfer of coins between the two supplies.

Now, as for why this continued transition of supply has taken place, the main reason is likely to be the fact that the US has been tightening up regulations related to the cryptocurrency sector recently.

One of the most prominent examples of this has been the regulatory crackdown that Coinbase has observed from the Securities and Exchange Commission (SEC) recently.

BTC Price

At the time of writing, Bitcoin is trading around $28,200, down 1% in the last week.

Bitcoin Price Chart

Bitcoin Retail Investors Now Hold 17% Of Total BTC Supply, But Is It Good News?

Bitcoin retail investor numbers are on the rise. These smaller investors have less purchasing power but with so many new entrants into the market following the 2020-2021 bull market, their collective purchasing power has grown alongside the total amount they hold.

Retail Investors Hold 17% Of Supply

Over the last few years, bitcoin addresses holding less than 10 BTC on their balances have been picking up more BTC supply. Recent data from on-chain data aggregator Glassnode shows that these small investors now hold 17% of the total BTC supply.

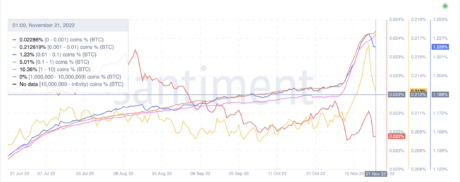
This subset of investors has grown by almost 50% in the last two years from around 12% to 17.3%, and a 0.5% increase in the last 30 days as data from Santiment shows the percentage of supply held by addresses holding between 0.001-10 BTC was sitting at 16.8% on Nov. 1, 2022.

Interestingly, this BTC holder base had seen a significant decline at the start of November. This coincides with the collapse of the FTX crypto exchange, taking a good number of investor coins down with it. However, the recovery has been swift and retail holders are back to building their balances back up.

Bitcoin holders with less than 10 BTC

The increase in retail investor numbers follows the same patterns as previous bull markets such as the 2017 bull market. This shines through in the fact that at the start of 2021, these small holders only account for 13.9% of all BTC supply.

Is This Good News For Bitcoin?

The accelerated adoption rate has been good news for bitcoin and was one of the main drivers behind the 2021 bull market. Looking back, the rise in retail holder numbers has always been good news for the digital asset. It propels the adoption of the cryptocurrency, as well as helps to distribute the total supply to more holders.

Currently, the vast majority of BTC’s supply is still being controlled by large. With more retail investors buying coins, there is more demand for the digital asset. More demand leads to scarcity and scarcity begets higher prices.

Bitcoin price chart from TradingView.com

However, it is also important to take into account the current crypto market climate. The ‘crypto winter’ is in full bloom, so the next bull market could still be another year away. Given this, adoption will likely help sustain the current price trend rather than trigger a rally.

Nevertheless, the steady rise in wallets holding less than 10 BTC shows more interest from the broader investor community. It also marks significant accumulation among smaller investors during this time. 

Volume Of Bitcoin Illiquid Supply Points To Growing Bullish Sentiment

The way bitcoin holders move the BTC in and out of their wallets can often be a strong indicator of where the market might be headed next. Not just the movements of the asset, but where they are being moved to. An example of this is when more investors are moving their holdings to exchanges, which means that sell sentiment has risen and investors are dumping their coins, and vice versa.

In this same line, looking at the liquid and illiquid supply of bitcoin can also be another strong indicator. And this time around, the percentage of bitcoin supply that remains illiquid point towards a bull trend and hold sentiment among investors.

Bitcoin Illiquid Supply At 4-Year Highs

Bitcoin illiquid levels have shot up in the past few years. In 2017, the total illiquid supply of BTC had risen above 76%. This number had remained under this level for the next four years, until now. Currently, the total BTC illiquid supply has risen back above 76% to its present 76.%. It points to more investors being more interested in holding their assets for the long term.

Related Reading | Bitcoin Supply On Exchanges Hits New Multi-Year Low Of 13.27%

Total liquid and highly liquid supply are split between 23.8% of the supply. The illiquid supply is held in wallets that show little to no history of spending of any kind. These wallets have held on to their holdings for longer than a year for the most part, and their history point towards the owners being in full accumulation mode. The contents of these wallets have barely moved, and if so, have not been in the direction of exchanges.

Illiquid supply touch four-year highs | Source: Glassnode

Price and illiquid supply are now going in opposite directions of each other. While the price is going down, pointing towards bearish sentiment, the volume of illiquid supply is going up. This report shows that illiquid supply went up by 0.27% over the course of a week, showing bullish sentiment among investors.

Exchange Outflows Grow

Bitcoin exchange outflows have also surpassed inflows in recent times, contributing to the growing illiquid supply. The past week saw outflows hit as high as 59K BTC per month leaving exchanges. The illiquid supply has been placed at approximately 51K BTC for the same time period. So, it is only natural to assume that the exchange outflows are being moved to personal storage by investors.

Total change reserves have continued to decline in light of this. For the first time in over two years, the total supply on Bitcoin exchanges has reached 13.27%, one of the lowest ever recorded.

BTC supply on exchanges drops to 13.55% | Source: Glassnode

As for the digital asset, its price movements have maintained a particular trend. With the low momentum in the market, the digital asset has been unable to move upwards out of its $37,000 price point. Meanwhile, it has not fallen below this point either, showing that bulls are still successfully holding up the asset despite being in a bearish trend.

Related Reading | Bitcoin Inflows Suggest Institutional Investors Are Moving Back Into The Market

Exchange outflows and illiquid supply currently point to an accumulation sentiment as fewer and fewer coins are being spent and sold with each downtrend.

BTC down to $37,000 | Source: BTCUSD on TradingView.com
Featured image from The Crypto Associate, charts from Glassnode and TradingView.com

90% Of Total Bitcoin Supply Has Been Mined. How Long Will The Rest Take?

Bitcoin has been the leading choice for investors in the crypto space being the first of its kind. However, there is more to why the cryptocurrency is so attractive for investors. The limited supply of the digital asset has secured its reputation as a deflationary asset, making it a great inflation hedge. There will only ever be 21 million bitcoins that will be mined.

BTC mining has now been going on for a little over a decade now. For the first eight years or so, mining activities remained pretty flat but picked up once the 2017/2018 bull market picked up. Since then, bitcoins have been mined at a rapid rate and despite multiple halvings taking place over the years, 90% of the total BTC supply has now been mined.

Related Reading | Why “Bitcoin Creator” Craig Wright Came Out Ahead Despite Having To Pay $100 Million

Majority Of Bitcoin Mined

On Monday, bitcoin officially clocked 90% of its total supply mined. Over 18.89 million BTC has now been successfully mined since bitcoin was first launched in 2009, according to data from Blockchain.com. This number and the rate of mining have led to concerns about an impending supply shock in the market.

As bitcoin grows in popularity, the demand for the digital asset is no doubt going to skyrocket. It is presently estimated that only about 5% of the total global population knows about bitcoin. A recent study showed that 55% of total bitcoin holders got into the market this year alone. As the world becomes one big global village, digital currencies like BTC will see increasing yields.

Total BTC mined reaches 90% of total supply | Source: Blockchain

Another reason for an impending supply shock is that investors have no intention to sell the assets that they hold. Most BTC holders have proven to be long-term holders and as they continue to hold on to these coins, there will be less supply left in the market. This dwindling market supply will likely see the price of the asset surge immensely in the coming years.

How Long Will It Take To Mine The Rest?

Despite it only taking about 12 years for the majority of the bitcoin supply to be mined, the remaining 10% of the supply will take almost 10 times longer to mind. This is due to the halvings that occur every four years. Basically, the BTC rewards paid out to miners per block mined are cut in half with each halving. Currently, this number sits at 6.25 BTC paid out per mined block.

Related Reading | Bitcoin Active Addresses Recovers Above 1 Million

With each halving, this number will go down greatly, and it is estimated that the last bitcoin will not be mined until 2140, over 100 years from now. This guarantees bitcoin’s longevity, as well as guarantees continued supply, albeit to a smaller extent each time.

BTC falls to $48K | Source: BTCUSD on TradingView.com

That said, not all of the mined bitcoins will go into circulation. About 20% of the total supply is presumed to be lost forever from people either forgetting their private keys or dying and leaving no way for anyone to access these coins. So, even when the total 21 million BTC is mined, there will never be as many as 21 million coins in circulation, contributing to the supply squeeze.

Featured image from NationalWorld, chart from TradingView.com

Bitcoin Supply Looks Illiquid As Long-Term Holders Keep From Selling

Data shows Bitcoin supply has been relatively illiquid recently as long-term holders haven’t started realizing profits much.

Bitcoin Supply Last Moved Within 30 Days Has Been Relatively Low

As per the latest weekly report from Arcane Research, despite a rise in BTC’s price recently, the supply moved within the last 30 days hasn’t risen much.

The percentage of Bitcoin supply last moved in the past 30 days is an important indicator that tells us about the liquidity of the market.

Usually, when coins start aging more, they become less likely to be moved. Because of this reason, a low proportion of short-term supply implies low liquidity in the market. This can be a bullish signal for BTC.

On the other hand, if a high percentage of Bitcoin supply is young, then the liquidity would be high. This may be a sign of bearish trend.

Based on the trend of the indicator, it may be possible to tell whether the market is nearing a peak or not. Here is a chart that shows how the value of the BTC young supply has changed since 2017:

Looks like the current percentage of supply moved in the last thirty days is relatively low | Source: The Arcane Research Weekly Update – Week 44

The above graph shows some interesting features between the indicator and the Bitcoin price during the two bull runs of 2017 and 2018.

Related Reading | Bitcoin Sentiment Suggests Serious Greed, But Will A Correction Come?

In 2017, whenever the short-term supply peaked, the price of the crypto also made a top. But the trend didn’t hold true in 2021 as the sole sharp spike in the metric has been followed by a strong bull market that lasted three months.

The sharp spike in the short-term supply this year was seen when Bitcoin broke the 2017 all-time high. Long-term holders started selling then, increasing the liquidity.

The demand for the coin only increased in the following months, but the supply shock became too big. The price started moving down soon after.

Related Reading | S2F Creator PlanB Believes In $98k Nov Target For Bitcoin

Currently, the short-term supply is sitting at a healthy 10%, which means it has enough room to grow still, despite already making a new ATH. This means that if Bitcoin’s strength remains, the market can still grow before hitting a top.

BTC Price

At the time of writing, Bitcoin’s price floats around $68.2k, up 10% in the last seven days. Over the past month, the crypto has gained 18% in value.

Below is a chart that shows the trend in the price of the coin over the last five days.

BTC’s price has made a new ATH above the $68k mark | Source: BTCUSD on TradingVIew
Featured image from Unsplash.com, charts from TradingView.com, Arcane Research

How Shrinking Short-Term Supply Of Bitcoin Is Affecting The Asset’s Price

This year has been marked by numerous lows for bitcoin. The digital asset has seen yearly lows in the exchange reserves, transaction fees, and now, the short-term supply of bitcoin is down. The short-term supply has been shrinking for the past year. With declining volumes showing trends that have not been seen in the past five years. Given the low volume of bitcoin transactions, which has led to low transaction fees, only few bitcoins are moving around the network.

One And Three-Month Lows Show Shrinkage

Bitcoin is no longer being spent as it was in the past. One of the leading ideas behind the creation of the digital asset was so it could double as a currency, one which was not controlled by any one person or entity. Early adopters stuck to this initial vision. Using BTC for purchases where they can. Metrics show that in the past month, 6.8% of the asset’s total supply has been spent. While the three-month trend shows that only 15.8% of the total supply has been spent by investors.

Related Reading | Bitcoin Suffers As Mid Caps Cryptos Establish Market Dominance With Wide Margin

The three-month lows show the short-term supply of bitcoin is shrinking to 2015 lows. In the month of August, short-term supply hit a low of 6.75%. With a slight increase that only happened after the asset had recovered back towards the $50,000 mark. But this did not last long. The supply per month is in a declining trend, indicating that subsequent months will also see shrinking short-term supply.

BTC supply has continually shrunk for the past three months | Source: Arcane Research
How Short-Term Supply Affects Bitcoin Price

Although low, the declining short-term supply of bitcoin does spell good news for the asset. It indicates that investors are still holding on to their coins, showing bullish sentiment amongst the investor community. It also shows that bitcoin’s recent gains have motivated investors to hold their funds. Instead of moving it onto exchanges to sell and cash out their gains.

Related Reading | New To Bitcoin? Learn To Trade Crypto With The NewsBTC Trading Course

With hold sentiment on the rise, it will play into the favor of BTC. The asset’s value is likely to rise with more investors holding their BTC bags. Increased sell pressure also motivates new investors to buy into the coins. Simultaneously motivating old investors to stay and ride out the low periods in wait for the bull markets.

BTC price trading above $48,000 | Source: BTCUSD on TradingView.com

The current trends show declining short-term supply has happened when the asset has witnessed a crash or dip in its price. It is obvious that investors are taking advantage of these price dips to top up their bags. Panic selling has also dropped dramatically in the market with more understanding of price movements. Leading to more diamond hands in the market. Bitcoin, it seems, has entered the era of holding.

Featured image from Master The Crypto, chart from TradingView.com

Data Shows Nearly 90% of Bitcoin Has Been Mined, Here’s How Long It Will Take To Mine The Rest

Bitcoin mining is still one of the hotly debated parts of the blockchain. Miners, no doubt make a good amount for blocks mined given the current price of BTC. But mining difficulty has also gone up as more BTC are mined.

In its decade-long history, over 18.6 million of Bitcoin’s 21 million total supply has been mined. This constitutes almost 90% of all BTC’s supply. This leaves a little over 10% of BTC left to be mined. Currently, there are about 2.250 million coins left to be mined.

Related Reading | Market Analyst Sees Bitcoin Peaking At $100,000 By Year-End

At the current rate, it is estimated that the last bitcoin will be mined about 120 years from now. This is due to halving events that will occur every four years, reducing the supply of BTC going into circulation every four years.

Mining Bitcoin In 2009 Versus Mining In 2021

The cryptocurrency which first came out in 2009 had rewarded miners 50 bitcoins for each block that they mined. This was back when a user could mine bitcoin using an old laptop with a crappy graphics card. At this point, bitcoin was worth next to nothing. So a lot of miners either forgot their coins or sold them for very cheap. Bitcoin’s price evolution through this point is an interesting time.

Related Reading | Crypto Has Arrived In Hollywood And The Stars Are Loving It!

In 2021, three halving events since the launch of the digital currency has seen reward for block mined reduce drastically. The first halving occurred in 2012. At this point, the reward for a block was 25, reducing it by half. The next halving occurred in 2016, which reduced the reward to 12.5. The most recent halving happened in 2020, which reduced the number of bitcoins received per mined block to 6.25.

The reward will continue to halve every four years until all 21 million BTC are mined. Every halving will reduce the rewards for mined blocks by half every time. Making the rewards for mining blocks smaller, while simultaneously increasing the mining difficulty as miners clamor to get the rewards for mined blocks.

BTC Growth Over The Years

The pioneer cryptocurrency didn’t draw too much attention until the Silk Road bust happened. Before the Silk Road was launched, BTC was only used by people who were in it for the technology. The returns were not really significant at this point. These of BTC on Silk Road as a way to purchase literally anything, from drugs to weapons, is what really made law enforcement turn its focus on the coin.

BTC started to see significant growth in 2017 | Source: BTCUSD on TradingView.com

BTC’s price remained mostly flat around this period, despite its increased popularity, thanks to the Silk Road bust. The most notable bull run happened in 2017-2018. This was when a lot of investors had heard about bitcoin. The bull market brought BTC to the forefront as a strong asset to contend with.

Related Reading | Bitcoin At $100,000, Ethereum At $5,000 Is Path Of Least Resistance, Says Bloomberg Crypto Analyst

In 2021, it is estimated that about 10% of the current world population are invested in either BTC or altcoins. Current numbers are put between an estimated 51 and 52.4 million crypto investors in the world. Compared to an estimated 2.9 to 5.8 million in 2017, this is tremendous growth.

Featured image from OptinMonster, chart from TradingView.com

Bitcoin Shortage? Pantera Thinks Market Rally Driven by PayPal Buys

PayPal’s recent leap into the crypto market is helping to drive the current bitcoin (BTC) rally, according to Pantera, a prominent cryptocurrency and blockchain investment firm. In an investor letter published Nov. 20, the venture firm compared the ongoing bull market to the last time BTC rose above $18,000, three years ago.  “Previously the friction to […]