Market Expert Predicts New Paradigm For Bitcoin: ‘Days Under $100,000 Numbered’

As the Bitcoin (BTC) Halving event concluded for the fourth time, the cryptocurrency market witnessed notable changes in key metrics. 

These developments have led Charles Edwards, a market expert and founder of Capriole Invest, to issue bold predictions that hint at a paradigm shift in the BTC market. 

Bitcoin Trading At ‘Deep Discount’

One of the key metrics highlighted by Edwards is the staggering electrical cost associated with mining a single Bitcoin. Edwards reveals that this cost has now reached an astonishing $77,4000. This figure represents the raw electricity expenses required to power the Bitcoin network for every newly mined BTC.

Another significant metric that Edwards draws attention to is the Bitcoin Miner Price, which soared to $244,000 on Saturday. This metric encompasses the block reward and fees miners receive for every Bitcoin they successfully mine. 

Notably, this surge in miner price coincided with transaction fees skyrocketing to $230, marking a four-fold increase compared to the previous all-time high of $68 set in 2021.

Bitcoin

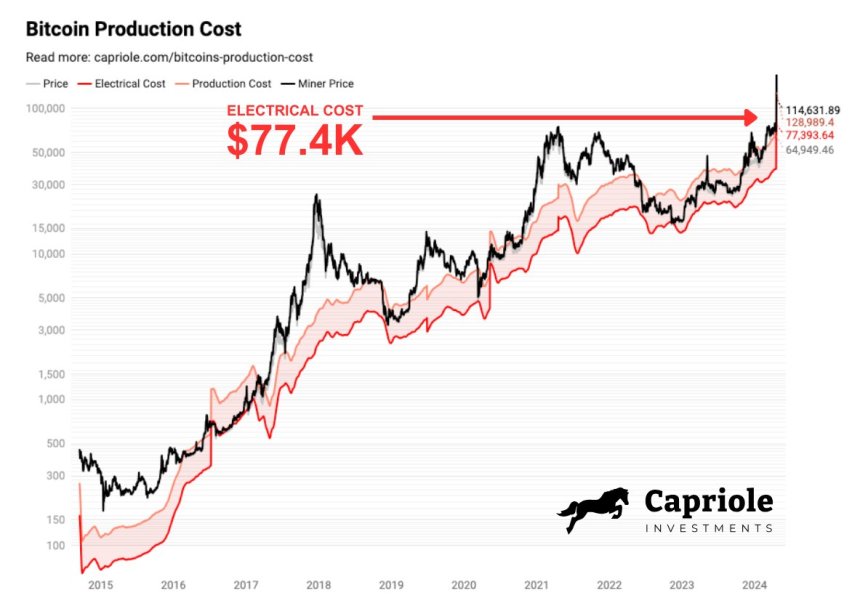
Considering the metrics above, Edwards suggests that BTC currently trades at a “deep discount.”  This is because BTC’s price is lower than the electrical costs of mining it.

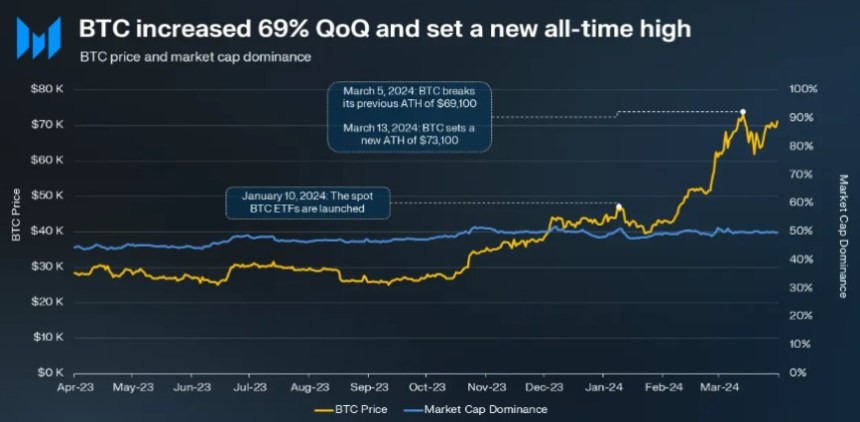
Typically, this situation only lasts for a few days every four years, suggesting that the price will only take a short time to catch up and surpass this price level, which is slightly below BTC’s all-time high (ATH) of $73,7000, reached on March 14th. 

Edwards outlines three possible outcomes in the wake of these developments. First, he anticipates a scenario in which the price of Bitcoin experiences a significant surge. 

Secondly, there is a likelihood that approximately 15% of miners may be forced to shut down due to unfavorable economics. Finally, Edwards suggests that average transaction fees are expected to remain substantially higher.

Based on the analysis of these metrics and the potential scenarios, Edwards boldly predicts that Bitcoin’s days under the $100,000 mark are “numbered.” While it remains to be seen which of the three outcomes will prevail, Edwards expects a combination of all three factors to contribute to Bitcoin’s price appreciation.

Optimal Buying Opportunity? 

Bitcoin has demonstrated significant price consolidation above the $60,000 mark since Friday, following temporary drops below this threshold amid mounting anticipation for the Halving event. 

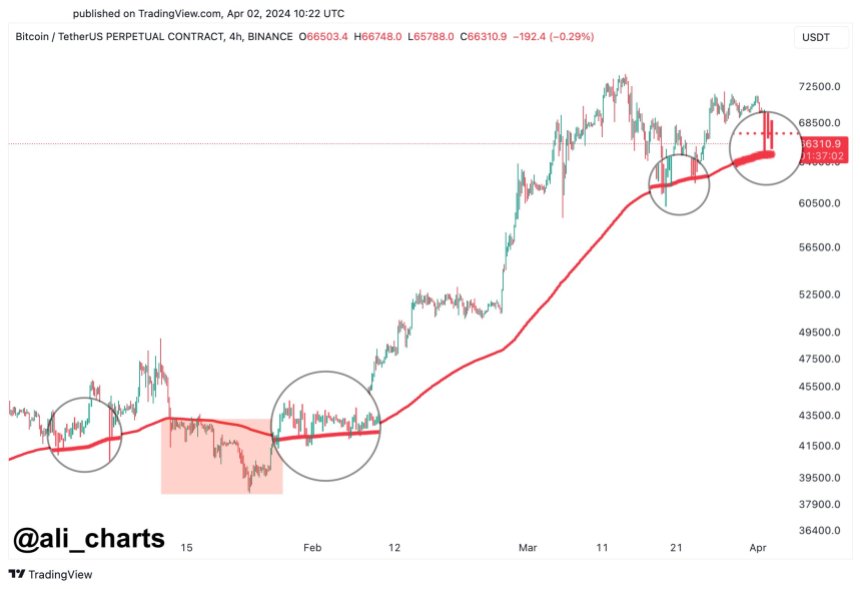
Crypto analyst Ali Martinez recently analyzed Bitcoin’s current price state, suggesting that a potential bottom may have formed above these levels, increasing the likelihood of surpassing upper resistance levels shortly.

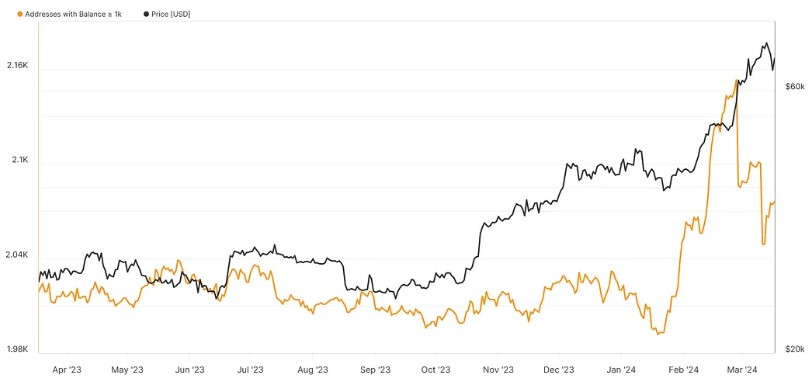
According to Ali Martinez’s analysis, Bitcoin strives to establish the $66,000 price level as a crucial support zone. Data reveals that approximately 1.54 million addresses collectively purchased 747,000 BTC at this level. If Bitcoin successfully secures this support, it may pave the way for further upward movement.

Martinez identifies Bitcoin’s next critical resistance levels, between $69,900 and $71,200. These levels represent significant price barriers for BTC bulls, and Bitcoin may encounter selling pressure at these levels. 

In addition, the analyst points out that the Bitcoin MVRV ratio, a metric that compares the market value of Bitcoin to its realized value, has shown a promising pattern, as seen in the chart below. 

Bitcoin

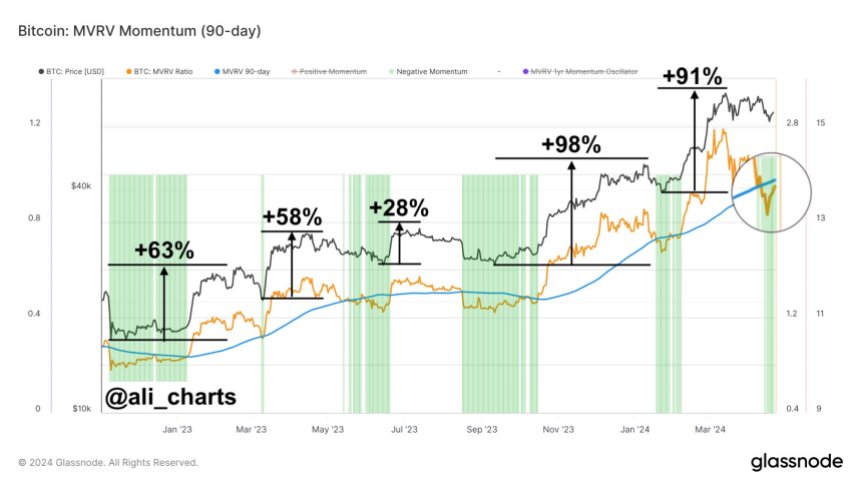
Martinez highlights that whenever the MVRV ratio falls below its 90-day average since November 2022, it historically indicates an optimal buying opportunity for Bitcoin. Interestingly, such buying opportunities have resulted in average gains of approximately 67%.

According to Martinez, based on current market conditions and an analysis of the MVRV ratio, now may be an opportune time to consider buying Bitcoin. The historical data and the potential for significant price appreciation support this view. 

Bitcoin

BTC is trading at $66,100, up 1.6% in the past 24 hours. 

Featured image from Shutterstock, chart from TradingView.com

Bitcoin Halving: Anticipating Price Impact, Miner Challenges, And Long-Term Outlook

The highly anticipated Bitcoin Halving event is close, bringing with it heightened expectations regarding the long-term impact on the Bitcoin price. 

There are concerns, however, that this quadrennial event may already be priced in, as Bitcoin recently reached an unprecedented all-time high of $73,700 on March 14.

This surge broke the pattern of previous Halvings, where Bitcoin had never surpassed its previous ATH before the event. However, historical data reveals significant price increases in the year following previous Halvings.

Experts Predict Delayed Bitcoin Halving Price Impact

Analysts argue that the compounding impact of reduced issuance takes several months to materialize, suggesting that the Halving itself may not prompt a significant rally before or immediately after the event. 

Deutsche Bank analysts share this sentiment, highlighting that substantial price increases have typically occurred in the run-up to previous Halvings rather than immediately after them.

Another factor to consider is the increased production costs for Bitcoin miners resulting from the Halving. As the mining reward decreases, participating in the mining process becomes less profitable. 

This has historically led to a decline in the hashrate, the total computational power used for Bitcoin mining. JPMorgan analysts predict that production costs could rise to an average of $42,000 after the Halving.

One JPMorgan analyst wrote, “This estimate is also the level we envisage Bitcoin prices drifting towards once Bitcoin-Halving-induced euphoria subsides after April.”

While these factors may influence short-term price movement, historical data reveals that the price of Bitcoin has experienced significant increases in the year following previous Halvings. 

The respective price gains for the three previous halvings were 8,760%, 2,570%, and 594%. However, it’s important to note that each successive halving has a diminishing impact on the new supply of Bitcoin.

Mining Industry Shake-Up

In the mining sector, Halving could lead to significant revenue losses, estimated to be around $10 billion annually. 

According to Fortune, publicly traded miners have taken measures to increase their resilience, diversify their offerings, and optimize their operations. However, mining stocks have faced challenges, with some experiencing significant declines.

While larger miners may undergo a period of adjustment, smaller miners and pools may be pushed offline. This could result in a wider market share for the surviving miners. 

Experts at private asset management firm Bernstein expect the mining industry to consolidate, with “smaller and less efficient players” potentially selling assets to raise capital and shore up their balance sheets. 

The increased market dominance of the surviving miners is expected to be profitable over the long term, especially with the continued structural demand for Bitcoin from ETFs.

Timing The Bitcoin Bull Market Peak

Cryptocurrency analyst Rekt Capital has provided insights into the potential timing of Bitcoin’s bull market peak based on historical Halving cycles and the current acceleration seen in the market. 

According to Rekt Capital, Bitcoin has traditionally reached its peak in the bull market approximately 518-546 days after the Halving event.

However, the current cycle has shown signs of unprecedented acceleration, with Bitcoin surpassing previous all-time highs roughly 260 days ahead of historical norms. Nonetheless, the recent “pre-Halving retrace” has slowed down the cycle by around 30 days and counting.

Taking into account this accelerated perspective, if Bitcoin’s bull market peak is measured from the moment it breaks its old all-time high, it may occur 266-315 days later. As Bitcoin achieved new all-time highs in March, this suggests a potential bull market peak in December 2024 or February 2025, according to Rekt’s analysis.

Both perspectives carry significance throughout the cycle, especially if the acceleration trend persists. However, prolonged retracements or consolidation periods can slow down the cycle, potentially pushing the anticipated bull market peak further into the future.

Bitcoin Halving

At the time of writing, BTC was trading at $64,300, up from the $59,000 mark reached in the early hours of Friday.

Featured image from Shutterstock, chart from TradingView.com 

Pre-Halving Jitters: Bitcoin Price Briefly Slips Below $60,000

The Bitcoin price has recently experienced heightened volatility, causing the largest cryptocurrency in the market to briefly drop below the significant threshold of $60,000 for the first time since March 5. 

This price decrease comes just days before the highly anticipated Halving event scheduled for Friday. This event has traditionally been viewed as a positive catalyst for Bitcoin’s value due to its impact on token supply. 

However, market participants are questioning whether the Halving’s effects are already factored into the current market conditions, leading to extended bearish sentiment.

Long-Term Bullish Outlook Prevails

Bitcoin’s decline saw it plummet by 5% to $59,890, though it recovered some losses shortly afterward. Since reaching an all-time high (ATH) of $73,700 on March 14, the Bitcoin price has now retraced by approximately 18%. 

The downward trend extended to other major cryptocurrencies, including Ethereum (ETH), Solana (SOL), and Dogecoin (DOGE), which also experienced slumps on Wednesday.

The impending Halving, a quadrennial code update in Bitcoin, has raised concerns among investors as to whether it will be a significant market-moving event or a non-event overshadowed by other factors, such as the ongoing discussions surrounding the Bitcoin ETF market, which has seen a significant decrease in terms of outflows.  

Nathanaël Cohen, co-founder of INDIGO Fund, noted that market participants are de-risking due to this uncertainty and the additional macro factor of tensions in the Middle East involving Israel and Iran, putting further pressure on risk assets.

The recent decline in Bitcoin’s price was further exacerbated by a wave of liquidations in long positions for digital assets. Last Friday alone, approximately $780 million worth of bullish crypto wagers were liquidated within 24 hours. 

Despite the recent market turbulence, some participants maintain a bullish long-term outlook for Bitcoin. Some see the recent liquidations and subsequent flushing out of leverage in the crypto market as a positive development. 

Ravi Doshi, head of markets at FalconX, reported increased buying of longer-dated call options on their derivatives desk, suggesting that clients anticipate higher prices in the latter half of the year.

Bitcoin Price Rebounds Above $61,000

Following the brief dip below the $60,000 mark, the Bitcoin price has rebounded, currently trading at $61,600. This recovery is viewed as a bullish sign, with the cryptocurrency’s macro uptrend structure remaining intact as long as price levels of $51,000 and $42,000 are maintained. 

Bitcoin price

The market is closely watching whether the theory suggesting that the Halving price catalyst is already factored into the current market conditions holds. Additionally, the performance of Bitcoin ETFs in the United States and their potential impact on driving the cryptocurrency’s price back to previous highs are of significant interest.

Furthermore, the recent approval of the spot Bitcoin ETF market in Hong Kong is expected to contribute to increased adoption of the leading cryptocurrency. Although some experts do not consider it as significant as the US ETF market, it is anticipated to generate a surge in price and further strengthen Bitcoin’s position.

Ultimately, the outcome of the Halving event, combined with the developments in both the US and Hong Kong ETF markets, remains uncertain. The ability of Bitcoin to regain its bullish momentum and drive increased demand will be closely monitored.

Featured image from Shutterstock, chart from TradingView.com

Increased Bitcoin ETF Adoption Propels BTC Dominance To Highest Level Since 2021

Bitcoin’s dominance within the cryptocurrency market has reached a three-year high, signaling strong demand for US spot Bitcoin ETF holding the largest digital asset and a challenging period for smaller tokens.

Bitcoin accounted for nearly 55% of the $2.4 trillion digital asset market at the end of last week, a level not seen since April 2021. On Saturday, in particular, BTC’s dominance jumped to 57% as it briefly touched the $67,000 mark. 

The next largest tokens by market share include Ethereum (ETH), Tether’s USDT stablecoin, Binance exchange’s native token Binance Coin (BNB), and Solana (SOL).

BTC’s Rise Fueled By Successful US Bitcoin ETF Launches

According to Bloomberg, the recent success of the recently approved US spot Bitcoin ETFs from prominent issuers such as BlackRock and Fidelity Investments has played a significant role in Bitcoin’s rise. 

These ETFs have garnered approximately $56 billion in assets, making their debut one of the most successful in fund category history.

Bitcoin

The inflows into these ETFs drove BTC to its current all-time high (ATH) of $73,798 in mid-March, a clear resistance level for the largest cryptocurrency on the market, as evidenced by its inability to consolidate above the $70,000 level following this achievement. 

Although BTC is down about 6% since then, smaller digital assets such as Avalanche (AVAX), Polkadot (DOT), and Chainlink (LINK) have seen more significant declines of nearly 30% over the past month. 

This drop coincided with reduced expectations for looser US monetary policy settings, often fueling speculative gains.

Hong Kong-Listed ETFs Boosts Bitcoin And Ethereum

Institutional investors’ allocations to the US Bitcoin ETF have greatly influenced Bitcoin’s performance relative to the rest of the market. Benjamin Celermajer, director of digital-asset investment at Magnet Capital, noted that strong institutional demand is a key driver.

On Monday, Bitcoin and Ethereum, the second-largest cryptocurrency, saw notable price jumps following indications that asset managers are preparing to launch Hong Kong-listed ETFs on both tokens. Bitcoin rose 4.3% to $66,575, while ETH jumped 6.2% to $3,260. 

These rallies had a positive impact on the broader crypto market, lifting other notable tokens such as Polygon (MATIC), Cardano (ADA), the dog-themed meme coin Dogecoin (DOGE), and Solana, which is now the top 5 cryptocurrency market winner, up over 8% on Monday.

Interestingly, the Bloomberg Galaxy Crypto Index, which measures the performance of the largest digital assets traded in US dollars, has more than tripled since the beginning of last year, marking a significant rebound from the bear market experienced in 2022.

Lastly, investors and traders eagerly anticipate the upcoming Bitcoin Halving, an event that will cut the new supply of the token in half, expected around April 20th. 

Previous Halving events have acted as a tailwind for prices, although there are growing doubts about whether history will repeat itself given BTC’s recent all-time high achievement. 

Bitcoin ETF

BTC has successfully maintained its position above the $66,000 threshold and has consolidated in this range. However, it is important to note that losses have accumulated over longer time frames. 

Over the past fourteen and thirty days of trading, the cryptocurrency has experienced significant declines of over 21% and 24% respectively.

Featured image from Shutterstock, chart from TradingView.com

Is The Bull Run Nearing its End? Marathon CEO Asserts Bitcoin ‘Halving’ Rally Already Priced In

In anticipation of the upcoming Bitcoin Halving event, which is expected to occur later this month, Marathon Digital CEO Fred Thiel believes that the price impact may already be factored into the market to a certain extent. 

Thiel shared his insights in a recent interview with Bloomberg, in which he discussed the potential catalysts for further price increases and their implications for the mining industry.

Bitcoin Halving Impact Mitigated By ETF Surge? 

The “halving” event, a software code update that occurs approximately every four years, is often regarded as a key driver of Bitcoin’s price appreciation. The update will reduce the block reward for miners by half, meaning they will receive fewer Bitcoins as a reward for validating transactions on the blockchain. 

However, Thiel noted that the impact of The Halving may not be as significant this time, as the recent approval of Bitcoin exchange-traded funds (ETFs) has already attracted substantial capital to the market. Thiel explained: 

The ETF approval, which has been a huge success, has attracted capital into the market and essentially brought forward what could have been the price appreciation we typically would have seen three to six months post-halving. So I think we are seeing part of that now already and that has put forward some of the demand.

While the halving event is expected to reduce the daily supply of new Bitcoins by approximately 450, Thiel believes the price impact may be relatively modest. 

However, the Marathon CEO expressed excitement about the positive price trend leading up to the halving, stating: 

As miners, we are very excited to go into a halving, where for once prices have not declined prior to the halving rather prices have gone up so everybody is obviously maximizing to that.

Balancing ETF Inflows And Previous Halving Patterns

Thiel’s observations come amidst the noteworthy inflows into Bitcoin ETFs, which have amassed nearly $12 billion in just three months of trading in the United States. 

While these inflows may have contributed to the current price appreciation, historical data reveals that Bitcoin still possesses considerable growth potential leading up to The Halving.

To gain a comprehensive understanding, it is crucial to examine the recent surge in Bitcoin’s value, which has soared by nearly 370% from its bear market low of $15,400 to an all-time high (ATH) of $73,700 on March 14, 2024. 

In conjunction with this surge, past halving events provide valuable insights into Bitcoin’s price movements and the likelihood of surpassing the significant milestone of $100,000.

During the first halving in November 2012, Bitcoin’s price experienced a remarkable surge from a low of $13 to a peak of $1,152 the following year, illustrating an impressive increase of 8,753%. 

Similarly, the second halving event in July 2016 witnessed Bitcoin’s price ascending from $664 to a new ATH of $17,760, reflecting a surge of 2,580% after the halving. 

The most recent Halving event in May 2020 saw Bitcoin’s price reach a significant milestone of $67,000, surging from a low of $9,730, which accounted for a substantial increase of 593% following the halving.

In perspective, while the potential scenario outlined by Thiel suggests that The Halving may be partially priced in due to the influence of ETF inflows, historical patterns suggest that Bitcoin still has plenty of room to run before the event. 

Several market pundits have also set their price targets for this bull run at the coveted $100,000 level in light of the upcoming halving event.

However, it remains to be seen how the price of Bitcoin will react, taking into account factors such as the influx of capital through ETFs, historical data, and potential market dynamics.

Bitcoin halving

Currently, BTC is trading at $68,400, down 0.4% from yesterday’s price. 

Featured image from Shutterstock, chart from TradingView.com 

Ethena’s (ENA) Crucial Role In Bitcoin Bull Market: Expert Identifies Critical Factors For Sustainable Growth

The recent volatility in the Bitcoin (BTC) price and its struggle to consolidate above the $70,000 mark has raised questions about the sustainability of its ongoing bull run.

However, market expert Charles Edwards, co-founder of Capriole Invest, believes that the decentralized finance (DeFi) protocol Ethena Labs (ENA) could significantly extend and boost Bitcoin’s bull market to new heights. 

In a recent post on social media site X (formerly Twitter), Edwards suggested that Ethena’s actions, such as constraining over-leverage in derivatives markets and reducing spot supply, can propel Bitcoin’s price higher for a longer period.

Bitcoin Bull Market Boost

To provide further context as to why Edwards is suggesting this possibility, on April 4th, Ethena Labs announced its intention to engage in a cash-and-carry trade involving Bitcoin. 

According to the protocol’s announcement, Ethena Labs can manage risk and provide a more stable backing for its product by buying and shorting Bitcoin. 

One of the key factors Edwards highlights is Ethena’s ability to constrain over-leverage in Bitcoin derivatives markets. By doing so, Ethena aims to prevent excessive risk-taking and potential market instability. 

Additionally, Ethena’s taking spot supply off the market can reduce selling pressure, thus supporting Bitcoin’s price and prolonging the bull market.

The protocol also noted that Bitcoin derivative markets offer superior scalability and liquidity compared to Ethereum (ETH). This characteristic reportedly makes Bitcoin a suitable asset for delta hedging, a risk management strategy employed by Ethena. 

With $25 billion of Bitcoin open interest available for Ethena to delta hedge, the capacity for its synthetic dollar product, USDe, to scale has increased significantly. Ethena Labs noted in their announcement the following:

In just 1 year, BTC open interest on major exchanges (exc. CME) has grown from $10bn to $25bn, while ETH OI has grown from $5 to $10bn BTC derivative markets are growing at a faster pace than ETH and offer better scalability and liquidity for delta hedging

Weighing The Risks

While Edwards’ statement is optimistic about Ethena’s impact on Bitcoin’s bull market, one user raised concerns about potential downsides. Edwards acknowledges that execution risks, such as custody failure or delta neutrality failure, could have adverse effects. 

Edwards identifies custody risk as the most significant risk in this context. However, he highlights that any negative impacts will likely be short-lived, and market forces will ultimately dictate Ethena’s net annual percentage yield (APY).

In short, by limiting over-leveraging in future markets and reducing spot supply, Ethena could significantly support the price of BTC and extend the current bull run.

Bitcoin

Currently, BTC’s price has experienced a significant decline, plummeting to the $68,800 level. This marks a 4.3% decrease compared to Monday’s price.

In parallel, Ethena’s native token, ENA, has also followed the overall downtrend of the market, reflecting BTC’s price movement with a 4% decrease. Presently, ENA is trading at $1.22.

Featured image from Shutterstock, chart from TradingView.com 

Bitcoin Q1 Performance Digest: 70% Price Surge, Inflows Into ETFs, And Expansion Of Layer TVL Revealed

Bitcoin (BTC) has shown an impressive performance in the first quarter (Q1) of 2024, as highlighted in a recent report by market intelligence data research firm Messari. The research firm finds key factors contributing to Bitcoin’s price increase, market cap dominance, and the emergence of new trends in the cryptocurrency ecosystem.

Inscription Activities Drive Bitcoin Fees Up

Analyzing the key figures detailed in the report, Bitcoin’s price experienced a significant increase in Q1 2024, rising 68.78% quarter-over-quarter (QoQ) to reach an all-time high (ATH) of $73,100. 

This price increase propelled Bitcoin’s market cap dominance to 49.7% in March 2024. Interestingly, the research firm notes that such dominance is a typical feature at the start of a new halving cycle, with Bitcoin often leading the way for other cryptocurrencies.

Bitcoin

Another relevant figure is the inscription activity in Q4 2023, which drove fees up by 699.4% QoQ. However, in Q1 2024, subscription-related fees decreased by 41.9%. Despite declining total fees, inscription-related transactions still accounted for 18.4% of Bitcoin’s total fees, demonstrating their continued relevance.

Average daily transactions and daily active addresses also experienced a decline of 15.3% and 4.7% QoQ, respectively. The report suggests that the decline in transaction activity may be attributed to decreased activity from bots or “super users.” This shift aligns with the decrease in inscription-related activities and fees. 

Inscription-related activity initially surged in February 2023, leading to a considerable transaction increase. Although Q1 2024 witnessed a decline in inscription-related activity QoQ, it remained significantly higher year-over-year (YoY), indicating its continued impact on the network

ETFs Amassed 212,000 BTC In Q1

Messari highlights that Q1 2024 showed the growth of programmable layers in the cryptocurrency ecosystem. Established layers such as Rootstock and Stacks led the way regarding total value locked (TVL), while newer layers such as BOB and Merlin experienced rapid growth. 

TVL’s 127% QoQ growth was primarily in non-BTC assets, as Bitcoin-locked amounts lagged behind the Lightning Network and alt-L1 networks, which host significant amounts of BTC.

Ultimately, the approval and launch of nine spot ETFs and one ETF conversion marked a significant milestone for Bitcoin’s legitimization by the US government and traditional finance (TradFi). 

The report notes that these ETFs garnered over $12 billion in inflows within the first month. Notably, BTC ETFs surpassed silver ETFs in assets under management (AUM) but still lagged behind gold ETFs. 

Bitcoin

Institutional BTC holdings were also surpassed by MicroStrategy, the largest institutional holder, with 215,000 BTC. The ETFs accumulated 212,000 BTC in inflows during Q1, further establishing Bitcoin’s prominence in the financial markets.

Bitcoin’s exceptional performance in Q1 2024, marked by a significant price increase and market cap dominance, has solidified its position as the leading cryptocurrency. 

Anticipation for the supply halving, along with the success of BTC ETFs and institutional inflows, has contributed to Bitcoin’s growth and recognition in traditional finance. 

Bitcoin

Featured image from Shutterstock, chart from TradingView.com 

FOMO Gives Way To Fear: Bitcoin-Ethereum Ratio Signals Shift In Crypto Sentiment

The recent ratio between Bitcoin (BTC) and Ethereum (ETH) prices suggests a potential decline in risk appetite within the crypto market. The ratio has reached its highest level since April 2021, indicating a stronger demand for Bitcoin than its smaller rival, Ethereum.

This development has led crypto asset trading firm QCP Capital to speculate that this shift in the ratio could be an early indication of a transition from “fear of missing out” (FOMO) to outright fear. 

Bitcoin And Ethereum Performance

Regarding recent market trends, the second quarter of 2024 has begun with relatively subdued activity. Bitcoin’s price has dipped below the $70,000 mark and has remained range-bound between $65,000 and $68,000 for the past few days despite briefly touching the $70,000 mark on Monday. 

According to QCP’s analysis, the inflow of funds into the spot Bitcoin Exchange-Traded Fund (ETF) market has not been substantial enough to drive significant price movements in either direction. 

As a result, the company has observed that funding rates have stabilized, and the front end of the forward curve has declined from previous highs of 50% to less than 20% currently.

Interestingly, while the front end of the forward curve has decreased, the back end remains elevated. This has led to interest in rolling spot-forward basis positions further out, potentially driven by the continued demand for long-dated Bitcoin calls extending into 2025.

Bitcoin

On the other hand, Ethereum’s performance has been relatively weak. QCP also notes that the ETHBTC ratio cross-tests a critical support level after breaking below 0.05. Notably, there has been sustained selling of Ethereum calls, resulting in lower volatility and downward pressure on the price.

Ultimately, QCP finds that these developments are prompting speculation as to whether this could be an early sign of FOMO turning into fear, particularly about Ethereum’s role as a proxy for altcoins.

While Bitcoin may find support from topside demand and ETF inflows, Ethereum’s performance and its impact on altcoins will be important factors to watch closely.

Will BTC Experience A Double-Top?

Renowned crypto analyst Crypto Con has raised an intriguing question about whether BTC is poised for a double top similar to the patterns observed in 2013 and 2021.

Analyzing previous market cycles, Crypto Con highlights that more evident double tops, such as those witnessed in the first and third cycles of 2021, triggered significant initial surges on the Fisher Transform indicator. 

In contrast, the 2017 double-top formation showed a more subtle initial rise in June. Notably, all final cycle tops ended with a regular bearish divergence, where the price reached higher levels while the indicator declined, as seen in the chart below.

Bitcoin

Currently, Bitcoin is approaching levels similar to those seen in 2017, as seen in the lower part of the chart. Crypto Con suggests that if the Fisher Transform indicator can consolidate around these levels without spiking to the line seen in 2013 and 2021, it could indicate a higher likelihood of a single top formation, which is the analyst’s most likely outcome, for December 2024, marking the top of this cycle.

Featured image from Shutterstock, chart from TradingView.com 

Bitcoin Price Plummets As US Government Transfers $2B In Seized Silk Road BTC, Coincidence?

The crypto market is abuzz with speculation as the US government recently moved significantly regarding seized Bitcoin (BTC) linked to the infamous Silk Road dark web marketplace. This development comes at a critical time for the Bitcoin price, which has struggled to maintain its position above the $70,000 threshold after hitting its current all-time high (ATH) of $73,700 on March 14. 

As the largest cryptocurrency experiences yet another round of price correction, the movement of these seized funds has triggered intense speculation about a potential sell-off by the US government.

Seized Silk Road BTC On The Move

According to on-chain data, a wallet linked to the US government recently transferred 30,175 Bitcoin, seized from the Silk Road dark web marketplace. 

This transfer follows the earlier seizure of over 50,000 Bitcoin from James Zhong, who illegally obtained the cryptocurrency from the Silk Road in 2012. The US Department of Justice’s (DOJ) seizure of these funds marked the largest cryptocurrency seizure in its history.

Bitcoin price

This is not the first instance of the US government moving Bitcoin obtained from criminal cases. In March 2022, the government sold 9,800 Bitcoin, with plans to sell an additional 41,500 BTC. However, the recent transfer of the 30,175 BTC from Silk Road-related addresses has raised questions about the fate of these funds and their potential impact on the Bitcoin price correction. 

Benjamin Skew, an on-chain data expert, took to social media to offer insights into the situation. Skew clarified that although there is chaos surrounding the Silk Road Bitcoin being sent to Coinbase for sale, a closer examination reveals that the main funds were transferred to a newly created wallet that remains inactive. 

However, Skew stated that 2,000 BTC of the total amount was transferred to the alleged Coinbase wallet for undisclosed purposes, while the rest was sent to a newly created wallet. 

200EMA Support Crucial For The Bitcoin Price

The Bitcoin price is currently witnessing a lack of bullish momentum as the cryptocurrency continues to face resistance in consolidating above the crucial $70,000 threshold. However, there is still hope on the horizon. 

Crypto analyst Ali Martinez highlights the importance of the 200-epimetric moving average (EMA) on the 4-hour chart of BTC. According to Martinez, this indicator has acted as formidable support since early February and continues to play a crucial role in preventing further downward movement. 

The focus on the 200EMA stems from its potential to either catalyze a rebound or trigger more losses for Bitcoin. Martinez stated that if the 200EMA continues to hold as strong support, it signifies a significant probability of a price rebound. This scenario would provide renewed bullish momentum and potentially propel Bitcoin’s price above the $70,000 mark. 

However, if the 200EMA is broken, as it was in mid-January, as seen in the chart below, the analyst suggests that this could expose the Bitcoin price to further downward pressure and potentially lead to further losses.

Bitcoin price

Bitcoin (BTC) is trading at $65,390, continuing its recent price correction. Over the past 24 hours, BTC has experienced a 5% decline; over the past seven days, it has seen a significant drop of over 6%. 

The market closely monitors whether the current key support level can sustain further price drops or if a potential bounce will occur before reaching that point. The outcome of these scenarios remains uncertain. 

Featured image from Shutterstock, chart from TradingView.com 

High-Stakes Week For Bitcoin And Ethereum As Central Bank Decisions Approach: Key Predictions

This week could mark a pivotal moment in the first quarter of 2024 for the entire crypto market and the two largest cryptocurrencies, Bitcoin (BTC) and Ethereum (ETH), as major central banks, led by the Bank of Japan and the US Federal Reserve (Fed), prepare to announce their interest rate decisions

According to crypto futures exchange Blofin, these announcements will set the tone for monetary policy in the coming months. The impact of safe-haven sentiment has led to a pullback in both BTC and ETH prices, with traders expressing greater optimism for BTC. 

Bitcoin Price Movement Range Projected At 9.78%

As per a recent on-chain analysis report released by the exchange, crypto traders are expecting BTC’s price movement range to reach 9.78% over the next seven days, with a projected 30-day range of 20.33%. 

However, despite the expected volatility, the report indicates that traders remain bullish on BTC in the medium to long term. 

Skewness analysis suggests that price declines and pullbacks are expected to induce volatility, but the duration of this round of pullback is expected to be relatively short. Risk aversion to macro uncertainty is seen as the primary trigger. 

The latest dealers’ gamma distribution supports the expected wide range of BTC price fluctuations, with gamma peaks around $65,000 and $75,000. With the quarterly settlement approaching, market makers’ influence on BTC price movement is gradually recovering, providing support during price drops but making it challenging to surpass the $75,000 level. 

Bitcoin

In addition, on-chain data shows a decline in spot investors’ enthusiasm for buying BTC, although the number of addresses holding more than 100 BTC continues to increase, as seen in the chart above. The reduced number of addresses holding over 1,000 BTC suggests that significant holders have decided to sell at BTC’s new highs. 

Despite caution over potential price fluctuations, the hedging effect contributes to the increasing possibility of BTC price stabilization, making holding BTC a favorable choice.

Bearish Sentiment Dominates Front-Month Options For Ethereum

According to the report, similar to BTC, traders expect relatively high volatility levels for ETH in the short term, with projected price movement ranges of 10% over seven days and 20.32% over 30 days. However, the report suggests that traders are less optimistic about ETH’s future performance compared to Bitcoin. 

Furthermore, Blofin finds that bearish sentiment dominates the front-month options, while bullish sentiment remains favorable in the back-months. Blofin emphasizes that expectations of rate cuts may support the ETH price, but the pricing of Ethereum tail risk indicates “increased pessimism” regarding significant events impacting the ETH price, with spot Ethereum ETFs seen as a potential trigger. 

Finally, Blofin explains that the high leverage of altcoins has long been a “source of risk” in the cryptocurrency market. The recent price decline has led to the liquidation of many highly leveraged altcoin positions, resulting in lower annualized funding rates for perpetual contracts. 

This deleveraging of altcoins, coupled with their relatively small market share of less than 20%, has helped to mitigate risk and contribute to market stability, according to the report. However, despite the overall decline in altcoin leverage, speculation in meme coins continues.

Bitcoin

At present, the price of Bitcoin stands at $62,500, reflecting a significant decline of 7.5% within the last 24 hours. Similarly, Ethereum is trading at $3,276, experiencing a 6.8% drop during the same period.

Featured image from Shutterstock, chart from TradingView.com

Post-Halving Pressure: Marathon Digital Anticipates Bitcoin Break-Even Price Of $43,000

The Bitcoin (BTC) market has been on a wild ride recently, hitting a new all-time high (ATH) before experiencing notable volatility that resulted in an 8% drop to the $65,500 level on Friday. 

Meanwhile, Marathon Digital, one of the largest US-based Bitcoin mining companies, is preparing to acquire more power infrastructure and streamline operations to meet the challenges posed by a reduction in revenue due to the upcoming April halving event

Bitcoin Miners Brace For Post-Halving Shakeout

According to a Bloomberg report, Marathon Digital plans to acquire additional power infrastructure and expand its mining capacity to keep costs low and maintain profitability. 

By optimizing operations and scaling up, Marathon aims to mitigate the impact of the impending revenue drop and secure wider margins in the post-halving landscape.

Marathon Digital recently announced an agreement to purchase a 200-megawatt data center in Garden City, Texas, for over $87 million. This acquisition marks the company’s second major investment in power infrastructure after it acquired multiple sites for $179 million earlier this year. 

By increasing its ownership of mining capacity infrastructure to 53%, up from a meager 3% in the previous year, Marathon is positioning itself for greater operational efficiency and cost-effectiveness, Bloomberg notes. 

However, post-halving, the Bitcoin mining industry is expected to undergo significant changes, with some miners facing profitability challenges and potential exits. 

Profitability Crisis Looms

Marathon Digital’s CEO, Fred Thiel, highlights the impact of revenue reduction, estimating that the industry’s average break-even point will rise from around $23,000 per Bitcoin to approximately $43,000. Thiel stated:

Post halving, there will be some miners to lose profitability, maybe challenged, or maybe looking for an exit as their revenues will drop because of the Bitcoin rewarded will drop. The simple math is, if the industry average break-even point was around $23,000 per Bitcoin, it will now go up to around $43,000.

It is worth noting that this does not necessarily mean that Bitcoin’s price will fall to $43,000 from its current trading price of $69,300. The breakeven price refers to the price at which miners like Marathon Digital can cover their operating costs and achieve profitability. It is not directly correlated to the market price of Bitcoin.

Bitcoin

As of the time of writing, BTC is trading at $69,300 and is on the verge of reclaiming the significant milestone of $70,000. The cryptocurrency experienced a notable spike in volatility during the early hours of Friday’s trading session but has since recovered, mitigating its losses from 8% down to 2.5%.

Featured image from Shutterstock, chart from TradingView.com 

MicroStrategy Increases Bitcoin Bet With $822M Purchase, Adds 12,000 BTC To Treasury

As Bitcoin (BTC) continues its unprecedented uptrend, surging to a new all-time high (ATH) of $72,300, software company MicroStrategy remains steadfast in its vision. It is reaping substantial rewards from its strategic investment in the largest cryptocurrency in the market. 

MicroStrategy, led by renowned Bitcoin supporter and former CEO Michael Saylor, recently made a major acquisition, further solidifying its position in the digital asset market.

MicroStrategy Bitcoin Investment Pays Off

According to a filing with the US Securities and Exchange Commission (SEC), MicroStrategy acquired approximately 12,000 BTC between February 26, 2024, and March 10, 2024, for approximately $821.7 million in cash. The average purchase price per Bitcoin was $68,400. 

Additionally, MicroStrategy recently completed an offering of convertible senior notes due 2030, raising $800 million in funds. With this latest acquisition, MicroStrategy’s Bitcoin holdings now stand at a staggering 205,000 BTC, acquired for $6.9 billion.

Microstrategy

MicroStrategy’s stock trades at $1,557, representing a remarkable 9% gain within 24 hours. The company’s shares have demonstrated a sustained and continuous upward trajectory since February 26, coinciding with Bitcoin’s $50,000 consolidation phase breakthrough. 

Over two weeks, Bitcoin surged to its present trading price, establishing a notable correlation between the leading cryptocurrency and MicroStrategy. This correlation has further solidified the company’s strategy and contributed to its stock’s performance.

MicroStrategy’s strategic investment in Bitcoin has yielded remarkable results. The company now boasts a profit of $7.7 billion on its Bitcoin holdings, which translates to a remarkable return of 112% so far as Bitcoin breaks new all-time highs.

ETF Expert Astounded By Bitcoin ETF Success

The rapid rise of Bitcoin Exchange-Traded Funds (ETFs) has surpassed even the most optimistic projections. Bloomberg ETF expert Eric Balchunas highlighted the growth of these funds in a recent post on social media site X (formerly Twitter). The expert noted that assets under management (AUM) surpassed $55 billion, and trading volume reached an impressive $110 billion. 

Microstrategy

Balchunas acknowledged that achieving such numbers in just two months was nothing short of “absurd,” far exceeding what would normally be considered successful even at the end of a full year.

In addition, in a surprising turn of events for the ETF expert, Blackrock’s IBIT ETF and Fidelity’s FBTC have emerged as the leaders among all ETFs in terms of year-to-date (YTD) flows through the middle of March. This unexpected feat positions these Bitcoin ETF offerings as major players in the ETF market, attracting the attention and interest of investors seeking exposure to the digital asset.

Microstrategy

Currently, BTC continues its uptrend, aiming to solidify and consolidate above the $70,000 threshold, which would put the cryptocurrency in a good position to reach the $100,000 mark in the rest of the year. 

Featured image from Shutterstock, chart from TradingView.com

BREAKING: Bitcoin Hits New All-Time High, Surging Past $70,000 For The First Time In History

Bitcoin (BTC), the dominant cryptocurrency, has made history by briefly breaking its consolidation phase and reaching an all-time high of $70,000. Despite encountering resistance near this level, Bitcoin’s market capitalization has reached $1.3 trillion, showcasing its continued upward momentum. 

However, as the cryptocurrency faces a double top in the same price zone after almost three years, it must overcome a significant hurdle to consolidate above $69,000 and pave the way for further price gains.

Bitcoin Sets New Record 

In the past 24 hours, Bitcoin experienced a 2% uptrend, propelling it to breach the $70,000 milestone for the first time. The cryptocurrency had previously reached $69,300 on Tuesday, indicating the growing strength of its upward trajectory. However, the $69,000 mark has proven to be a formidable resistance level, leading to increased volatility once breached.

Bitcoin

The double-top formation in this price zone over a three-year period adds further complexity to Bitcoin’s consolidation efforts. Breaking through this resistance is crucial for Bitcoin to establish a solid foundation for future price gains and sustainably consolidate above $70,000.

The success of Bitcoin spot exchange-traded funds (ETFs) within a short span of two months has bolstered investor confidence and generated anticipation for future price appreciation. 

With investors betting on Bitcoin’s long-term prospects, it appears to be only a matter of time before the cryptocurrency overcomes its current resistance level and continues its upward trajectory. This positive sentiment provides a favorable backdrop for Bitcoin’s potential breakthrough.

Following its brief touch of $70,000, Bitcoin experienced a rapid retracement to the $68,000 level. The timing and extent of its consolidation above the resistance mark remain uncertain. However, market observers are closely monitoring Bitcoin’s performance, anticipating a potential breakthrough that could fuel additional price gains.

Featured image from Shutterstock, chart from TradingView.com 

Bitcoin ETF Frenzy: BlackRock Smashes Expectations With $788 Million Inflows In One Day

BlackRock’s Bitcoin ETF, IBIT, achieved a remarkable milestone on March 5. Attracting a staggering $788 million, it exceeded its previous record of $612 million in inflows in a single day. This surge in investment coincided with Bitcoin reaching a new all-time high (ATH) of $69,300, surpassing its previous ATH set in 2021.

Bitcoin ETF Trading Volumes Reaches Record $10 Billion

Shortly after Bitcoin hit its new milestone, the market experienced a notable price correction, dropping below $60,000. However, this dip seemed to entice ETF buyers who saw it as an opportunity to accumulate Bitcoin at a discounted price. 

As a result, the Bitcoin price has quickly recovered and reached the $65,200 level, positioning itself for further price gains and consolidation above its ATH.

Bitcoin ETF

According to Bloomberg ETF expert Eric Balchunas, the ten Bitcoin ETFs traded a staggering $10 billion in volume on the same day, breaking the previous record set just a week ago. 

The expert noted that this surge in trading activity is not entirely unexpected, as volatility and volume often go hand in hand with ETFs. Balchunas also highlighted that several ETFs, including Blackrock’s IBIT, Fidelity (FBTC), Bitwise (BITB), and Arkham (ARKB), achieved record-breaking trading volumes.

Interestingly, while the Bitcoin ETFs experienced a surge in inflows, the Grayscale Bitcoin Trust (GBTC) continued its trend of outflows since the ETFs launched on January 11. 

Balchunas noted that GBTC has seen nearly $10 billion in outflows, yet its total assets under management remain unchanged since its launch. This phenomenon can be attributed to the bull market subsidy, wherein investors continue to hold assets despite outflows, generating revenue for the trust.

A Temporary Halt Before Further Gains?

Bitcoin’s recent price action has encountered resistance at its ATH level of $69,000, signaling a temporary rejection from this crucial point. This coincides with the activation of the Golden Ratio Multiplier, the first and only cycle top indicator to have fired thus far.

The Golden Ratio Multiplier, an indicator often used in technical analysis, has seen its cycle top band (level 5) rise to $69,099, aligning perfectly with Bitcoin’s recent peak. However, considering this is the sole indicator predicting a cycle top, some analysts, including Crypto Con, believe that a significant market correction may not have occurred yet.

Bitcoin ETF

According to Crypto Con, this current phase represents a temporary resting place for Bitcoin’s early parabolic ascent. Crypto Con suggests that once Bitcoin breaks through the ATH, it will begin a new phase characterized by heightened market activity and potential price gains. 

Bitcoin ETF

Featured image from Shutterstock, chart from TradingView.com

Deribit Exchange Expects Bitcoin To Rise 20% In The Next 30 Days, Targeting $80,000

In a significant milestone for the cryptocurrency market, Bitcoin (BTC), the largest digital asset, shattered its previous records, surging past the $69,000 mark to establish a new all-time high (ATH) of $69,300 on Tuesday. 

The achievement marked a historic moment for BTC, which hadn’t reached such levels in over two years. However, the crypto’s upward trajectory shows no signs of slowing down, with experts predicting further price gains.

Bitcoin Price And ETFs In Perfect Harmony

According to data from Deribit, an options and futures crypto exchange and analytics firm GenesisVol, BTC is anticipated to experience a potential increase of up to 20.8% within the next 30 days. 

These projections suggest that, under ideal circumstances, Bitcoin’s price could break through the $80,000 barrier. Even conservative traders are optimistic, expecting BTC to easily surpass $70,000 and reach around $75,000.

In addition, the recent approval of spot Bitcoin exchange-traded funds (ETFs) has played a pivotal role in Bitcoin’s success, suggesting that the upward trend in BTC prices, coupled with bullish sentiment among options traders and institutional and retail investors, is far from over.

Bloomberg ETF expert Eric Balchunas emphasized the significance of this development, stating that it represents a crucial moment for both Bitcoin and ETFs. Balchunas believes the surge from $25,000 to $69,000 was largely driven by hopes of ETF approval and subsequent flows. 

Bitcoin

The expert claimed that the synergy between ETFs and Bitcoin has proven mutually beneficial, as ETFs have enhanced liquidity, affordability, convenience, and standardization for investors. 

Notably, the ten-spot Bitcoin ETFs have amassed over $50 billion in assets, with a staggering $8 billion generated from flows and the rest attributed to the rising value of Bitcoin.

However, as Bitcoin reached its new peak, increased market volatility led to a liquidation surge. Journalist Colin Wu reported a sharp 5% drop in Bitcoin’s price within an hour, with Binance recording below $65,000. During this hour, liquidations amounted to a staggering $142 million. 

BTC Sell Signal

Although bullish investors are currently on cloud nine, renowned crypto analyst Ali Martinez has sounded the alarm as the TD Sequential indicator recently flashed a sell signal on the daily chart of Bitcoin.

The TD Sequential indicator, developed by market expert Tom DeMark, utilizes price patterns and sequences to identify potential trend reversals in various financial markets, including cryptocurrencies. 

Martinez emphasized the indicator’s notable track record in predicting Bitcoin’s price movements since the beginning of the year. The TD Sequential indicator issued a buy signal in early January, just before Bitcoin’s price surged 34%. 

Conversely, a sell signal was given in mid-February, followed by a 4.44% drop in the value of BTC. So, considering the previous sell signals, a potential drop towards the $62,000 price level could be in the making for the largest cryptocurrency on the market, still holding the $60,000 support, which will be key for BTC’s prospects.

Bitcoin

Featured image from Shutterstock, chart from TradingView.com

Bitcoin Proves European Central Bank Wrong: Hits All-Time High Against Euro

Bitcoin (BTC), the leading cryptocurrency, continues its remarkable bullish run, surpassing the $65,000 mark on Monday and inching closer to its all-time high of $69,000. Simultaneously, BTC has achieved a significant milestone against the Euro as economic concerns escalate across Europe. 

BTC Achieves Record Highs Against 14 G20 Currencies

Despite previous skepticism from European authorities, Bitcoin has soared to an all-time high of $60,200 against the official currency of the European Union (EU). This achievement is noteworthy, considering the Euro’s recent depreciation against Bitcoin, as depicted in the chart below.

Bitcoin

On February 22, the European Central Bank (ECB) expressed doubts about Bitcoin’s potential as a global decentralized digital currency, citing its “limited use” for legitimate transactions.

The ECB argued that Bitcoin had failed to live up to its initial promise of becoming a widely accepted payment or a reliable investment. It also highlighted the alleged “inconvenience, slowness, and high costs” of Bitcoin transactions.

The ECB further raised concerns about the “history of price manipulation” and fraudulent activities associated with Bitcoin. It attributed these issues to the absence of a “fair value” for the cryptocurrency. However, despite the ECB’s reservations, Bitcoin has experienced a surge in institutional and retail investments. 

The recent approval and success of Bitcoin spot exchange-traded funds (ETFs) have played a pivotal role, attracting inflows of over $7.3 billion to the BTC market within just two months, prompting renewed bullish sentiment in the industry.

Bitcoin’s success extends beyond its achievement against the Euro. The cryptocurrency has reportedly reached all-time highs against the currencies of fourteen G20 countries, including the Japanese Yen, British Pound, Australian Dollar, Canadian Dollar, Chinese Yuan, New Zealand Dollar, Swedish Krona, and South Korean Won. 

Bitcoin Set For Potential Surge To $200k 

Reports of an impending surge in Bitcoin’s value have sparked excitement among investors, as market expert Gert Van Lagen predicts another substantial price increase. 

With BlackRock’s renewed interest in purchasing Bitcoin and a reported scarcity of the cryptocurrency on over-the-counter (OTC) desks, conditions seem favorable for a straight pump to $100,000. Van Lagen emphasizes that with limited resistance to upward movement, the potential for exponential growth appears limitless.

The analyst suggests that continued buying by spot ETFs at a rate of $900 million per day, coupled with a shallow market depth of approximately $20-40 million, can drive significant price surges. 

Van Lagen’s analysis also suggests that based on historical cycles, once the 1.618 Fibonacci extension of the 2018 bear market is breached, Bitcoin peaks within 2-3 months at the 2.272 extension. Currently, the 2.272 extension projects a potential peak of $207,000.

Looking back at previous cycles, notable patterns emerge. 2013 Bitcoin topped within six weeks at the 2.272 extension of the 2011 bear market after breaking the 1.618 extension. 

Similarly 2017, Bitcoin peaked within three months at the 2.272 extension of the 2015 bear market, following a breakthrough of the 1.618 extension. 

Bitcoin has surpassed the 1.618 extension of the 2018 bear market in the current market. Van Lagen anticipates that Bitcoin will likely peak at the 2.272 extension of the 2018 bear market, estimated at around $200,000. 

Bitcoin

Currently, the largest cryptocurrency on the market is trading at $65,300, up over 5% in the last 24 hours and over 27% in the last seven days.

Featured image from Shutterstock, chart from TradingView.com

Bitcoin ETF Breaks Records: BlackRock’s IBIT Joins Elite ‘$10 Billion Club’ Amidst Soaring Demand

The demand for spot Bitcoin exchange-traded funds (ETFs) has surged since their recent approval on January 10, with BlackRock’s IBIT Bitcoin ETF leading the way. This ETF has reached impressive milestones in less than two months, attracting significant investor interest and opening doors for various market participants to invest in the largest cryptocurrency directly. 

As institutional and retail investors flock to these new investment vehicles, market experts predict a bullish trend and anticipate a potential price surge.

Bitcoin ETF Frenzy

According to Bloomberg ETF expert Eric Balchunas, BlackRock’s IBIT Bitcoin ETF has quickly joined the esteemed “$10 billion club,” reaching the milestone faster than any other ETF, including Grayscale’s Bitcoin Trust (GBTC), noting that only 152 ETFs out of 3,400 have crossed the threshold.

Balchunas notes that IBIT’s ascent to this club was primarily driven by significant inflows, which accounted for 78% of its assets under management (AUM). This reflects the growing appetite for Bitcoin exposure among investors seeking diversified and regulated investment options.

In particular, the current trajectory of the ETF market paints a picture of resilience and bullish sentiment in the market. Equity ETF flows, and leveraged trading levels are positive indicators, although they have not yet reached the euphoria seen in 2021, Balchunas notes. 

However, Bloomberg’s new BI ETF Greed/Fear Indicator, which incorporates various inputs, highlights the optimistic outlook shared by ETF investors, as seen in the chart below.

Bitcoin ETF

On this matter, crypto analyst “On-Chain College” went to social media X (formerly Twitter) to emphasize the significant demand for Bitcoin as evidenced by its rapid departure from exchanges. 

In its analysis, On-Chain College highlights that Bitcoin ETFs buy approximately ten times the daily amount of BTC mined. At the same time, the upcoming halving event will further reduce the mining supply. The analyst predicts when demand will exceed available supply, leading to potential upward price pressure.

Highest Monthly Close Since 2021

Bitcoin’s recent market performance has caught the attention of wealth manager Caleb Franzen, who highlights the significance of the highest monthly close since October 2021. 

Franzen further emphasizes the bullish momentum by pointing out that the 36-month Williams%R Oscillator has closed above the overbought level for only the fourth time in history. Historical data reveals impressive returns following such signals, indicating the potential for substantial gains in the coming months. 

Bitcoin ETF

Additionally, Franzen notes the changing dynamics of the market, with increased institutional participation and the ease of retail onboarding through ETFs.

Franzen presents a compelling case for the bullish nature of overbought signals, urging market participants to view them as momentum indicators rather than signals to fade. Previous instances of overbought signals have resulted in significant Bitcoin price appreciation:

  • February 2013: +3,900% in 9 months
  • December 2016: +1,900% in 12 months
  • November 2020: +260% in 12 months

While acknowledging diminishing returns in each cycle, Franzen highlights the unprecedented level of institutional participation and the ease of retail access through ETFs. 

Even if Bitcoin were to match the +260% gain from the November 2020 signal, it would reach a price of $180,000, surpassing Franzen’s minimum cycle target of $175,000. 

Ultimately, Franzen notes that bull markets are typically characterized by a rising ETHBTC ratio and a falling BTC.D (Bitcoin dominance). While these characteristics have yet to manifest fully, Franzen suggests that a multi-quarter rally in the broader cryptocurrency market may be on the horizon.

Bitcoin ETF

Featured image from Shutterstock, chart from TradingView.com 

Bitcoin Maximalist Forecasts ‘God Candle’ Formation Propelling BTC To $100,000

Bitcoin (BTC) has witnessed a remarkable ascent, surpassing the $57,000 mark and recording a year-to-date surge of over 142%. The cryptocurrency’s market capitalization has also surged towards $1.14 billion, reaching levels not seen since December 2021. With the previous all-time high (ATH) of $69,000 within sight, the bullish sentiment surrounding Bitcoin is becoming increasingly evident.

Setting Eyes On $100,000 And $200,000.

Prominent Bitcoin maximalist Max Keiser, known for his optimism even during the harshest bear markets, has suggested the possibility of a “God Candle” scenario given the current market conditions.

To provide further context, this term describes a vast and powerful candlestick pattern on a price chart that indicates a significant and sudden price movement. According to Keiser, if such a pattern were to emerge, it could propel Bitcoin toward the $100,000 price level, shattering its previous record. 

Traders and analysts interpret a “God Candle” as a highly bullish signal, reflecting robust buying pressure and the potential for a trend reversal or continuation. It often signifies a notable shift in market sentiment and catalyzes further price appreciation.

Adding to the optimistic outlook for Bitcoin, crypto analyst Gert van Lagen has projected a target of $200,000 for BTC. Analyzing the 1-week chart, van Lagen notes that Bitcoin’s price has been following a “parabolic trajectory” since November 2022 and is on track to reach $200,000 soon. 

According to the analyst, this parabolic pattern aligns with the previous fifth sub-waves that have historically similarly intersected the blue trendline, as seen in the chart below. 

Bitcoin

Notably, van Lagen points out that a breach of the 78.6% Fibonacci retracement level, which Bitcoin has already crossed, tends to trigger an immediate parabolic spike.

Finally, the analyst highlights the rising risk-on sentiment in the stock market and the strong correlation between Bitcoin and the S&P 500 since late 2021 as additional support for this bullish forecast.

Bull Market Cycle For Bitcoin Until 2025?

Renowned market expert Peter Brandt revised his Bitcoin price target in a recent post on social media X (formerly Twitter), raising it from $120,000 to $200,000. 

Brandt attributes this adjustment to Bitcoin’s recent breakthrough above the upper boundary of a 15-month channel, indicating a potential bull market cycle until August or September 2025. However, the analyst says a close below last week’s low of $50,600 would invalidate this interpretation. 

As Brandt points out, the $50,600 price level represents a 1-week resistance level for the largest cryptocurrency on the market, which, in the event of a price correction, as has historically happened whenever a sudden price spike occurs in BTC’s price action, Bitcoin would likely retest the $49,900 support level on its weekly chart. A drop towards $47,000 could be imminent in a more extreme scenario.

Bitcoin

However, with Bitcoin currently trading at $56,800, up 4.2% in the last 24 hours, its bullish uptrend seems far from over, potentially leading to a parabolic continuation of its price, as van Lagen and other analysts suggested.

Featured image from Shutterstock, chart from TradingView.com

Fidelity Director Analyzes Bitcoin Potential: Could It Hit $6 Trillion Market Cap?

In recent years, the debate surrounding Bitcoin’s (BTC) potential market share relative to gold has garnered significant attention, as recently approved Bitcoin Exchange-Traded Funds (ETFs) can bring Bitcoin significantly closer to gold in key metrics.

Jurrien Timmer, Director of Global Macro at Fidelity Investments, has put forward an analysis that sheds light on this subject. By examining the value of “monetary gold” and Bitcoin’s market capitalization, as well as considering the impact of halvings on Bitcoin’s supply, Timmer presents insights into the future dynamics of these two assets. 

Gold Vs Bitcoin

Timmer’s analysis begins by estimating the share of gold held by central banks and private investors for monetary purposes, excluding jewelry and industrial usage. While this estimation is not exact, based on data from the World Gold Council, Timmer suggests that monetary gold accounts for approximately 40% of the total above-ground gold.

Drawing upon his previous calculations, Timmer posits that Bitcoin has the potential to capture around a quarter of the monetary gold market, with monetary gold valued at around $6 trillion and Bitcoin’s market capitalization at $1 trillion.

Timmer further delves into the impact of Bitcoin halvings on its price. Historically, halvings have had a substantial effect on Bitcoin’s value. However, Timmer raises the hypothesis that diminishing returns may occur in the future as the incremental supply of new Bitcoin decreases.

By comparing the outstanding supply and incremental supply of Bitcoin with those of gold, Timmer demonstrates that the diminishing impact of the halvings is likely to be more pronounced in the future. 

As the number of coins available for mining dwindles, the influence of each subsequent halving event on Bitcoin’s price may diminish. This insight prompts Timmer to explore alternative ways to project Bitcoin’s price trajectory.

BTC’s Price Projections

To account for the diminishing impact of halvings, Timmer introduces the concept of a modified Stock To Flow (S2F) curve. This curve is derived by overlaying an asymptotic supply curve, representing the percentage of coins mined relative to the final supply cap, onto the original S2F curve.

Timmer proposes using a regression formula incorporating PlanB’s original S2F curve and the asymptotic supply curve as independent variables. This modified S2F curve aligns more closely with the supply dynamics of gold, reflecting a scenario in which Bitcoin’s scarcity advantage continues, but its impact on price gradually diminishes over time.

Bitcoin

Using the modified S2F model and considering the supply characteristics of gold, Timmer generates hypothetical price projections for Bitcoin that place the cryptocurrency at approximately $100,000 by the end of 2024.

According to Timmer, if Bitcoin were to capture a quarter of the monetary gold market, it would represent a remarkable shift in the global distribution of wealth, which would gradually drive up the cryptocurrency’s price over the coming years.

Bitcoin

Featured image from Shutterstock, chart from TradingView.com

Bitcoin All-Time High Ahead: Historical Pattern Signals 50% Chance Of Reaching $100K By August

Bitcoin (BTC), the world’s largest cryptocurrency, has surged to a 26-month high, reaching $52,000 and reigniting predictions of surpassing its previous all-time high (ATH) of $69,000. 

The market has experienced a resurgence of bullish sentiments, fueled further by the recent adoption of Bitcoin spot exchange-traded funds (ETFs). These have spurred notable growth within just one month of approval by the US Securities and Exchange Commission (SEC).

Bitcoin Poised For A Major Breakout? 

Investment manager and market expert Timothy Peterson, who recently made a bold claim on social media platform X (formerly Twitter), reinforces Bitcoin’s renewed optimism. 

Peterson stated that Bitcoin had achieved an almost exact 100% gain in 180 days, a feat that has occurred 41 times since 2015. In 78% of these instances, Bitcoin reached even higher price levels. 

Furthermore, Peterson’s analysis of historical data suggests that the average return for the next 180 days after such a gain was also approximately 100%.Based on this historical pattern, Peterson asserts that there is a 50% chance Bitcoin will reach the significant milestone of $100,000 by August. 

However, despite this possibility, as the halving event approaches, there could be another correction that, while not putting the bull run in jeopardy, could trigger significant liquidation rates as the hype surrounding the current uptrend mounts.

Pre-Halving Correction Looms

The upcoming halving event scheduled for April, combined with historical patterns, suggests that Bitcoin may experience one final correction before the bull run resumes, presenting a crucial moment for investors.

Crypto analyst Rekt Capital emphasizes the significance of a pre-halving retrace, noting that historically, it tends to occur only a few weeks before the actual halving event. 

Looking back at previous halvings, such retracements have ranged from -38% in 2016 to -20% in 2020. Based on these patterns, a retracement of around 27% is possible in the current market scenario.

Bitcoin

If a retracement of this magnitude were to occur, it would place the Bitcoin price at approximately $37,900, as indicated in Rekt Capital’s pre-halving retrace chart. This level represents an important threshold for investors to accumulate the cryptocurrency before the next phase of the halving event and the anticipated bull run rally.

Key Resistance For BTC’s Trajectory

Bitcoin’s continued rise has brought its price to a critical juncture, with the current trading level of $52,100 catching the attention of the founders of blockchain data and intelligence platform Glassnode.

According to their analysis, historical data reveals that the $52,000 level has acted as a formidable resistance point on the weekly chart, making it a crucial threshold for Bitcoin’s trajectory. 

The platform’s founders suggest that a successful breach of this level could trigger a surge of buying pressure, potentially leading to a Fear of Missing Out (FOMO) scenario among investors.

Bitcoin

Overall, the future direction of BTC price remains uncertain, leaving investors to ponder whether the current uptrend will be sustained or if a potential pre-halving retrace will occur before resuming its upward trajectory to surpass its previous all-time high and reach the coveted $100,000 level.

Featured image from Shutterstock, chart from TradingView.com