Is Bitcoin Bull Run Coming Soon? What Network Fundamentals Say

Here’s what the Bitcoin network fundamentals have to say regarding whether the cryptocurrency could see a bull run soon or not.

Monthly Average Bitcoin New Addresses Have Shot Up Recently

In a new post on X, analyst Ali discussed the possibility of a bull run starting soon for the cryptocurrency. According to the analyst, “a bull run is often characterized by increased on-chain activity.”

To measure the activity, Ali has used the “new addresses” metric, which keeps track of the total number of new addresses coming online on the Bitcoin blockchain every day.

When the value of this metric is high, it means that many users have joined the network during the past day. This could suggest that the cryptocurrency is observing high adoption right now.

On the other hand, low values imply not many newcomers are currently attracted to the blockchain, potentially a sign of a lack of interest in the market around the coin.

Now, here is a chart that shows the trend in the Bitcoin new addresses, as well as the 30-day and 365-day simple moving averages (SMAs) of the indicator over the past few years:

Bitcoin New Addresses

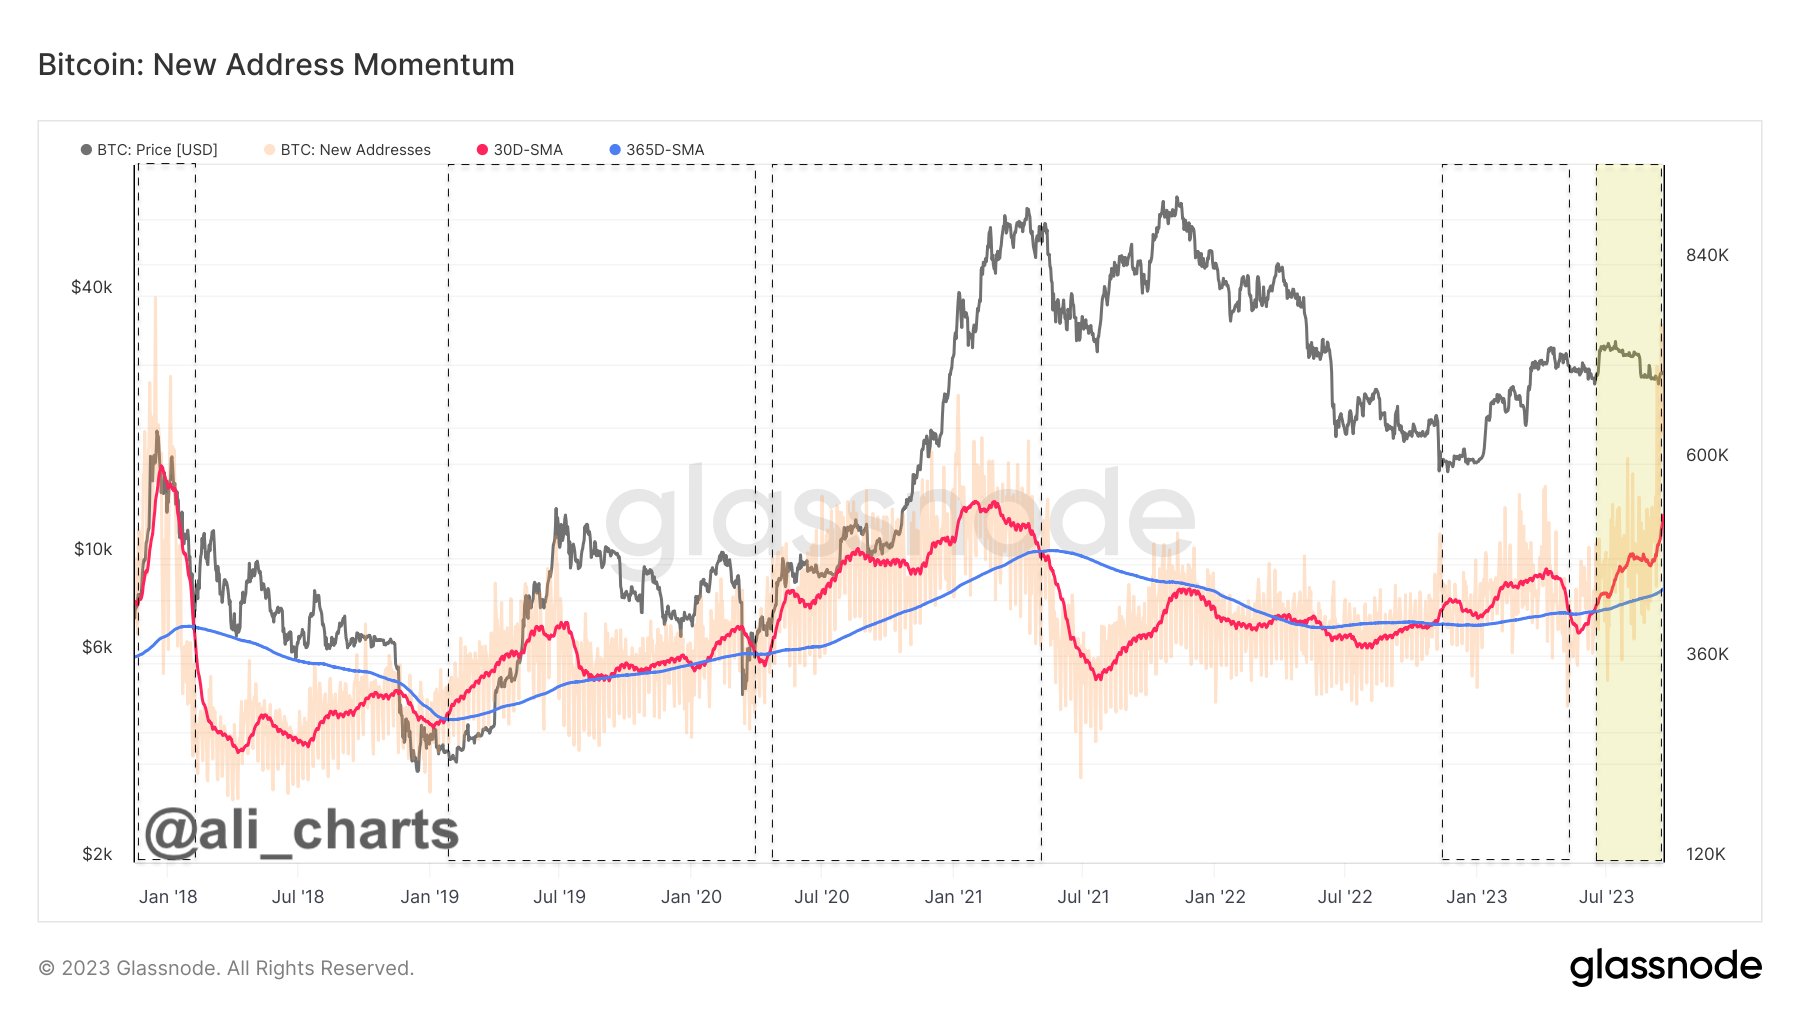
The increased activity, which may be associated with a bull run, can be “spotted when the monthly average of new wallets (red) surpasses the yearly average (blue), which indicates strengthened network fundamentals and increased use,” as explained by the analyst.

The graph shows that the 30-day SMA of the Bitcoin new addresses had been under the 365-day SMA during the bear market, but with the rally this year, the former had managed to break above the latter.

The reverse cross had happened during the slowdown in May-June, but as the subsequent rebound in the price had occurred, the monthly average new addresses had broken back above the yearly average, and it has since stayed there.

Recently, despite the struggle in the price, the 30-day SMA of the metric has only continued to rise sharply. This could naturally be a constructive sign for the asset, and going by historical precedence, it may even mean a return toward bullish momentum.

The lead on-chain analyst at Glassnode, @_Checkmatey_, however, has replied to Ali’s post, saying, “with the advent of ordinals, it is always a great idea to pair ‘addresses,’ and ‘transactions’ metrics with ‘volume’ metrics.”

Ordinals” here refer to inscribing data directly into the Bitcoin blockchain. They are utilized in various applications, including making non-fungible tokens (NFTs) on the network.

Such chain applications can skew the address-related metrics, as new ones may be created solely for using the blockchain in this way and not for actually trading the coin itself.

The Glassnode lead explains that they assign a slightly higher weight towards the volume metrics because the Ordinals-related transactions don’t involve much volume.

Bitcoin Exchange Volume

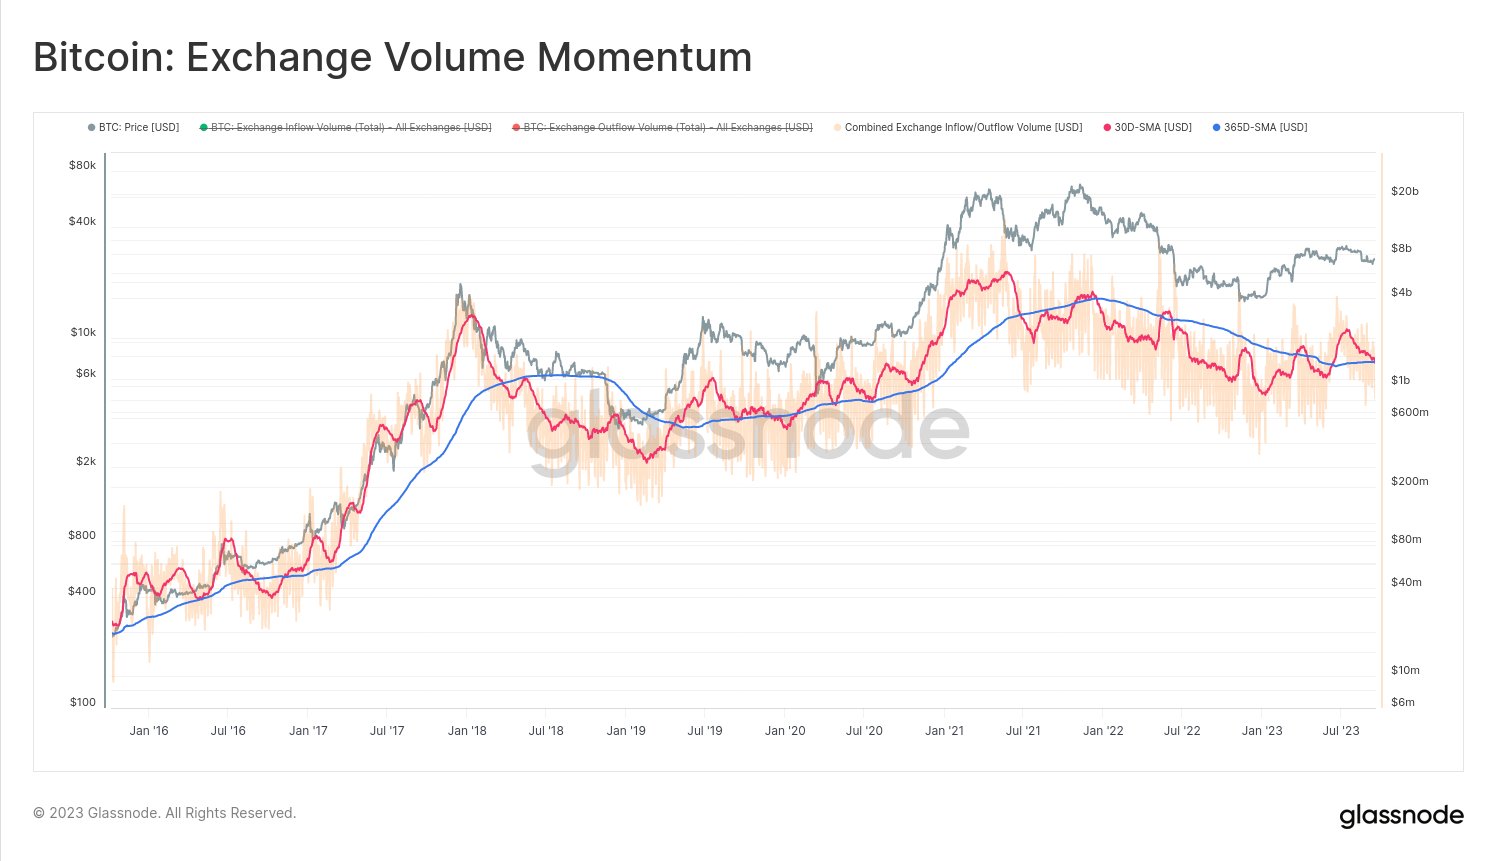
Unlike the new addresses metric, the bullish pattern isn’t yet forming for the exchange volume (which includes both inflows and outflows). This would suggest that the activity on the network may not be at a bull run stage right now.

BTC Price

At the time of writing, Bitcoin is trading at around $27,000, up 3% over the past week.

Bitcoin Price Chart

Altcoin Exchange Dominance Rises To 50%, What Does It Mean For Bitcoin?

Data shows the altcoin dominance by volume on exchanges has now risen to 50%, here’s what happened to Bitcoin the last two times the crypto market saw such a shift.

Altcoins Are Now Contributing To 50% Of The Volumes On Exchanges

As pointed out by an analyst in a CryptoQuant post, altcoins have started to dominate after Bitcoin was number one for an entire month.

The relevant indicator here is the “trading volume,” which is a measure of the total amount of coins being traded on centralized exchanges.

The percentage to this total trading volume being contributed by an individual crypto is called its “dominance by volume.”

Here is a chart that shows how the Bitcoin, Ethereum, and altcoin dominances have stacked up against each other during the last month:

Bitcoin Vs Altcoin Trading Volume

The value of the metric seems to have declined for BTC in recent days | Source: CryptoQuant

As you can see in the above graph, Bitcoin had the largest individual share for much of the past month, but that has changed during the last few days.

BTC’s dominance of the trading volume dropping off has given more room to the altcoins, who now contribute to around 50% of the volumes on exchanges.

As for Ethereum, the crypto’s volume hasn’t observed any significant shifts recently, with the coin’s dominance moving sideways just below the 30% mark.

During the past year, there have been two stretches where altcoins have enjoyed a similar dominance. The below chart shows how the price of Bitcoin behaved while these periods lasted.

Bitcoin Decline Due To Altcoins

Looks like the altcoin dominance reached as high as 60% during these stretches | Source: CryptoQuant

From the graph, it’s apparent that the first of these altcoin dominated periods occurred back between November 2021 and January 2022. At the start of this timespan, the price of Bitcoin was around $67k, but by the end of it the crypto had declined to just $36k.

The second spell of high altcoin volume took place between April and June of this year, and much like the in first stretch, BTC observed a significant drawdown as its price went from $47k all the way down to $20k.

If the altcoins continue their recent surge in trading dominance on exchanges, and a similar trend as during these previous instances follows now as well, then it may prove to be troubling times for Bitcoin.

Bitcoin Price

At the time of writing, Bitcoin’s price floats around $19.3k, down 1% in the last week. Over the past month, the crypto has gained 1% in value.

Bitcoin Price Chart

BTC continues to be stuck in consolidation | Source: BTCUSD on TradingView
Featured image from Traxer on Unsplash.com, charts from TradingView.com, CryptoQuant.com

Wash Trading Dominates Bitcoin Volume, What Does This Mean For Price?

The daily bitcoin trading volumes come out into billions of dollars every day, with hundreds of thousands of daily transactions being carried out. It is one of the reasons why bitcoin draws the most investors, given such high trading volume and good depth across all exchanges. However, some on-chain analyzers have been diving into the blockchain to explore the daily BTC volume, and the findings of this study have been alarming.

More Than 50% Fake Volume

Mostly, in the present market, there is always some amount of volume for digital assets that are actually fake. These fake trading volumes are to make a digital asset look better than they actually do to make other investors put money into them. Smaller-cap altcoins are usually guilty of this to a large extent, but it seems the largest cryptocurrency by market cap is not left out of this. 

Bankless Times carried out a study into the daily bitcoin volume for the year 2022 and found that the majority of the volume was actually fake. The study showed that 51% of bitcoin volume across various exchanges was actually a result of wash trading.

BTC maintains above $20,200 | Source: BTCUSD on TradingView.com

For those who do not know, the act of wash trading an asset is illegal because it creates a false narrative about that asset to make investors put their money into it. This way, they are trapped, and the wash traders walk off with millions of dollars in profit, depending on how large the scheme is.

The study unveiled that stablecoins were actually contributing largely to this wash trading volume. This means that the digital asset is seeing up to $10-$15 billion in fake volume across exchanges, giving rise to concerns about how this affects the cryptocurrency.

Impact On Bitcoin Price

To the unsuspecting eye, there might be no manipulation going on when it comes to the price of bitcoin, but this report from Bankless Times actually shows that the digital asset is being largely manipulated. Wash trading can easily affect the price of a digital asset by making it look like a profitable investment. 

So say bitcoin is being wash traded across multiple exchanges; it deceives investors to believe that there is a large demand for the asset, leading them to purchase it. Thereby raising the digital asset of the cryptocurrency in the process.

With such a large volume of trading volume reportedly being fake, it begs the question of if the current BTC price is actually accurate. A real volume of less than 50% of reported volumes would put the digital asset’s value at around $12,000, if true.

Featured image from Forbes, chart from TradingView.com

Follow Best Owie on Twitter for market insights, updates, and the occasional funny tweet…