Bitcoin Whales Continue Buying, Now Hold 25.16% Of All Supply

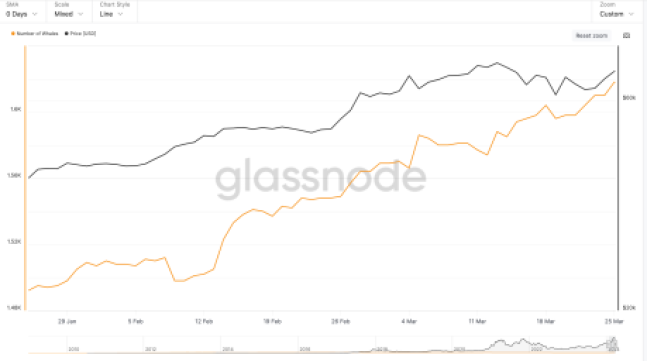
On-chain data shows that the Bitcoin whales’ holdings have grown to 25.16% of the entire supply, and their net accumulation has continued recently.

Bitcoin Investors With 1,000 To 10,000 BTC Have Continued To Buy Recently

According to data from the on-chain analytics firm Santiment, the BTC whales have accumulated more than 266,000 BTC since the start of the year. The indicator of interest here is the “Supply Distribution,” which keeps track of the percentage of the total circulating Bitcoin supply that the various wallet groups are holding right now.

The addresses are divided into these cohorts based on the number of coins they currently have in their balance. The 10 to 100 coins group, for example, includes all wallets that own at least 10 and, at most, 100 BTC.

The Supply Distribution sums up the amount that investors belonging to a particular group as a whole are carrying and calculates what percentage of the supply they contribute.

The 1,000 to 10,000 BTC cohort is of interest in the current discussion. At the current exchange rate, the lower limit for this cohort is $65 million, while the upper one is $650 million.

Clearly, the investors belonging to the group are quite massive, and as such, they are popularly known as “whales.” As the whales can quickly move large amounts, they have the potential to influence the market. Due to this, their behavior can be worth watching.

There are whales beyond this cohort’s 10,000 BTC upper limit as well, but at such massive scales, entities like exchanges also start coming into play, who aren’t exactly normal investors.

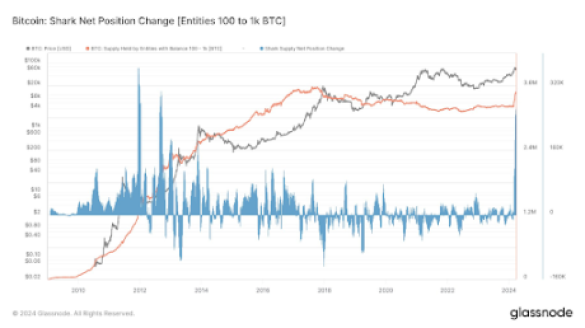
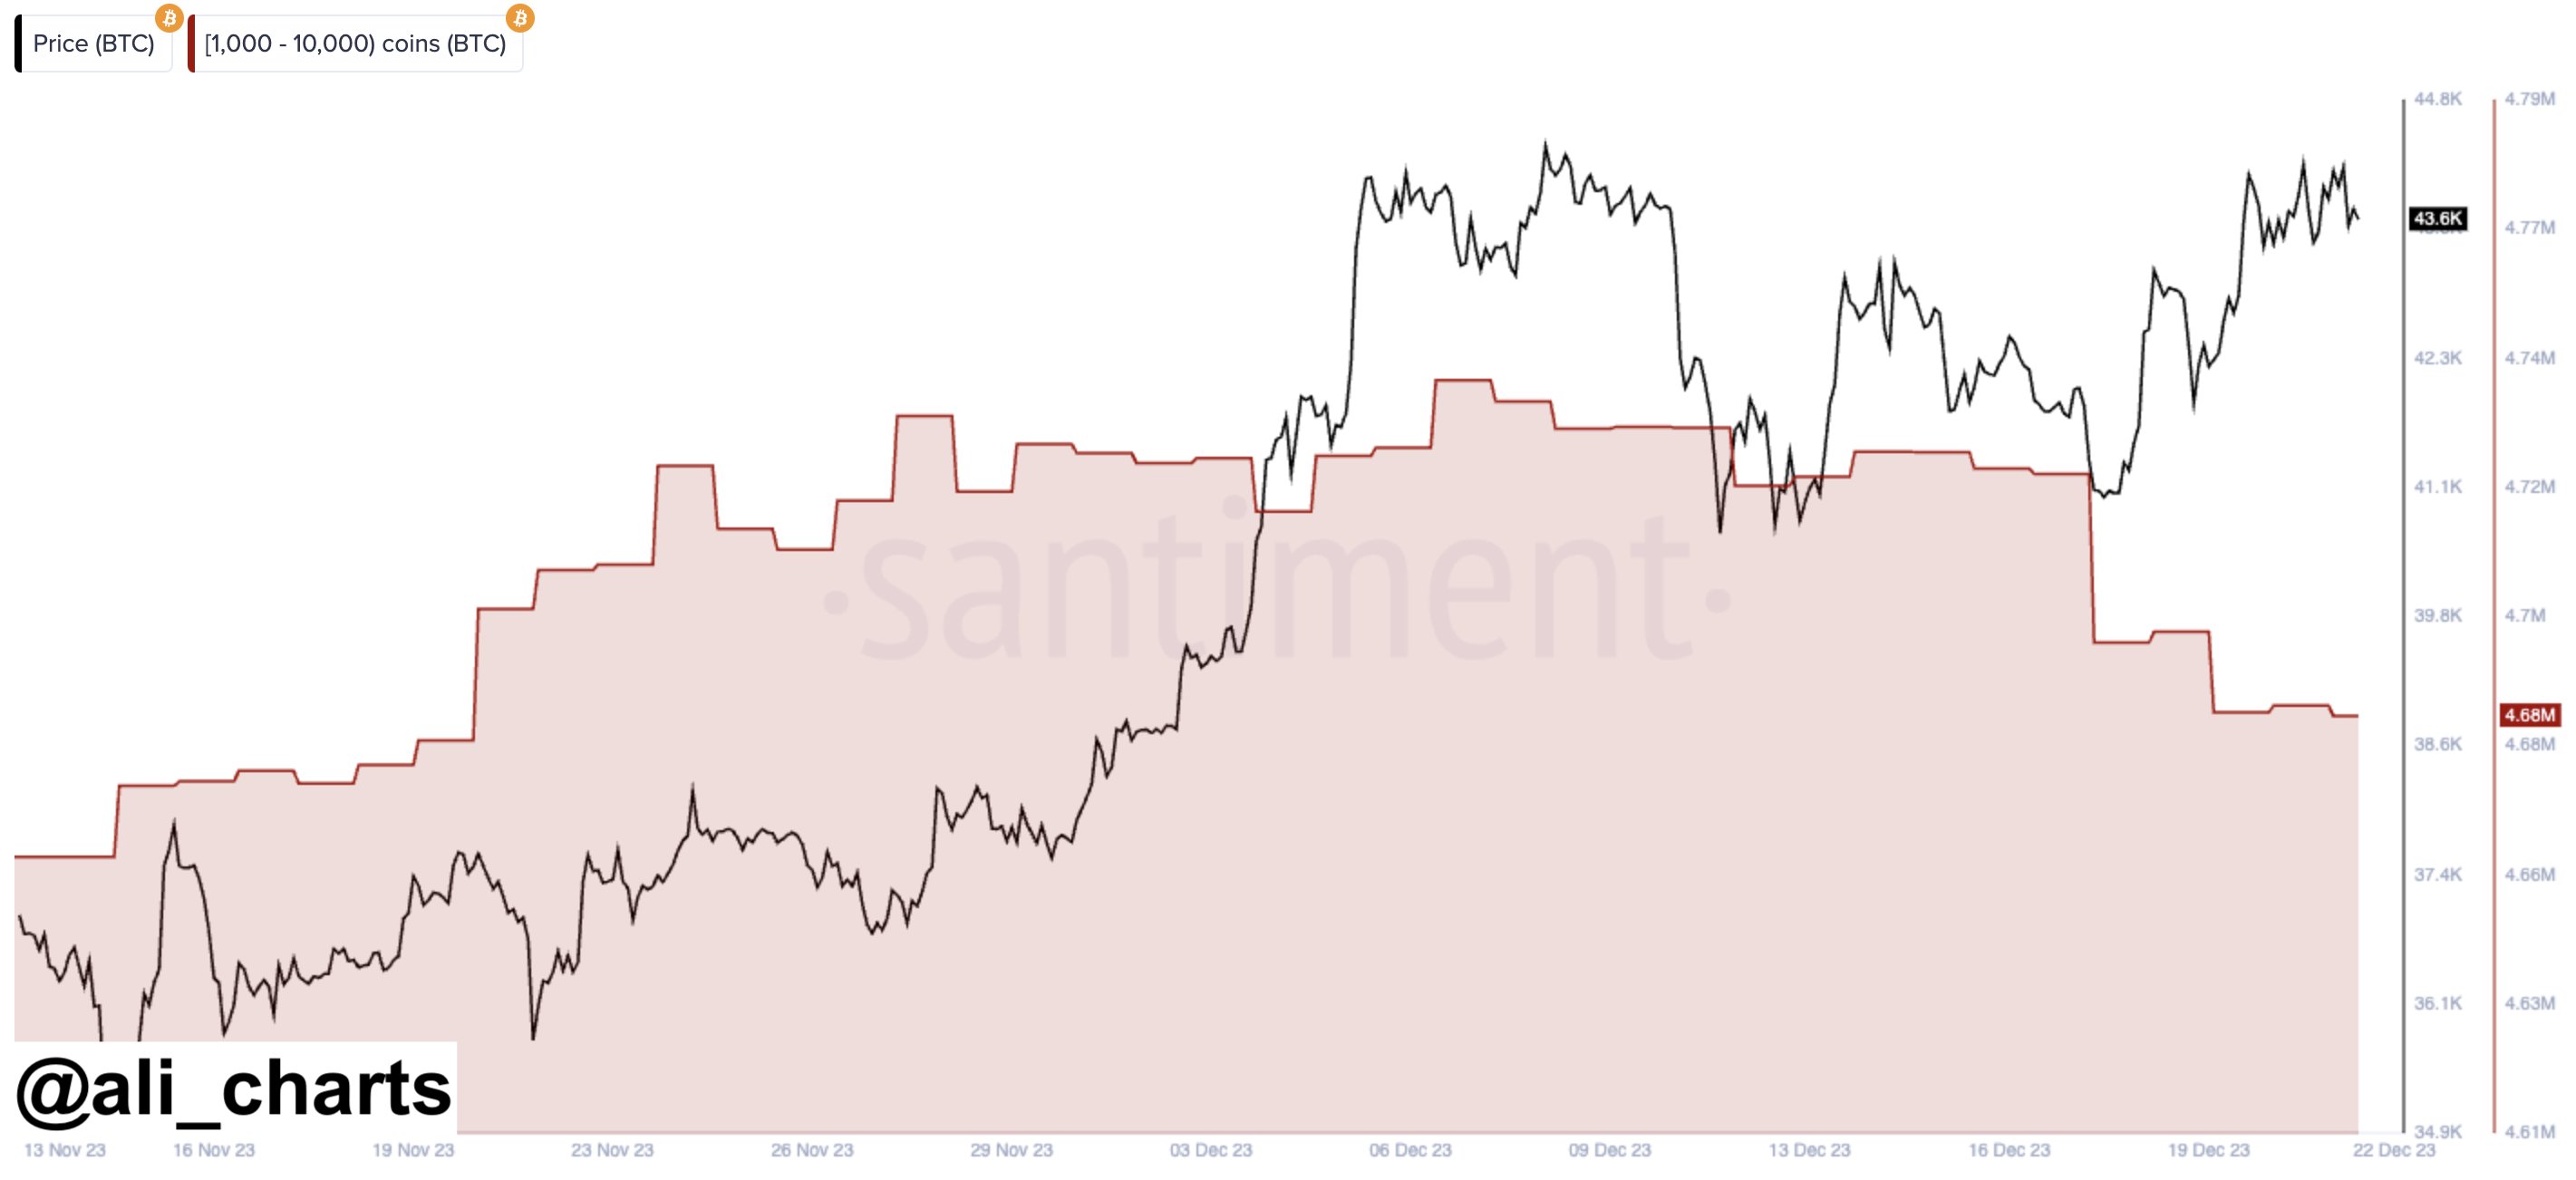
Now, here is a chart that shows the trend in the Bitcoin Supply Distribution for the 1,000 to 10,000 coins group over the last few months:

Bitcoin Whale & Sentiment

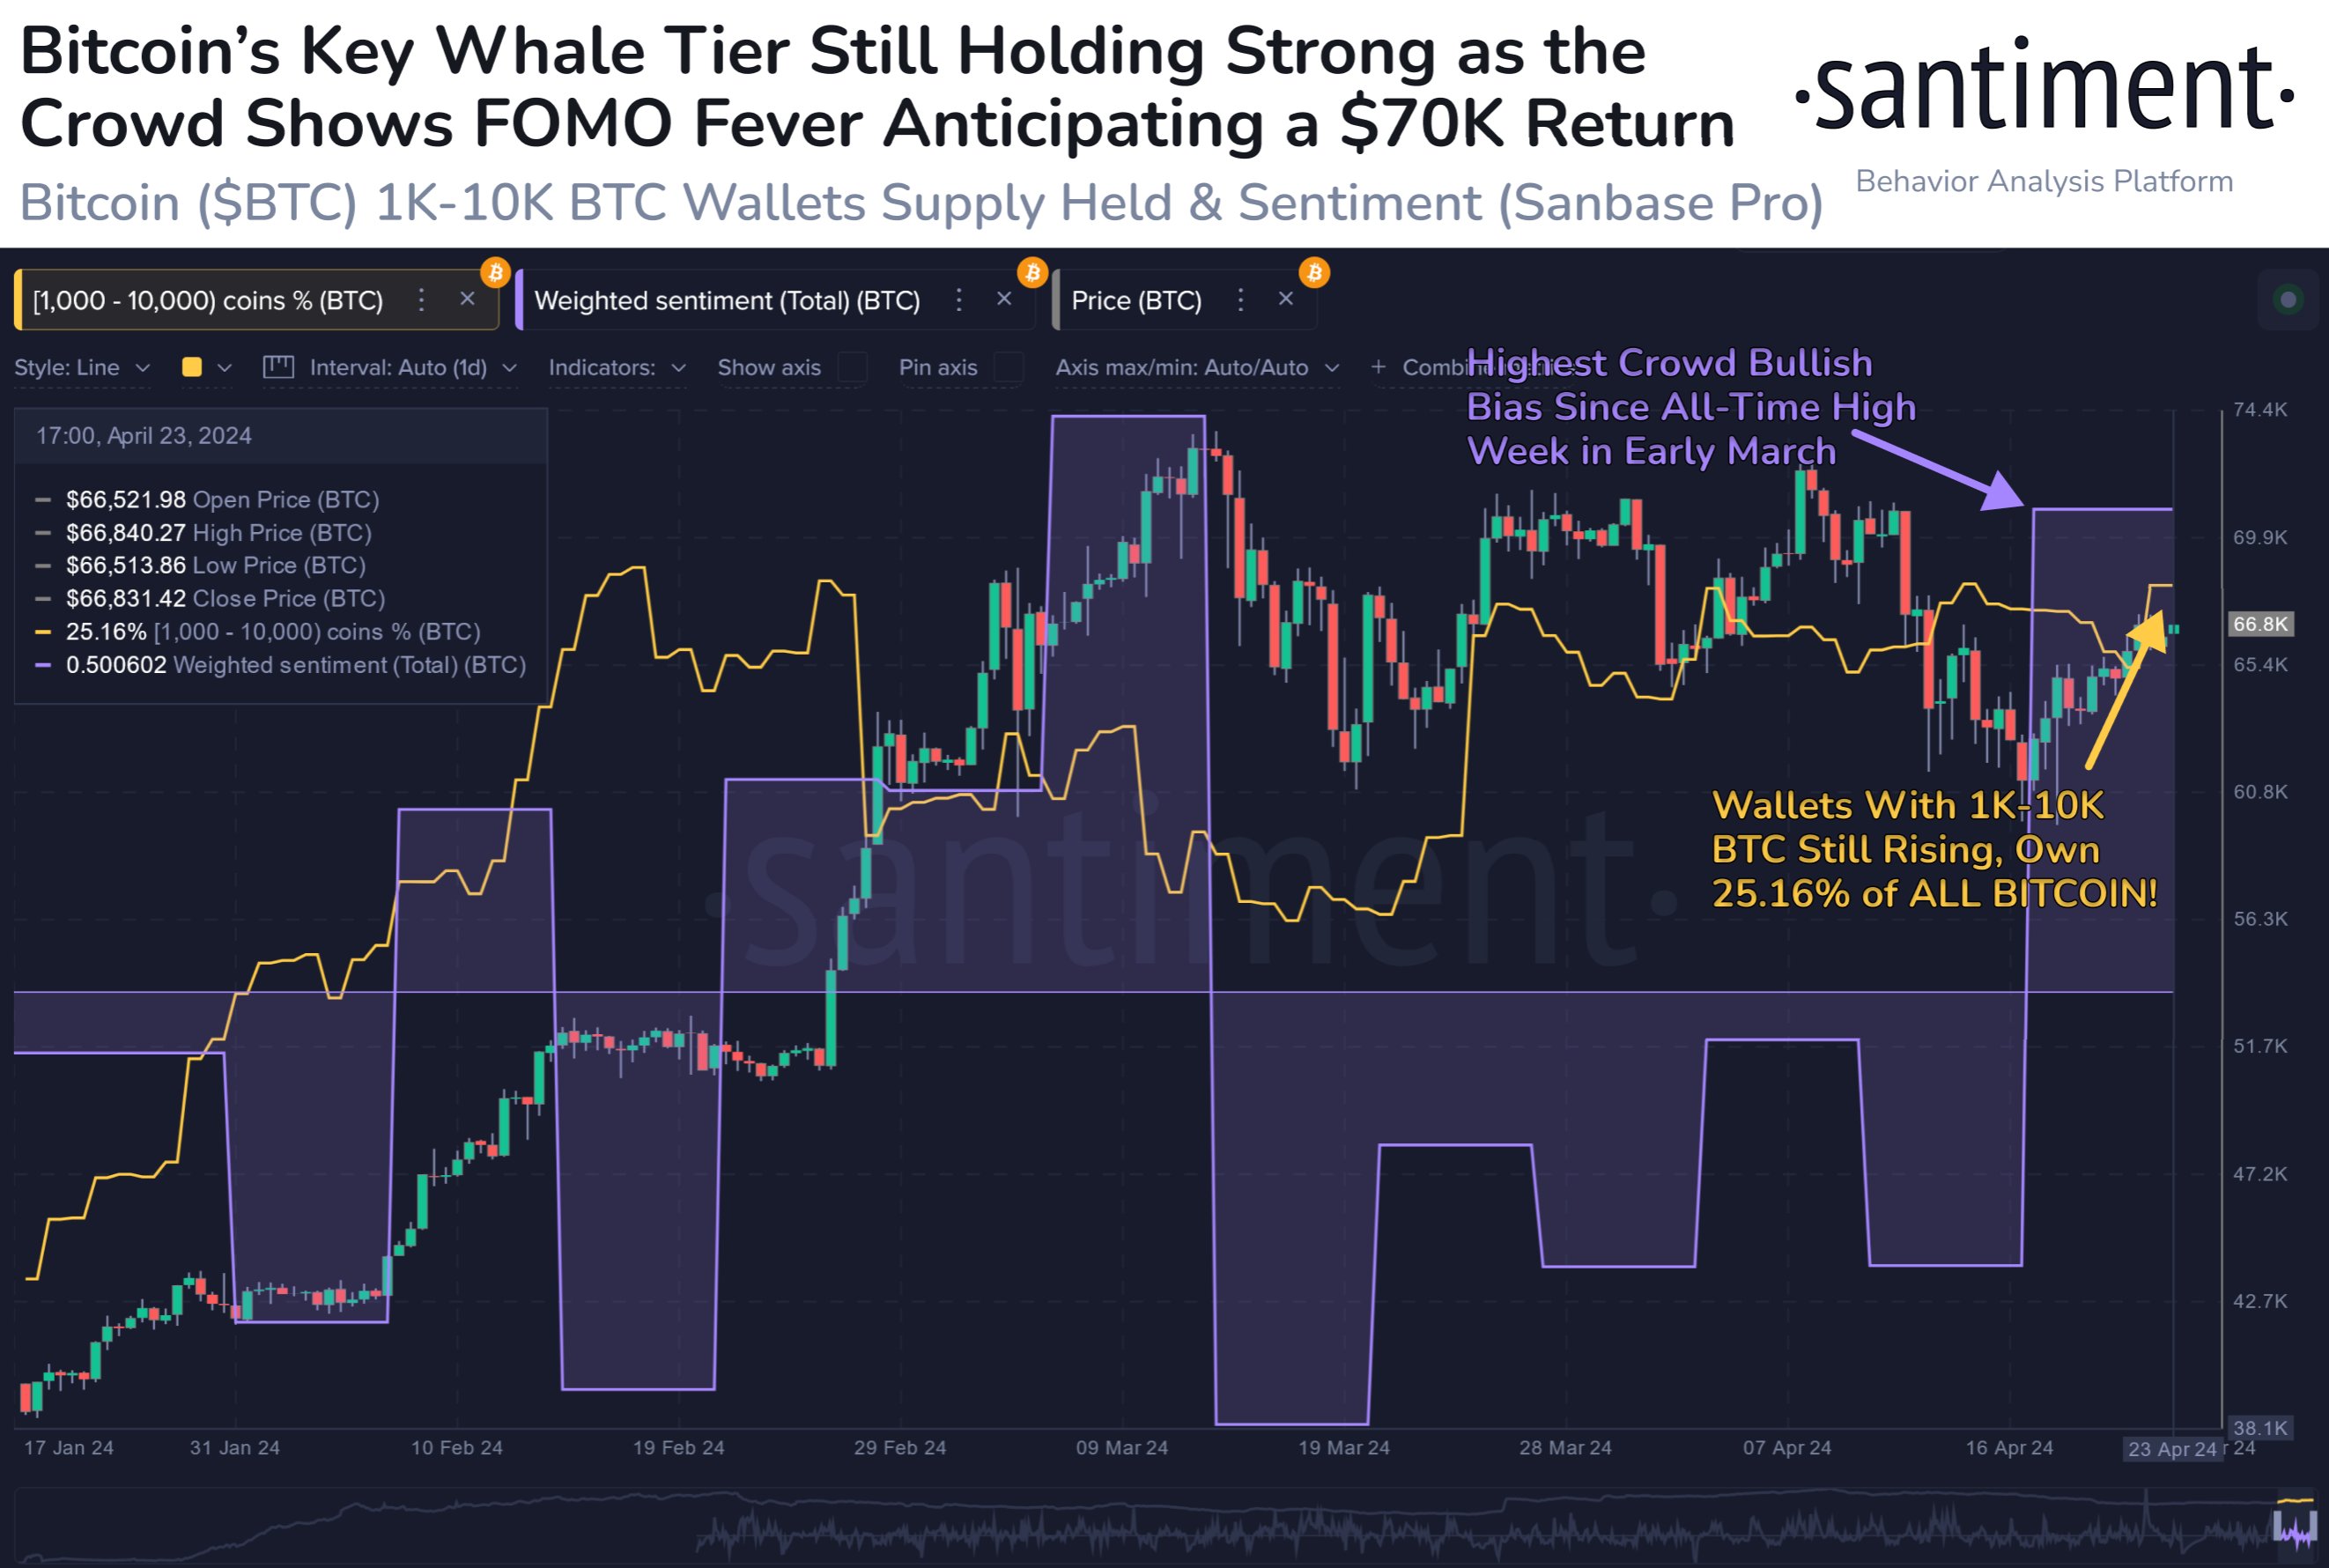
As displayed in the above graph, the Bitcoin Supply Distribution for this key investor group has observed a net rise over the year 2024 so far. The whales have bought 266,000 BTC ($17.2 billion) over this period.

However, this accumulation hasn’t been consistent. As is visible in the chart, the whales sold into the rally that would eventually lead to the asset’s new all-time high, and they bought back in once the drawdown was over.

As BTC has consolidated, so has its supply. Still, the latest change in the metric has been towards the upside, implying that these humongous holders are perhaps backing the current recovery push.

Following the latest accumulation, the 1,000 to 10,000 coins group holds 25.16% of the supply, which means that more than a quarter of all Bitcoin in circulation is sitting in the wallets of these large investors.

While whale buying is bullish, the current investor sentiment may not be so. As the data for the “Weighted Sentiment” metric attached by Santiment in the chart suggests, investors are currently showing FOMO towards the asset.

Historically, Bitcoin has tended to move against the majority’s expectations, so FUD/fear has been ideal for uptrends to start. FOMO/greed, on the other hand, has been where tops have become probable.
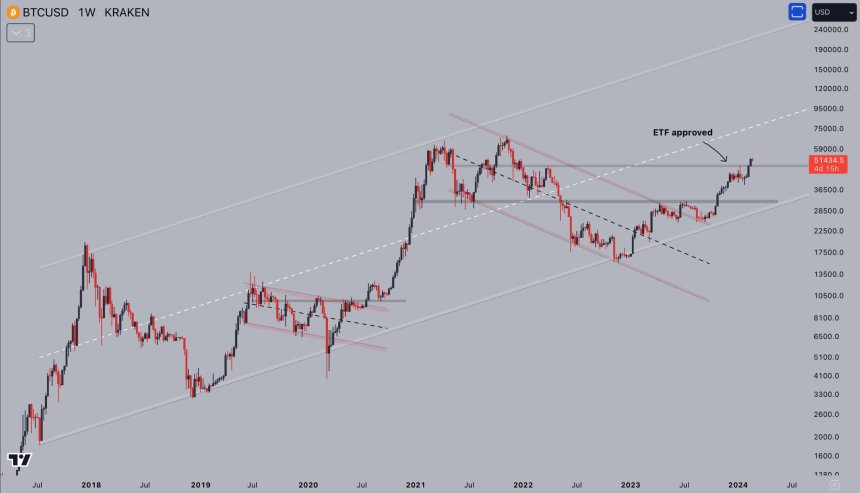
BTC Price

At the time of writing, Bitcoin is trading at around $64,700, up more than 7% over the past week.

Bitcoin Price Chart

Old Bitcoin Whales Moving Coins: Will This Help Push BTC Above $74,000?

While Bitcoin struggles to extend gains, on-chain data shared by Ki Young Ju, the founder of CryptoQuant, on X shows increased movement of old coins. As the Bitcoin Average Dormancy chart shows, this trend recently hit a 13-year high. 

More Old Whales Moving Coins

The Bitcoin Average Dormancy shows the average number of days each BTC has been dormant. On-chain data indicates that coins held for 3 to 5 years have changed hands and moved to new owners. 

BTC dormancy chart | Source: CryptoQuant

While there was movement, interestingly, data shows that they were not transferred to exchanges. Instead, it is highly likely that they were traded over the counter (OTC).

Usually, any transfer to centralized exchanges like Binance or Coinbase could suggest the intention of selling. The more coins hit these exchanges, especially from whales, the higher the chance of price dumping. However, if trades are made via OTC, the impact on spot rates is negligible, which is a positive for bulls.

Further analysis of these transfers using the Spent Output Profit Ratio (SOPR) indicator suggests that whales moving them made decent profits. Historically, whenever whales dump and register profits, prices tend to dip.

Will Bitcoin Prices Retest All-Time Highs

However, in a post on X, one analyst says prices will likely increase because of the impact of spot Bitcoin exchange-traded funds (ETFs). These derivatives are like a buffer against price drops, considering the pace of inflows in the past weeks.

Spot ETFs allow institutions to gain regulated exposure to BTC. Coupled with decreasing outflows from GBTC, the odds of prices rising remain elevated. 

According to Lookonchain data, GBTC unloaded 750 BTC on April 23. However, Fidelity and other eight spot ETF issuers bought 1,513 BTC on behalf of their clients. Spot Bitcoin ETF issuers sell shares representing BTC holdings. These coins can be purchased from secondary markets like Binance, via OTC platforms, or directly from miners. 

Spot Bitcoin ETF flow data | Source: Lookonchain

BTC prices remain muted and capped below $68,000, representing April 13 highs.

To define the uptrend, there must be a high volume expansion above this liquidation line, reversing recent losses. 

Bitcoin price trending downward on the daily chart | Source: BTCUSDT on Binance, TradingView

Even so, looking at the BTCUSDT candlestick arrangement in the daily chart, bulls must break above all-time highs for a clear trend continuation. Ideally, the uptick above $73,800 and the current range should be with expanding volumes, confirming the presence of buyers.

Newbie Bitcoin Whales Hold 2x As Much As Veterans: What’s Behind This Trend?

On-chain data shows the new whale entrants in the Bitcoin market now hold almost twice as much as the veterans. Here’s what could be behind this shift.

Bitcoin Newbie Whale Holdings Have Been Rapidly Growing Recently

In a new post on X, CryptoQuant founder and CEO Ki Young Ju has discussed about how the holdings of the new whales compares against the old ones in the market right now.

The on-chain indicator of interest here is the “Realized Cap,” which, in short, keeps track of the total amount of capital that the investors have used to purchase their Bitcoin.

This capitalization model is in contrast to the usual market cap, which simply measures the total value that the holders as a whole are carrying based on the current spot price.

In the context of the current topic, the Realized Cap of the entire market isn’t of interest, but rather specifically that of two segments: the short-term holder whales and long-term holder whales.

Whales are defined as entities on the network who are holding at least 1,000 BTC in their balance. At the current exchange rate, this amount is worth $66.6 million, so the whales are clearly quite massive holders. Because of these large holdings, these investors can hold some influence in the market.

Based on holding time, the whales can be subdivided into two categories. The short-term holder (STH) whales are those who acquired their coins within the past 155 days, while the long-term holder (LTH) whales have been holding since longer than this timespan.

Now, here is the chart shared by Ju that reveals the Realized Cap breakdown between these two Bitcoin whale cohorts:

Bitcoin Realized Cap

As is visible in the above graph, the Realized Cap of the STH whales has historically not been too different from that of the LTH whales, but that appears to have changed recently.

The metric has pulled away for these new whales this year with some very sharp growth, as its value has now reached the $110.6 billion mark. This means that the STH whales have collectively bought their coins at an initial investment of a whopping $110.6 billion.

The Realized Cap of the LTH whales, on the other hand, has continued its usual trajectory, floating around $66.9 billion currently. This means that there is now a massive gap between the indicator for these two cohorts.

But what’s the reason behind the sudden emergence of this brand-new trend? As mentioned before, the STH cutoff stands at 155 days, which means that the Realized Cap of the STH whales would signify the total value of the purchases made by the whales over the last five months.

In the past five months, there has been one event in particular that has stood out, which has also never been present in any of the prior cycles: the approval of the spot exchange-traded funds (ETFs).

The spot ETFs provide an alternative mode of investment into the asset through a means that’s familiar to traditional investors. These funds have been bringing in some unprecedented demand into BTC and as their holdings also fall under the 155 days mark, they would count as STH whales.

Bitcoin has also been rallying this year, so all this new investment would have had to purchase at relatively high prices, thus causing the Realized Cap, which correlates to direct capital flows, to inflate even further.

BTC Price

Bitcoin is now trading at $66,400 after witnessing a surge of more than 6% over the past week.

Bitcoin Price Chart

Bitcoin Mega Whales Are Buying, Time For Rally To Return?

On-chain data shows that the largest number of investors in the Bitcoin market are finally buying, which could be bullish for the asset’s value.

Bitcoin Mega Whales Have Shown Net Inflows In The Past Day

In the past few weeks, the Bitcoin price has struggled to mount any significant bullish momentum as it has been stuck consolidating inside a range.

Earlier, while this was happening, the largest holders in the space had been sitting quietly, not buying or selling anything notable. According to data from the market intelligence platform IntoTheBlock, however, this appears to have changed in the past day.

Relevant holders here are the “Large Holders,” who, as defined by the analytics firm, are investors carrying at least 0.1% of the entire circulating Bitcoin supply in their wallets.

A little under 19.7 million tokens are circulating for the cryptocurrency, 0.1% of which would be 19,700 BTC. This amount is worth more than $1.26 billion at the current exchange rate of BTC.

Clearly, these large holders are quite large indeed, and in fact, they are much larger than the usual whale investors, who typically carry between 1,000 and 10,000 BTC. As such, it would perhaps be apt to call these humongous entities “mega whales.”

Since an investor’s influence in the market increases the larger their holdings, these mega whales would be the most powerful entities on the Bitcoin network. Therefore, their moves can have some consequences for the wider market.

IntoTheBlock has used the netflow on-chain indicator to track the movements of the Large Holders here, which measures the net amount of BTC entering or exiting the wallets of these investors.

The below chart shows the trend in this metric over the last few months:

Bitcoin Large Holder Netflow

As displayed in the above graph, the Bitcoin Large Holders netflow registered a notable positive spike yesterday, meaning these investors have received a net amount of coins into their wallets. The mega whales bought 19,760 BTC during this spike, worth more than $1.27 billion.

“Historically, accumulations by these addresses have often preceded rises in Bitcoin’s price,” notes the analytics firm. The chart shows that some extraordinary buys came from this cohort on the way to the new all-time high for the asset.

As such, it’s possible that these latest buys will also help the asset gain some bullish momentum in the near future. However, something to note is that the scale of the latest spike, although large on its own, isn’t quite as prominent as that of some of the large buys seen earlier.

BTC Price

At the time of writing, Bitcoin is trading at around $64,500, down more than 5% over the past week.

Bitcoin Price Chart

Bitcoin Whales Showing Different Behavior From Past Cycles, But Why?

On-chain data suggests the Bitcoin whales have been showing different behavior regarding exchange inflows from the last cycle. Here’s why this may be so.

Bitcoin Whales Are Showing Different Behavior In Exchange Inflows This Time

As an analyst explained in a CryptoQuant Quicktake post, the BTC whales’ movements have been different this time compared to the previous cycle.

The indicator of interest here is the “exchange inflow,” which tracks the total amount of Bitcoin being transferred to wallets attached to all centralized exchanges. In the context of the current discussion, derivative platforms are specifically of interest.

When this metric’s value is high, it means that investors are depositing large amounts on these exchanges. Such a trend usually suggests a high demand for the services these derivative exchanges provide.

Generally, extraordinary spikes in the indicator are associated with whale movements, given that only these humongous holders can cause such large shifts.

On the other hand, when the metric has a low value, it suggests that the whales aren’t depositing anything significant to these platforms, a possible sign that they don’t want to take risks on the derivative side.

Now, here is the chart shared by the quant, which shows the data for the Bitcoin exchange inflow for derivative exchanges:

Bitcoin Exchange Inflow

The indicator in the above graph also has another condition attached: it only tracks the inflows coming from the whales that had been holding for at least 1 month and at most 3 months.

These would be the newbie whales in the market, but not quite so new that they have only bought (those with a holding time of less than 1 month). Restricting this time range also excludes the data of the traders who make a high amount of moves in short timeframes on average.

As the analyst has highlighted in the chart, the whales in this group have usually made large inflows to derivative platforms around notable cryptocurrency tops and bottoms, when speculation is at its height.

Interestingly, though, the cryptocurrency has witnessed no such large inflow spikes this year even though the asset has broken past the previous all-time high (ATH).

One explanation may be that the whales are not interested in making any real moves right now. However, a more likely reason may be that spot exchange-traded funds (ETFs) exist now.

The spot ETFs hold Bitcoin on behalf of their customers and let them gain indirect exposure to the cryptocurrency in a way familiar to conventional investors.

The ETFs have brought significant demand into the asset and have quickly become an important part of the market. It’s possible that, with this new investment vehicle, the usual cryptocurrency exchanges no longer have the same relevance for the asset.

This could be why the pattern that held during the previous BTC cycle has seemingly disappeared from the current one.

BTC Price

At the time of writing, Bitcoin is trading at around $66,100, down more than 8% over the past week.

Bitcoin Price Chart

Bitcoin Rebounds After Nearing Cost Basis Of Short-Term Whales

Bitcoin has found a rebound back above the $66,000 mark following a drop towards the on-chain cost basis of the short-term holder whales.

Bitcoin Drawdown Had Nearly Put Short-Term Whales Under Pressure

As pointed out by an analyst in a CryptoQuant Quicktake post, BTC’s price had neared the Realized Price of the short-term holder whales during the recent drop, but had still managed to remain above the level.

The “Realized Price” here refers to an on-chain indicator that, in short, keeps track of the cost basis (that is, the acquisition price) of the average investor in the Bitcoin market.

When the spot price of the cryptocurrency is trading above this level, it means that the investors as a whole are in a state of unrealized profits right now. On the other hand, it being under implies the overall market is carrying losses.

In the context of the current discussion, the Realized Price of the entire Bitcoin market isn’t of interest, but that of only a part of it: the short-term holder (STH) whales.

The STHs refer to the BTC investors who bought their coins within the past 155 days, while the whales are categorized as entities holding greater than 1,000 BTC. As such, the STH whales would refer to the large investors who bought during the last five months.

Naturally, the Realized Price of this group would indicate the average whale buying price over the past five months (and this price would obviously have to be one the cryptocurrency had traded at on some occasion inside this timeframe).

Now, here is a chart that shows the trend in the Bitcoin Realized Price for the STH whales over the last decade:

Bitcoin Short-Term Holder Whales

From the graph, it’s visible that the Realized Price of the STH whales has rapidly climbed alongside the sharp rally Bitcoin has gone through this year. This makes sense, as the STHs represent the new hands coming into the market, who would have to buy at higher prices as the asset’s surge would continue.

Not only that, but the STHs who age past the 155 days mark (that is, those who bought at the relatively low prices) exit out of the cohort, thus raising the average even further.

The group that these matured investors advance to is known as the long-term holder (LTH) cohort. In the same chart, the quant has also attached the data for the Realized Price of the LTH whales as well.

It would appear that these veteran whales have their cost basis at just $21,500, meaning that these investors would be getting some big rewards for their patience. In contrast, the STH whales have their Realized Price at $60,700.

During Bitcoin’s recent drawdown, the asset had come close to retesting this mark. Such retests have historically lead to reactions in the market and during bull runs, this reaction has often appeared in the form of buying. This may be why the cryptocurrency found its rebound near the $60,700 level.

BTC Price

With its latest rebound, Bitcoin has so far managed to recover back towards the $66,500 level.

Bitcoin Price Chart

Prepping For $100,000: Bitcoin Shark And Whales Spend Over $18 Billion To Buy BTC

Almost every Bitcoin investor is anticipating a continued price surge as the crypto continues to trade around the $70,000 price mark. On-chain data has shown a large part of this surge can be attributed to the accumulation by large whales

Bitcoin is undoubtedly home to a lot of these whale addresses holding hundreds of millions of dollars and with transactions that can move the market. However, on-chain data has further revealed that the accumulation trend has also flowed into the next cohort of traders. These traders, also known as “Sharks,” are addresses that hold between 100 BTC and 1,000 BTC. According to Glassnode data, shark wallet addresses have accumulated 268,441 BTC in the past 30 days, which is the biggest net position change since 2012. 

Increased Accumulation Of BTC

According to a Glassnode chart shared on social media by crypto analyst James Van Straten, Bitcoin accumulation by shark investors shot up in 2024 to reverse a multi-year consolidation since 2020. As a result, these addresses increased their holdings by 268,441 in 30 days, roughly converting to $18 billion. 

While these sharks do not have as much individual power over price movement as very large whales, their collective behavior is still worth monitoring as they also relate to the sentiment among investors. Consequently, this large accumulation trend could lead to more buying which would signal a continued price surge for Bitcoin.

Bitcoin

The surge in accumulation is not really surprising, as the launch of Spot Bitcoin ETFs in the US has ushered in a bigger wave of accumulation sentiment from all cohorts of Bitcoin investors. As another analyst pointed out on social media, this shark accumulation could’ve been due to ETFs purchasing massive amounts of Bitcoins from Coinbase OTC desks.

Bitcoin whales (addresses holding more than 1,000 BTC) have also upped their activity in the past few days, signaling strategic positioning in the market. Various transaction alerts from Whale Alerts have shown strategic movement from whale addresses.

Notably, the crypto whale transaction tracker has revealed $1.3 billion worth of BTC exchanged between whale addresses in the past 24 hours. Among these large BTC movements was a notable transfer of 3,599 BTC worth $252 million between two unknown wallets. Another notable transaction was the transfer of 3,118 BTC from an unknown wallet to Coinbase Institutional.

Bitcoin To $100,000?

Data from IntoTheBlock has also reiterated this accumulation trend with its net transfer trend from exchanges. Data from ITB’s platform shows a $16.18 billion outflow from exchanges as against a $15.76 billion inflow in the past seven days. Bitcoin is now trading at $67,931 and has failed to stabilize above the $70,000 mark again.

However, the accumulation by whales and sharks, increasing mainstream interest from institutional investors through Spot Bitcoin ETFs, and the approaching halving all point to the possibility of substantial price appreciation to $100,000.

Bitcoin price chart from Tradingview.com

The Road To $100,000: Bitcoin Whale Accumulation Explodes

Bitcoin reaching $100,000 remains a highly feasible target, especially given the fact that the price of the cryptocurrency hit a new all-time high above $73,00 ahead of the halving. In preparation of the explosive move that is expected to follow the halving, Bitcoin whales are going all out as they fill up their wallets with BTC.

Large Bitcoin Whales Buy More BTC

As the Bitcoin price has retraced from its surge, large Bitcoin whales are taking advantage of the dip to buy more coins at cheap prices. These whales, which hold at least 1,000 BTC – which means they have $70 million on the low end, have bought up a large tranche of coins over the last three months.

Since January, there has been a steady climb in the number of wallets that hold at least 1,000 as interest continues to grow. A lot of this interest is driven by institutional investors who are putting billions of dollars into Spot Bitcoin ETFs. Now, with the condition that issuers have to hold the BTC they sell to customers, it has seen these institutions buy up a good chunk of the supply.

The number of addresses holding at least 1,000 BTC was sitting at less than 1,500 at the beginning of the year. However, by March, with institutions ramping up their buys, this number has climbed to 1,617. This is an 8% increase in the number of these large whales in the last three months.

Bitcoin whales

To put this increase in perspective, the last time that there were these many whales holding this much BTC was back in 2021 at the peak of the bull market. So, if this number is rising once again, it means that these large investors are expecting the price to rise, and as a result, are trying to maximize their profits.

Spot ETF Inflows See 2,600% Spike

After a week of consistent outflows, inflows into the Spot Bitcoin ETFs are starting to ramp up once again. For the first day of the week, inflows climbed to $14.5 million, bringing a welcome change from the almost $900 million worth of outflows that was recorded in the prior week.

This change in the tide seems to have brought renewed interest for investors as Tuesday saw a whopping 2,600% increase in inflows. In total, there $418 million recorded going into Spot BTC ETFs on Tuesday, one of the highest inflow days since the ETFs were approved.

This change in direction is also evident in the Bitcoin price, which has recovered from last week’s low of $60,000. The price has since sprung back up above $70,000, with a 10% increase in the last week. This also validates the whales’ moves to acquire more Bitcoin, putting the vast majority of their holdings in profit.

Now, as seen in the past, a return of high inflows into the Spot ETFs has always been bullish for the price. So, if the inflows were to continue throughout this week, then the price of Bitcoin could register a brand new all-time high ahead of the halving.

Bitcoin price chart from Tradingview.com

Bitcoin Whales Remove A Staggering $2.3 Billion From Exchanges, Is It Time To Buy?

Bitcoin whales have been very active in the past few days as the crypto continues to trade below $68,000. Notably, on-chain data has shown a trend of accumulation among Bitcoin whales, with large bouts of the cryptocurrency leaving crypto exchanges into private wallets.  These massive transfers appear to have piqued the interest of a few investors who are keeping a watchful eye, as this accumulation pattern points to a price increase up ahead. 

According to various posts by whale transaction tracker Whale Alerts, Bitcoin whales have recently transferred $2.3 billion worth of BTC in a span of 24 hours, indicating their bullish sentiment. Similarly, crypto analyst Ali Martinez recently revealed that over 25,000 BTC worth approximately $1.60 billion had been transferred into accumulation addresses.

Bitcoin Whale Accumulation Signal Price Surge Ahead

Bitcoin has largely traded below $69,000 since March 15, struggling to regain the momentum that saw it shooting past $70,000 earlier in the month. Interestingly, Bitcoin fell to as low as $61,766 last week, representing a 16% decline from its all-time high. 

Meanwhile, Spot Bitcoin ETFs saw consistent outflows throughout the week which was spearheaded by Grayscale’s GBTC and weak inflows into BlackRock’s IBIT and Fidelity’s FBTC. This decline became much of a concern for investors as it signaled the bullish sentiment surrounding BTC might finally be coming to an end.

However, on-chain data is now telling a different tale of a strong bullish sentiment from Bitcoin whales. Data from Whale Alerts show large amounts of BTC leaving crypto exchanges, one of which was a transfer of 8,136 BTC worth $517 million from Coinbase into a new private wallet. Shortly after, 8,172 BTC worth $519 million were transferred from Coinbase into another new private wallet. Interestingly, the different alerts from the whale tracker added up to $2.3 billion worth of BTC to and from crypto exchanges on March 22. 

Analyst Ali Martinez noted that these transfers added up to $1.6 billion being added into accumulation addresses, the largest inflow so far this year. 

According to CryptoQuant data, this accumulation trend has seen the Bitcoin reserves on exchanges on a downtrend since March 21. At the time of writing, the Bitcoin exchange reserve is at 1.98 million BTC. 

Basically, whale accumulation tends to swing the balance into bullish among other traders. Fundamentals surrounding Bitcoin like the upcoming halving point to price growth in the near future, making it an ideal time for investors to position themselves in the market. 

At the time of writing, Bitcoin is trading at $67,478. A key price level to watch is $69,000. If Bitcoin breaks above this resistance level, it could continue surging higher with the accumulation trend.

Bitcoin price chart from Tradingview.com

Bitcoin Whales Enter Full Accumulation Mode: Here’s How Much BTC They Pulled From Exchanges

The Bitcoin price movement last week revealed a series of ups and downs, from starting the week at a new all-time high of  $73,780 to crashing 12% in the days after to reach below $65,000. Crypto data analysts have spotted massive amounts of Bitcoin being withdrawn from major exchanges during the period of uncertainty, indicating that large investors anticipate further price appreciation. 

According to a social media post by crypto analyst Ali Martinez, the total BTC balance on crypto exchanges fell by over 21,400 in the past week, with the creation of 13 new whales, each holding over 1,000 BTC.

BTC Withdrawal From Exchanges

Bitcoin crossed over $73,700 last week to register a new all-time high but has struggled to gain a footing above the price level. Interestingly, it would seem the new all-time high sparked a wave of profit-taking from some investors. However, on-chain and exchange data indicate Bitcoin is still undergoing a bullish sentiment from some investors, particularly large investors. 

Crypto analyst Ali Martinez noted this bull accumulation pattern in a post on his social media platform X. According to a Glassnode chart shared by the analyst, the total amount of BTC on exchanges has been on a free-fall since the middle of January. Notably, the total BTC balance saw a brief increase in the first few days of March before resuming a free-fall on March 5. In the past week alone, 21,401 BTC were moved off crypto exchanges. 

Similarly, the crypto analytics platform IntoTheBlock noted this outflow pattern during the week. According to ITB, BTC withdrawal from crypto exchanges reached its highest point this year on March 15. Interestingly, $750 million worth of Bitcoin was withdrawn on this day, the highest since May 2023.

What Does This Mean For Bitcoin?

The Bitcoin ecosystem has witnessed serious money on the move since the beginning of the year, leading to a strong price surge for the cryptocurrency. However, this rally has since slowed down to spark a price correction, with market sentiment reaching the most negative sentiment toward BTC since December 2023. Bitcoin is currently trading at $68,201, down by 3.44% in the past seven days. 

After such a strong surge in price, it’s normal for the momentum to slow down as the market consolidates and decides on the next move. While momentum has slowed, the overall trend for Bitcoin remains bullish.

Judging by the massive amounts of Bitcoin pulled from exchanges recently, it looks like whales are gearing up for a continued rally. Bitcoin is now showing signs of a rally, and is now up by 5% in the past 24 hours. 

Bitcoin price chart from Tradingview.com

Bitcoin Whales Are Cashing Out Amid Push To New All-Time High

As the Bitcoin price continues on an upward trajectory that has sent it toward new all-time highs, breaking above $73,000 this week. With this increase, the vast majority of BTC holders are currently seeing a profit, and large whales are taking advantage of this to cash out some profit.

Large Bitcoin Whales Sell-Off Coins

Crypto analyst Ali Martinez took to X (formerly Twitter) to share a chart that showed that large Bitcoin whales were selling off some of their coins. These large whales are those that hold at least 1,000 BTC in their wallet, which means on the lower end, these whales are holding at least $73 million worth of Bitcoin on their balances.

As the chart shows, there has been a decline in the total number of BTC held by these large wallets and this signifies that they have been selling their coins. After the price first ran toward its 2021 all-time high of $69,000, these whales began reducing their allocation.

The selling began in the month of February and has continued on into the month of March. Over this time, their total balances have reduced, leading to a decrease in the number of wallets that hold more than 1,000 BTC.

As of February, there were around 2,150 wallets holding more than 1,000 BTC. However, in March, this figure has dropped toward 2,040 as the whales shave off their balances to secure some profit during the rally.

Impact Of Whale Selling On BTC Price

Given the size of these wallets, a decision to sell from them can have a notable impact on the BTC price. This is because they are able to dump a large amount of supply on the market in a short time and if there is not enough demand to soak it up, then it leads to a crash in the price.

The whale selling could be behind the flash dips that have plagued Bitcoin as it has surged to new all-time highs. One example of this was on Tuesday, March 12, when the price of Bitcoin touched $73,000. What followed was a flash crash that sent the price toward $68,000 before it recovered.

So, while the whales dumping their holdings could have an adverse effect on the price, the performance of BTC in response to this flash crash shows that there is enough demand to meet this supply. In the case of Tuesday, the price would recover quickly to reach a new all-time high of $73,600.

At this time of this writing, the BTC price is still maintaining its hold on $73,000 with a 7-day increase of 10.49%.

Bitcoin price chart from Tradingview.com

Bitcoin Bulls In Jeopardy? Analyst Sounds Warning Of Possible Retest

Bitcoin has been on a bullish trend, reaching $50,000 for the first time in two years, but some crypto analysts still anticipate that the token might be gearing up for a potential correction.

Bitcoin Could See A Pullback At Any Moment

According to the recent analysis by cryptocurrency expert Crypto Jelle, Bitcoin could undergo a retest anytime soon. Jelle shared his latest projections with his thousands of followers on the social media platform X (formerly Twitter).

A chart of Bitcoin accompanied his X post to demonstrate his observations and further back up his claims visually. Crypto Jelle’s analysis examines the current and past position of Bitcoin and has identified the presence of a “rising channel.” 

He stated that Bitcoin has been in this rising channel “over the past 6 years.” He further pointed out that the crypto asset is not breaking out of the “channel anytime soon.”

Bitcoin

Due to this, Crypto Jelle believes that the price of BTC might witness a “retest of the mid-range.” Thus, he has urged investors to get involved with the token to increase prices and avoid the impending pullback.

The post read:

Bitcoin has spent the past 6 years inside this rising channel. Doesn’t look like that’s going to change anytime soon. In fact, it seems about time for a retest of the mid-range. Send it higher.

Jelle has also underscored the potential for the digital asset to soar higher to a new all-time high. In another X post, he highlighted that today is “one of those days to recall the part of the cycle we are in.”

Jelle has underlined two distinct timeframes for Bitcoin, which include the lower timeframe and the higher timeframe. He asserted that in the lower timeframe, BTC’s performance looks like “dog poop.”

Meanwhile, in the higher timeframe, BTC’s performance looks promising, suggesting a move to a new price level. Jelle appears bullish on Bitcoin as he has encouraged the community not to be “shaken out” of the market.

Massive Sell-Off By BTC Whales

Despite the upward momentum, reports have revealed a significant selling spree from BTC whales. Ali Martinez, a well-known crypto analyst, reported Tuesday’s development on the X platform.

Per Martinez’s post, Bitcoin whales might lose their confidence in the token. Martinez asserted that whales have sold over 30,000 BTC valued at $1.56 billion in the past 2 days.

The report has sent quite a frenzy in the community, leaving crypto enthusiasts to ponder the impact of the sell-off. However, it is believed that this could be a notable development, indicating the start of a distribution phase, which could extend the low timeframe bearish action. 

Bitcoin

BitMEX Whales Buy Bitcoin: What History Says Will Happen Next

On-chain data shows the Bitcoin price has followed a particular pattern when the BitMEX whales have made large withdrawals.

Bitcoin Exchange Netflow For BitMEX Has Seen A Red Spike Recently

As an analyst in a CryptoQuant Quicktake post pointed out, the cryptocurrency exchange BitMEX has recently observed significant withdrawals from the whales.

The indicator of interest here is the “exchange netflow,” which tracks the amount of Bitcoin entering or leaving any exchange’s wallets. The metric’s value is calculated by subtracting the outflows from the inflows.

When the value of this metric is positive, it means that the inflows outweigh the outflows right now, implying that the investors are depositing a net number of coins to the platform.

Generally, one of the main reasons holders want to transfer their BTC to exchanges is for selling-related purposes, as this trend can have a bearish impact on the asset’s price.

On the other hand, the negative indicator implies net withdrawals are taking place on the exchange. Such a trend can suggest either some fresh buying is occurring or some existing investors are simply transferring the BTC they already own towards self-custody.

In either case, the holders withdrawing from the exchange’s custody can be a bullish sign for the cryptocurrency, implying that these investors potentially plan to hold onto their coins for extended periods.

Now, here is a chart that shows the trend in the Bitcoin exchange netflow for the BitMEX platform over the last few months:

Bitcoin Exchange Netflow

As displayed in the above graph, the Bitcoin exchange netflow for BitMEX has registered large negative values just recently. The investors have withdrawn about 4,000 BTC (equivalent to $168.3 million at the current exchange rate) from the platform during this net outflow spree.

The quant has explained that the price of the cryptocurrency and this metric have followed a specific pattern whenever this trend has occurred. Below is a zoomed-out indicator chart showing the previous instances where negative spikes took form.

quicktake-image

“When a significant volume of Bitcoins is observed leaving BitMEX, one of the leading cryptocurrency trading platforms, it often signals the formation of local bottoms in the price of Bitcoin (BTC),” notes the analyst.

The graph shows that large net withdrawals also occurred on the exchange right before the current rally in the cryptocurrency’s price began in October of last year.

It’s possible that these historical negative spikes in the indicator corresponded to buying from these BitMEX whales, which helped the price bottom out and turned around.

Given this historical pattern, the latest net withdrawals may have a similar effect to some degree on the coin. The quant cautions, however, that “it is essential to closely monitor these trends, as large inflows into the exchange can have the opposite effect, potentially leading to a decrease in BTC price.”

BTC Price

Bitcoin has erased its recent recovery as the asset’s price has returned to the $42,000 mark now.

Bitcoin Price Chart

Bitcoin Whales Increase Holdings By 4.5%, Getting Ready For Rally?

Despite the recent market conditions that saw Bitcoin’s value dip below the critical $39,000 mark, large-scale BTC holders, often called ‘whales,’ have demonstrated their confidence in the flagship crypto.

Crypto analyst Ali has shed light on this development via a post on X, indicating that these major investors have capitalized on the recent price correction to augment their Bitcoin portfolios.

Ali’s analysis revealed that about 67 new entities have joined the elite group of Bitcoin holders who own more than 1,000 BTC, marking a 4.50% increase in such holdings within just two weeks.

This move by the whales goes against the prevailing market sentiment. Despite the price volatility and uncertainties that have gripped the broader crypto space, it suggests a bullish outlook from these major players.

Bitcoin Resilience And Recovery: Factors At Play

In stark contrast to its recent price slump, Bitcoin has shown resilience, charting a course of recovery. The cryptocurrency has witnessed a surge of over 10% in value over the past week, with a notable increase of 3.2% in the last 24 hours alone, bringing its trading price to approximately $43,412.

Bitcoin (BTC) price chart on TradingView

This upward trajectory is mirrored in the cryptocurrency’s trading volume, which has escalated from below $15 billion to over $24 billion in a single day, indicating renewed investor interest and market confidence.

The resurgence in Bitcoin’s price can be attributed to multiple factors, with the diminishing impact of Grayscale’s sell-off being a primary contributor.

Bloomberg analyst James Seyffart recently highlighted a milestone event where BlackRock’s Spot Bitcoin ETF, IBIT, nearly matched Grayscale’s GBTC regarding trading volume. This was a significant moment, as it marked the closest any spot Bitcoin ETF has come to challenging GBTC, which has long held the “liquidity crown” in the crypto spot ETF space.

The positive implications of this development for Bitcoin’s price are clear. With IBIT’s volume mainly consisting of inflows, it can potentially offset the outflow-dominated volume from GBTC.

Reduced Selling Pressure And Market Optimism

Notably, Grayscale’s conversion of GBTC to a spot Bitcoin ETF had been a key factor in Bitcoin’s drop below $39,000 in the past week, leading to a wave of sell-offs from GBTC investors.

However, recent trends indicate a cooling off among GBTC investors in their rush to take profits. BitMEX Research, in a post on X, pointed out that GBTC had registered its lowest daily outflow since its launch day, amounting to $192 million yesterday.

This declining trend in outflows signals a reduction in selling pressure in the Bitcoin market, contributing to the cryptocurrency’s price recovery.

Adding to the positive sentiment, Glassnode co-founders Jan Happel and Yann Allemann, known as Negentropic on X, have recently noted that Bitcoin’s recent rise above $42,200 has created substantial liquidity for long positions.

This situation suggests that Bitcoin is filling the liquidity void above the $42,000 mark, which could lead to volatility and market shifts. Negentropic points out that approximately $659 million in liquidations have already occurred.

If Bitcoin maintains its upward trajectory, it could trigger further liquidations amounting to $1 billion in short positions, potentially leading to a ‘short squeeze.’ This scenario, where short sellers are forced to exit their positions due to a rapid price increase, could catalyze further growth in Bitcoin’s value.

Featured image from Unsplash, Chart from TradingView

Bitcoin Whales Go On Buying Spree As Price Dips, Here’s How Much They Bought

A recent development shows that Bitcoin whales have refused to be deterred by the recent price action of the flagship cryptocurrency. Instead, they have chosen to see it as an opportunity to accumulate more BTC. This move could turn out to be really profitable based on a recent analysis by crypto analyst Ali Martinez

An Increase In Bitcoin Whales

Ali Martinez stated in an X (formerly Twitter) post that 46 new entities now hold 1,000 BTC or more, which represents a 3% increase in just two weeks. Data from BitInfoCharts further shows that there are now 1,898 wallet addresses holding this amount of Bitcoin or more. This is significant as it suggests that more people have become bullish on the crypto token despite the recent market correction

These whales no doubt have enough reason to be bullish on BTC, as Martinez’s recent Bitcoin analysis suggests that the tide could turn soon enough. The analyst highlighted in an X post how, historically, price corrections for Bitcoin have “consistently been followed by further upside gains” in bull markets. 

As such, he noted that dips like this might offer “strategic buying opportunities for those looking to capitalize on Bitcoin’s potential growth.”

Meanwhile, the Spot Bitcoin ETF issuers have helped contribute to the increase in this figure, considering they have had to accumulate BTC for their respective funds. Data from on-chain analytics firm Arkham Intelligence shows that the world’s asset manager, BlackRock, currently holds over 44,000 BTC for their Bitcoin ETF. 

Bitcoin price chart from Tradingview.com (BTC whales)

BTC Still Has More Bullish Momentum 

While many in the crypto community continue to speculate whether the bull market is back, there is reason to believe that BTC’s bullish momentum is not fading anytime soon. In his most recent X post, Ali shared how the next market peak could land around 2025 if Bitcoin is to mirror past bull runs. Going by this projection, Bitcoin is said to have 600 days of bullish momentum still ahead. 

In the meantime, Bitcoin bulls will have to overcome the selling pressure from Bitcoin whales like Grayscale. The asset manager had to offload a significant portion of its BTC holdings due to the amount of outflows it keeps recording from its Spot Bitcoin ETF. GBTC investors like FTX are reported to be taking profits, considering that the fund had traded at a significant discount to Bitcoin’s price before now.  

At the time of writing, Bitcoin is trading at around $39,000, up in the last 24 hours, according to data from CoinMarketCap. 

Bitcoin Gearing Up For Recovery As Large Whales Stop Moving Old Coins

There may finally be light at the end of the tunnel for the Bitcoin price as selling has begun to subside for the cryptocurrency. So far, it seems that the large holders have been the main driving force behind the price decline, which could explain why the rally has been suppressed for so long. However, as these large investors start to scale back their selling, the Bitcoin price could be looking at another recovery.

Bitcoin Whales Stop Selling Old BTC

According to a report posted by Santiment, the reason for the suppressed Bitcoin price over the last week could be traced back to large Bitcoin holders. These holders who have a massive stash of old coins, which means coins that have not moved in a long time, had begun to move their coins after the price of BTC found its legs due to anticipation around the Spot ETF approvals.

Once these whales began to move these coins, there was a definite drop in the asset’s price that can be linked back to this move. As these whales moved these coins out of their wallets, the age of their BTC holdings went down, suggesting that they were selling these older coins.

On average, the age of their holdings went from around 640 days to around 624 days in the days following the Spot ETF approvals by the SEC. The on-chain tracker suggests that this was a sign that the market was back in the bull market.

However, after around a week of doing this, these whales seem to have come to a point where they are no longer moving coins. “There are mild signs that this continued movement of older coins is finally done for the time being,” Santiment said.

Now, while Santiment interprets this as a sign that the bull cycle may be over, there is also the possibility that these whales have stopped moving their coins in a bid to wait for the price to recover. In this case, selling pressure will recede, allowing Bitcoin the space to regain its footing once more.

Bitcoin price chart from Tradingview.com

BTC Struggles With $43,000 Resistance

The Bitcoin price is currently struggling with the resistance mounting at $43,000. Since the crash last week, bulls have continued to lag behind as bears have chosen this level to pitch their tents. The sell pressure also seems to be localized at this point, so it has become the next important level to beat.

If Bitcoin is able to surmount the $43,000 resistance, it could signal a return of the rally. At this point, $45,000 becomes the next major resistance as investors flock back in. However, failure to turn $43,000 into support could result in a further decline in the price.

Bitcoin Whales Bought The Recent Dip While Market Panicked

On-chain data suggests the Bitcoin whales may have participated in a significant amount of buying while the market was panicking about the recent lows.

Bitcoin Exchange Netflow Has Been Quite Negative Recently

An analyst in a CryptoQuant Quicktake post pointed out that the exchanges have recently seen outflows. The indicator of interest here is the “exchange netflow,” which keeps track of the net amount of Bitcoin entering or exiting out of the wallets of all centralized exchanges. The metric’s value is calculated by subtracting the outflows from the inflows.

When the indicator has a positive value, the inflows overwhelm the outflows, and a net number of coins moves into these platforms.

As one of the main reasons investors may want to deposit their BTC to the exchanges is for selling purposes, this trend can have bearish implications for the cryptocurrency.

On the other hand, the negative metric implies withdrawals are taking place, which can be a sign that the holders are accumulating right now. Such a trend could naturally turn out to be bullish for the asset’s price.

Now, here is a chart that shows the trend in the Bitcoin exchange netflow over the past year:

Bitcoin exchange netflow

The above graph shows that the Bitcoin exchange netflow has observed some deep negative spikes recently. This suggests that some large outflows have been occurring from these platforms.

Interestingly, these withdrawals came as BTC slipped towards the $41,600 level, implying that some investors were potentially buying while the rest of the market was panicking about the drawdown.

Given the large scale of the deposits, it’s likely that whale entities were behind them. The fact that these humongous holders were willing to risk accumulating at these recent prices could be a positive sign for the continuation of the rally.

Microstrategy has also just announced its massive $615 million BTC acquisition, which can naturally be another optimistic sign for the coin. The exchange netflows occurring ahead of the announcement are interesting, though.

It’s hard to be sure if there is any connection between the two, but one possibility is that the whales who bought at these recent lows knew about the acquisitions ahead of time.

Another, and perhaps the more likely explanation, is that these large investors were looking for an entry point into the asset ahead of the potential ETF approvals, and the dip presented as good an opportunity as any to achieve so.

Whatever the case, it would seem like the moves made by the whales might have paid off so far, as the Bitcoin price has rebounded since its lows (although its recovery hasn’t been too strong yet).

BTC Price

Bitcoin had recovered to as high as $43,800 during the past day, but the asset has since slumped back down as it’s now floating around the $42,800 mark.

Bitcoin Price Chart

Bitcoin Whales Sell 50,000 BTC Worth $2.2 Billion, Is The Rally Over?

The flagship cryptocurrency, Bitcoin, seems to be cooling off following months of experiencing a resurgence on the back of the Spot Bitcoin ETF potential approval rumors. This has led to concerns that the rally might be over, a theory that is boosted by the recent action of the largest holders of the crypto token.

Bitcoin Whales Offload Some BTC Holdings

In a post on his X (formerly Twitter) platform, crypto analyst Ali Martinez highlighted a report from the market intelligence platform Santiment, which showed that Bitcoin whales had sold around 50,000 BTC over the past week. This has raised eyebrows as many speculate why these whales are offloading some of their Bitcoin holdings.

Coincidentally, these sales follow a similar trend from institutional investors as CoinShares’ latest weekly report noted that there were minor outflows from digital asset funds last week. These funds are said to have seen an outflow totaling $16 million. However, if the asset manager’s report is anything to go by, then there should be no cause for concern. 

CoinShares mentioned that the outflows seen from the digital asset investment funds are more likely to be related to profit-taking rather than a swing in sentiment. As such, one could also assume that this is the sentiment among the whales that made this recent Bitcoin sell-off. This is also very plausible, considering that Santiment recently reported that 89% of BTC’s total supply is in profit. 

Meanwhile, BTC is seeing an inflow of investors, as Santiment reported that the amount of non-zero Bitcoin addresses is up to 916.8 million. Many seem to be looking to get in on the flagship cryptocurrency as approval of a Spot Bitcoin ETF looms, and the BTC Halving draws near. 

Bitcoin price chart from Tradingview.com

BTC To Rise Above $50,000 By End Of January

While BTC seems to be cooling off, there is reason to believe that the rally isn’t over, as it could rise above $50,000 by the end of January 2024. Crypto financial services firm Matrixport predicts that this will happen on the back of the SEC approving the pending Spot Bitcoin ETF applications

Matrixport noted that they drew parallels to historical instances while making this price prediction. One of these instances is the CME Group’s Bitcoin futures launch in 2017. Bitcoin is said to have risen by 196% in a six-to-seven-week window dating to when the launch happened. They expect something similar to happen again. 

The firm also expects that Bitcoin will still break out before the year ends. This prediction is also based on historical patterns, as they noted that btc historically sees a price increase between Christmas and the New Year. Matrixport had previously predicted that Bitcoin would hit $45,000 between November this year and April 2024. 

At the time of writing, Bitcoin is trading at around $43,600, according to data from CoinMarketCap. 

Bitcoin Whales Do $2.2 Billion Selloff, But BTC Stays Strong

On-chain data shows Bitcoin whales have sold $2.2 billion worth of BTC in the past week, but price has continued to hold strong so far.

Bitcoin Whales Have Distributed Around 50,000 BTC In Past Week

As pointed out by an analyst in a post on X, the BTC whales have been participating in some selling over the past week. The relevant indicator here is the “Supply Distribution” metric from the on-chain analytics firm Santiment, which tells us about the total amount of Bitcoin that the different investor groups are carrying in their combined wallets currently.

In the context of the current discussion, “whale” entities are of interest. These humongous investors are typically defined to be the addresses who carry between 1,000 to 10,000 BTC.

At the current exchange rate of the asset, this range converts to about $43.8 million at the lower end and $438 million at the upper limit. Due to the sheer scale of their holdings, the whales can carry some influence, and therefore, they can be entities worth tracking on the blockchain.

Now, here is a chart that shows the trend in the Bitcoin Supply Distribution specifically for these large holders over the past month:

Bitcoin Whale Supply

As displayed in the above graph, the supply held by the Bitcoin whales has been showing a decline in the past week, after remaining stagnant for the preceding few weeks.

Most of the selling had come while BTC was still trading at the recent lows, suggesting that these were whales who had been panicking after BTC had failed its recovery run towards $44,000.

In total, these humongous investors have shed about 50,000 BTC from their combined wallets during this latest selloff, which is worth almost $2.2 billion right now.

Despite this selling, Bitcoin has gone on to hit another local bottom and make a recovery push again, this time actually making a retest of the $44,000 level (although the asset has slumped again since then, as it’s now trading below the mark once more).

Another analyst has also given a whale selling alert in a CryptoQuant Quicktake post, citing the data for the “exchange inflow mean,” which is an indicator that measures the mean amount of Bitcoin that’s being transferred to centralized exchanges.

quicktake-image

Exchange inflows can be a sign of selling as investors generally use these platforms for this purpose. The mean value of these deposit transactions shooting up naturally implies that large entities like the whales are involved and potentially participating in a selloff.

From the chart, it’s apparent that this metric has seen a couple of spikes in the last two days, suggesting that the whales are still continuing to make moves towards selling.

BTC Price

At the time of writing, Bitcoin is trading around $43,500, up 3% in the past week.

Bitcoin Price Chart

Bitcoin Whales Driving The Rally Are Now Taking Profits, Data Suggests

Data shows that the Bitcoin whales that may have been helping drive the latest rally have switched to profit-taking instead.

Bitcoin Whales On BitMEX Have Changed Their Tune Recently

An analyst in a CryptoQuant Quicktake post explained that the BitMEX whales were likely the ones helping fuel the latest rally. The relevant indicator here is the “Open Interest,” which keeps track of the total amount of Bitcoin derivative positions open on a centralized exchange.

When this metric’s value increases, investors are opening up new contracts on the platform. On the other hand, a decline suggests the holders are either getting liquidated or closing up their positions of their own volition.

Now, here is a chart that shows the trend in the Bitcoin Open Interest for two exchanges, BitMEX and Binance, over the past few weeks:

Bitcoin BitMEX Whales

The graph shows that the Bitcoin Open Interest on BitMEX had observed a sharp rise at the start of the month when the cryptocurrency’s price was still trading around the $38,000 level.

This open interest increase followed a sharp rally for BTC towards the $44,000 mark. As is visible in the chart, the indicator’s value for Binance also registered an increase as the rally occurred, but BitMEX’s rise stands out as it was huge and pretty much happened in one go before the rally.

Since BTC has hit its local top above the $44,000 level, though, the BitMEX Open Interest has plummeted, implying a large-scale closure of positions on the platform has taken place. On the other hand, the metric’s value for Binance has continued to stay high.

The quant has also attached charts of another metric for the two exchanges: the “Funding Rates.” The funding rates keep track of the periodic fee the derivative traders on an exchange currently pay each other.

When this indicator has a positive value, the longs are paying a premium to the shorts to hold onto their positions right now. This suggests that the traders on the platform share a majority of bullish sentiment.

The BitMEX Funding Rates had been favorable for the duration that the Open Interest had been at high levels, implying that most positions had been extended. However, with the plunge in the indicator, the Funding Rates have returned to neutral values.

Based on this pattern, the analyst thinks the BitMEX whales, potentially driving the rally earlier, have already taken their profits, as they closed up a large chunk of their positions near the top.

The Open Interest hasn’t completely retraced itself yet, but the fact that most of these whales have decided to pull out may be a troubling sign for the rally’s continuation.

BTC Price

Bitcoin has seen some retrace during the past day as the coin’s price is now floating around $43,600.

Bitcoin Price Chart