Hong Kong Bitcoin ETF Readies For Stellar Debut, Expected To Outshine $125M US Launch

The eagerly anticipated Hong Kong Bitcoin ETF market is scheduled to commence trading on Tuesday, marking a significant milestone in the increasing adoption of the leading cryptocurrency and building upon the success of the US ETF market. 

With their approval, the newly regulated index funds are poised for a noteworthy debut, surpassing the first-day inflows in the United States.

HK Bitcoin ETF Market Poised For Record-Breaking Debut

Zhu Haokang, the Digital Asset Management Supervisor and Family Wealth Supervisor at Warsaw Fund expressed great confidence in the trading volume of Hong Kong Bitcoin ETFs on its inaugural day.

This volume exceeded the scale achieved during the US launch on January 10th of this year, which amounted to over 125 million US dollars. 

Haokang further stated that Huaxia, one of the three ETF issuers, is confident in becoming the largest ETF issuer on the first day of trading. At the same time, OSL, a digital asset platform, has already completed the initial fundraising with two funds, including Huaxia. 

Furthermore, the capital inflow during the Hong Kong spot Bitcoin ETF’s first-day listing transaction has surpassed that of the US spot ETF market. 

According to Haokang, this difference can be attributed to two factors: the purchase and redemption of spot and in-kind transactions, which are unavailable in the US spot Bitcoin ETF.

Unprecedented Investment Options

One unique aspect of the China Summer Fund’s Hong Kong spot ETF is its incorporation of Hong Kong dollars, US dollars, and dual counter offers (RMB counters), distinguishing it from the other two offerings. 

Additionally, the fund features a non-listed share alongside the listed share, further setting it apart from its counterparts. Given the physical purchase method, investors, including Bitcoin miners, can directly acquire the Hong Kong virtual asset spot ETF using the Bitcoin they already hold. 

Moreover, outreach efforts have reportedly been made to attract investors from countries and regions without ETF offerings, such as Singapore and the Middle East, generating significant interest.

Despite the substantial market size of the current US spot Bitcoin ETF market, Hong Kong’s utilization of cash and in-kind subscriptions, coupled with the appeal of open trading during Asian market hours, is expected to attract numerous American investors, according to Haokang. 

Mainland Chinese Investors Restricted

Wayne Huang, OSL ETF and Trusteeship Business Manager, highlighted that Victory Securities could facilitate physical purchases, and the winning securities in China can also leverage OSL’s support. 

Three vouchers enable physical purchases, with more expected to follow suit. Following the ETF’s listing, various voucher chambers of commerce are likely to participate, increasing the overall ecosystem of the Bitcoin ETF market in May.

On the other hand, Zhu Haokang also clarified that mainland Chinese investors are currently restricted from investing in Hong Kong’s spot ETF market. However, qualified investors, institutional investors, retail investors, and qualified international investors in Hong Kong can participate in the spot ETF race. 

Individuals seeking further details are advised to consult voucher providers and sales channels while closely monitoring potential regulatory adjustments and the development of a specific regulatory framework in the future.

Bitcoin ETF

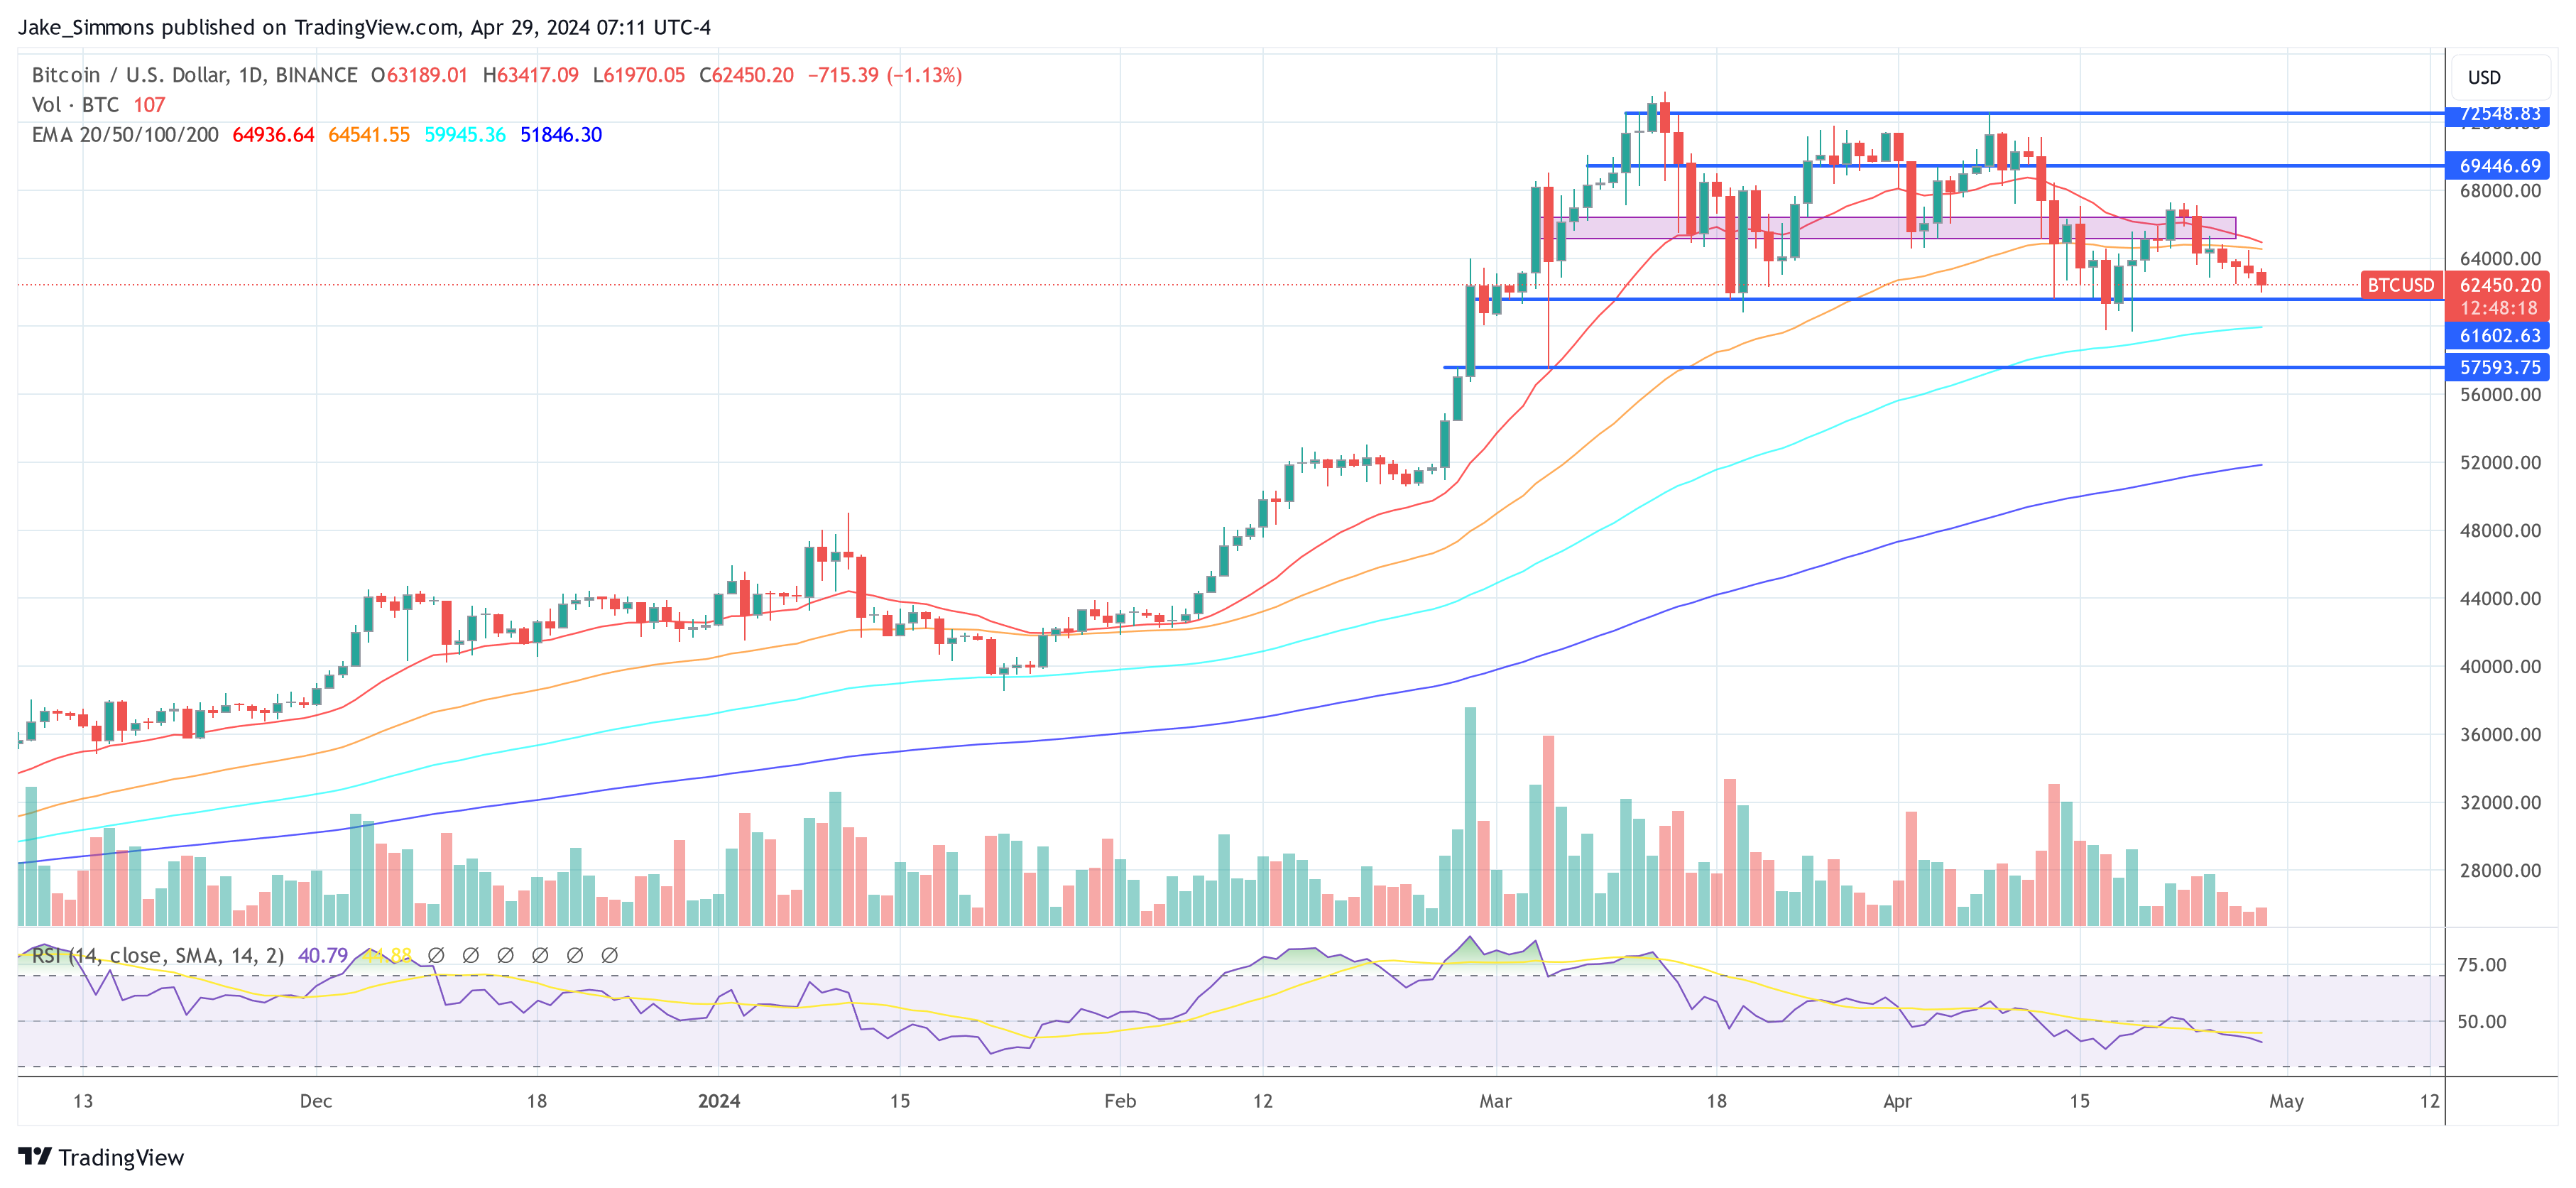
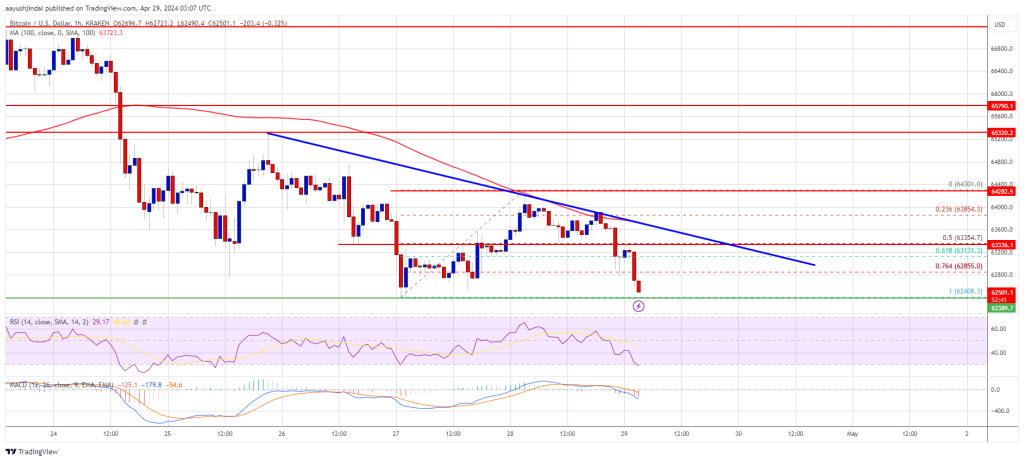
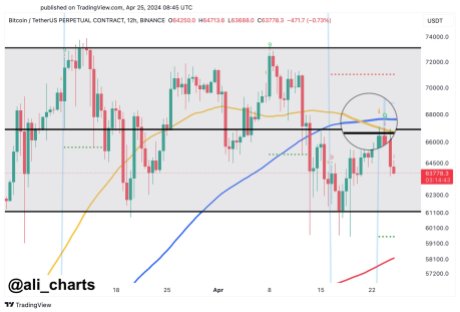
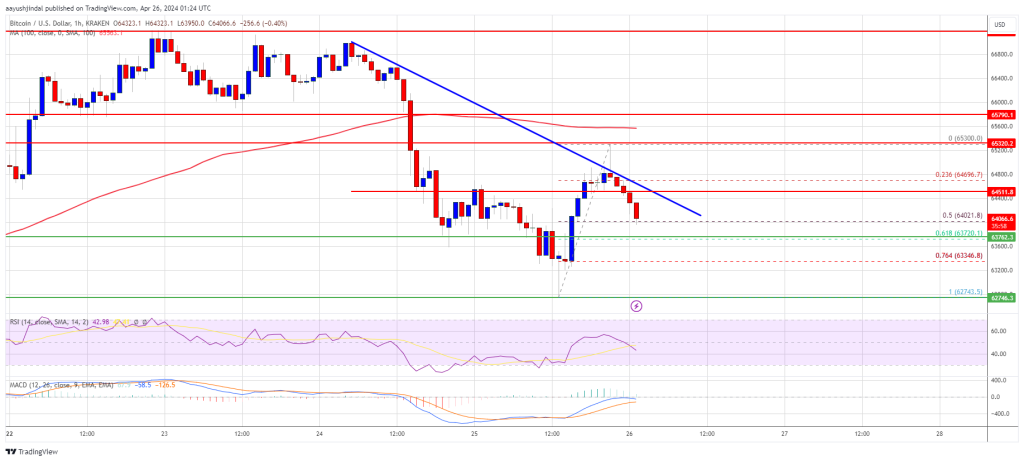
Currently, BTC is trading at $63,000 after failing to consolidate above the key $66,000 level in recent days. However, the launch of the ETF market in Hong Kong is expected to significantly impact the price of BTC in the long run. 

Featured image from Shutterstock, chart from TradingView.com 

Bitcoin Dominance: Traders Preferring The OG To Dogecoin & Other Altcoins

On-chain data suggests Bitcoin has recently experienced an influx of investors while Dogecoin, Cardano, and other altcoins have seen a slowdown.

Bitcoin Total Amount Of Holders Rise While Altcoins See Flat Movement

According to data from the on-chain analytics firm Santiment, the number of Bitcoin investors has sharply increased recently. The on-chain metric of interest here is the “Total Amount of Holders,” which keeps track of the total number of addresses on a given network carrying some non-zero balance.

When the value of this indicator goes up for any asset, it can be due to several things. The first and most obvious contributor to this trend would be adoption, as a fresh influx of users would naturally create more addresses.

Another contributor could be old investors returning to reinvest in the coin after selling out their balance earlier. The indicator would also increase when investors spread out their holdings among multiple wallets for reasons like privacy.

In general, some net adoption occurs whenever the Total Amount of Holders goes up. Historically, adoption has been a constructive sign for any blockchain in the long term.

Naturally, when this metric’s value goes down, it implies that some investors have decided to exit from the cryptocurrency as they have completely cleaned out their wallets.

Now, here is a chart that shows the trend in the Total Amount of Holders for some of the top assets in the sector: Bitcoin (BTC), Ethereum (ETH), XRP (XRP), Cardano (ADA), Dogecoin (DOGE), and Chainlink (LINK).

Bitcoin Total Amount of Holders Vs Dogecoin

As displayed in the graph, Dogecoin started 2024 with some rapid adoption as its Total Amount of Holders had been observing a sharp uptrend. However, this growth only lasted for the first couple of months, as the metric has since flattened for the memecoin.

Other altcoins like Chainlink and Cardano have also witnessed flat action in the metric in this period. The trend had been just the opposite for Bitcoin, where more or less flat movement had occurred in its number of investors earlier in the year, but the asset has seen some uptrend in the metric this month.

It’s possible that investors were previously attracted to Dogecoin and other networks, but now that markets have been undergoing bearish price action, traders are back to preferring the original cryptocurrency.

Overall, DOGE’s holders are still up 13.8% in the past three months, while BTC’s growth stands at 2.6%. Naturally, the latter’s userbase is also larger, so a relatively small percentage could be due to that.

Cardano is among the few networks in the sector that have observed negative action in the Total Amount of Holders during this window, although the decrease is a mere 0.1%.

BTC Price

Bitcoin has been struggling to make any recovery run count recently, as its price is back at $63,000 after the latest failed attempt.

Bitcoin Price Chart

Bitcoin Price Prediction For May: Crypto Analyst Predicts Breakdown To $42,000

Crypto analyst DonAlt has outlined a scenario where the Bitcoin price could drop to as low as the mid-$40,000. He further suggests that this price breakdown might be necessary for the continuation of BTC’s bull run.

How Bitcoin Could Drop To As Low As $47,000

In an update to his Bitcoin analysis, DonAlt noted that Bitcoin had dropped back to around the $60,000 price range and could eventually break that support if it continues to be tested. From the accompanying chart he shared, the crypto analyst hinted that a price breakout below the $60,000 range would see Bitcoin drop to $52,000 or even further down to $47,000. 

Bitcoin price prediction

Meanwhile, he added that this might be something even the bulls want, so there could be a washout below $60,000, which would shake off weak hands. DonAlt also seems to support a price breakout below the support area, as he shared his belief that there is currently complacency in the market. 

This is when crypto investors ignore the risks associated with Bitcoin, having seen price increases for an extended period. DonAlt said he would continue to hold this complacency belief until proven otherwise. For that to happen, he remarked that Bitcoin would need to reclaim $68,000 or drop below $60,000 and reclaim that support level again. 

Denis Baca, Head of Product at Zivoe Finance, also recently suggested that BTC could drop below $60,000 before it makes any parabolic move. This was a huge possibility, especially since Baca noted that the flagship crypto historically retests the support level of the 20-week SMA (small moving average) in May. He claimed this could cause Bitcoin to drop to $56,000. 

BTC Bulls Are Getting Overwhelmed By The Bears

Bitcoin bulls look to be succumbing to the pressure from the bears. Crypto analyst Ali Martinez revealed in an X post that there has been a “noticeable dip in Bitcoin whale activity” since March 14. This suggests the current market downtrend could be diminishing their confidence, as these whales are always known to accumulate more during every price dip. Martinez added that a “surge in whale transactions could be the spark needed to boost” BTC’S price.

Meanwhile, CryptoQuant’s Head of Research, Julio Moreno, recently noted that Bitcoin’s price has remained tepid due to the slowdown in demand. He alluded to the Spot Bitcoin ETFs, which have seen their demand decline this month. Like Martinez mentioned, Moreno stated that there needs to be a “demand growth” for Bitcoin to experience another rally. 

At the time of writing, Bitcoin is trading at around $62,300, down over 2% in the last 24 hours, according to data from CoinMarketCap. 

Bitcoin price chart from Tradingview.com

This Bitcoin Metric Foreshadowed Recent Price Drops, Quant Reveals

A quant has pointed out how a Bitcoin metric may have detected selling pressure in the market, and therefore, the subsequent price drops, in advance.

Bitcoin CDD Registered Spikes Before Recent Price Plunges

In a new post on X, an analyst has discussed about how the Coin Days Destroyed (CDD) on-chain indicator may be used to identify selling pressure in the market early.

A “coin day” refers to the quantity that 1 BTC accumulates after staying still on the blockchain for 1 day. When a token stays dormant for a while, it naturally accumulates some number of coin days, and once it’s finally transferred on the network, its coin days counter resets back to zero.

The coin days that this token had been carrying prior to this movement are said to be “destroyed” by the transaction. The CDD keeps track of the total number of such days being reset across the network on any given day.

Now, here is a chart that shows the trend in the CDD for Bitcoin over the last couple of months:

Bitcoin CDD

As displayed in the above graph, the Bitcoin CDD observed a large spike just a few days ago. Whenever this metric’s value shoots up, it means that a large amount of coins previously dormant are now on the move.

Such transfers are generally correlated with the long-term holder whales, who are large entities who carry their coins for significant periods, and thus, accumulate a large number of coin days.

Often, when these dormant entities finally break their silence, it’s for selling-related purposes. As such, spikes in the CDD can be an indication that the HODLer whales have decided to do some selling.

In the chart, the quant has highlighted the major spikes that the indicator observed during the last two months. It would appear that following the onset of such spikes, the asset’s price has generally gone on to witness some bearish action.

The aforementioned spike from a few days ago, too, has proven to be bearish for the asset so far as it occurred when Bitcoin had recovered towards $67,000, and the price has since erased this recovery. It would appear that some of these diamond hands had looked at this surge as an exit opportunity.

Last month, the CDD had seen two spikes even larger than this recent one. These spikes had occurred near what continues to be the top for the rally so far. Thus, the selling pressure from HODLers may have played a role in this top and the subsequent drawdown that followed.

Given the relationship that this metric has appeared to have held with the Bitcoin price, it may be worth keeping an eye on it, as it may continue to indicate the onset of selling pressure in the near future as well.

BTC Price

Bitcoin has continued its bearish trajectory during the past day as it has now slipped towards the $62,300 level.

Bitcoin Price Chart

Bitcoin Long-Term Outlook: Analyst Foresees Peak In Late 2025

Following the fourth Bitcoin Halving, Rekt Capital, a popular cryptocurrency trader and expert, has offered a compelling narrative on the future trajectory of Bitcoin, predicting that the crypto asset could peak this bull cycle in the following year. Rekt Capital’s analysis emphasizes on the possibility that this current cycle could reiterate past Halving cycle trends, positioning BTC for significant gains in the coming months.

Bitcoin Could Mirror Past Halving Cycle

According to the analyst, Bitcoin reached its all-time high within 518 days following the Halving in the 2015–2017 cycle. Meanwhile, after the event in the 2019-2021 bull cycle, the digital asset topped out within 546 days. This suggests that the event has always catalyzed massive growth for the leading cryptocurrency asset.

Should the past trend hold, the next bull market top might happen between 518 and 546 days following the recently concluded fourth Halving, particularly around the middle of September or middle of October in 2025, according to Rekt Capital.

The analyst noted that in this cycle Bitcoin is accelerating by about 220 days currently. Thus, the longer time BTC consolidates after this Halving, it will be better for resynchronizing this current cycle with the previous events cycle.

Bitcoin

Rekt Capital also noted that Bitcoin has experienced further declines in the three weeks after the Halving, according to historical data from 2016. He has labeled the period as the Post-Halving “Danger Zone,” this is where there is a chance of downside volatility at the range low of the Re-accumulation Range.

In 2016, approximately 21 days after the occurrence, Bitcoin saw a lengthy -11% decline before gaining momentum toward the upside. However, data for 2016 indicates that if there will be downside volatility in this cycle around the Re-Accumulation Range Low, it may happen during the following 15 days.

Although the post-Halving danger zone ends in 15 days, the 2016 data indicates that there may be some negative volatility in the interim, possibly reaching the $60,600 Range Low.

Parabolic Phase For BTC

It is worth noting that Rekt Capital anticipates a parabolic phase after the re-accumulation phase is concluded. During this stage, Bitcoin usually sees massive growth leading all the way up to a new all-time high.

In the previous Halvings, Bitcoin would historically consolidate in this Re-Accumulation Range for up to 150 days before ultimately entering a parabolic phase. Once BTC breaks out of this re-accumulation stage, Rekt Capital expects BTC to see a parabolic upside by September this year if it consolidates within the aforementioned timeframe.

At the time of writing, BTC was down by over 5% in the past 7 days and was trading at $62,504. Presently, its market cap is down by 1.53%, while its trading volume has increased by over 22% in the last 24 hours.

Bitcoin

CryptoQuant Analyst Reveals Signal That Shows Bitcoin Is Still Very Bullish

The Bitcoin price movement in the past few days after the halving event has left many investors wanting. Particularly, price data shows the crypto failed to settle above $65,000 las week. At the time of writing, Bitcoin is trading at $62,105, down by 2.96% and 6.14% in the past 24 hours and seven days, respectively. 

According to a CryptoQuant analyst, Bitcoin’s Adjusted Spent Output Profit Ratio (aSOPR) is still looking bullish, which could be a faint signal of the crypto’s price reversing into bullish momentum.

Current State Of Bitcoin

As it stands, the price of Bitcoin might be on the way to registering a new monthly low with the risks of more downside below $62,000. A recent analysis during the weekend by Phi Deltalytics, an analyst at CryptoQuant, noted that Bitcoin’s price trajectory is showing indecisiveness in the short term. His analysis is based upon the SOPR ratio, one of the lesser-known but highly useful metrics for analyzing Bitcoin.

SOPR measures the profit ratio of spent outputs, which are groups of transactions representing the movement of coins.  Phi’s analysis revealed an interesting indecisiveness with this metric. According to this metric, Bitcoin’s short-term Spent Output Profit Ratio (SOPR) has entered into a zone of indecisiveness, correlating with the current market sentiment. However, the analyst also noted that the adjusted SOPR continues to move in a bullish direction, a confluence that warrants careful planning when entering the market.

What Does This Mean for Bitcoin?

This discrepancy with the SOPR and its adjusted ratio means many short-term holders are now trading Bitcoin at a loss. Interestingly, another CryptoQuant analysis seems to support this idea. Specifically, the long-term SOPR to short-term SOPR ratio is moving in favor of long-term holders, suggesting that long-term holders are realizing greater profits in contrast to short-term holders. Hence, there is persistence of bullish momentum with the adjusted SOPR. 

A better interpretation of this SOPR ratio is that the price of Bitcoin has not been favorable for short-term holders at the current market conditions. Furthermore, it suggests that the stalling of the upward momentum can be attributed to some long-term holders cashing out their holdings. 

According to Phi Deltalytics, a reversal of the adjusted SOPR into a bearish signal would finally imply the possibility of a rapid downward shift in the price of Bitcoin.

“The persistence of a bullish aSOPR amidst wavering short-term SOPR trends gives rise to the possibility of a rapid downward shift once the aSOPR trajectory reverses,” the analyst mentioned.

When Will The Correction End?

Bitcoin’s price has been ranging between $60,000 to $70,000 since it reached a new all-time high. The much-anticipated break above $74,000 now seems to be taking forever, and this lackluster action has prompted some analysts to believe that Bitcoin might have reached its peak in the current market cycle. 

However, time can only reveal the crypto’s price trajectory in the coming months, particularly with the recent conclusion of another halving event. If halving history repeats itself, Bitcoin could continue its price surge within the next nine months.

Bitcoin price chart from Tradingview.com

Legendary Trader Predicts When Bitcoin’s Bull Run Will End

In a recent analysis, veteran trader Peter Brandt delved into the price behavior of Bitcoin, suggesting that the cryptocurrency might have reached its peak for the current cycle. According to Brandt, Bitcoin is exhibiting signs of “Exponential Decay,” indicating a weakening in the momentum of its bull market cycles over the years.

“Does history make a case that Bitcoin has topped? It’s called Exponential Decay — and it describes Bitcoin,” Brandt wrote. He further explained, “The fact is that the bull market cycles in Bitcoin have lost a tremendous amount of thrust over the years… I don’t like the Exponential Decay occurring in Bitcoin — Bitcoin is one of my personal largest investment positions.”

Brandt provided a historical breakdown of Bitcoin’s bull cycles, noting a consistent decrease in the magnitude of gains:

  • The bull cycle from December 21, 2009, to June 6, 2011, demonstrated a staggering 3,191X advance.
  • The subsequent cycle from November 14, 2011, to November 25, 2013, showed a reduced yet impressive 572X advance.
  • The period from August 17, 2015, to December 18, 2017, recorded a further diminished 122X advance.
  • More recently, the cycle from December 10, 2018, to November 8, 2021, saw just a 22X advance.

Bitcoin Reached Its Cycle Peak With A Probability Of 25%

Drawing on these historical patterns, Brandt extrapolated that the current cycle, which began on November 21, 2022, would likely see an approximate 4.5X gain from its low of $15,473, predicting a potential high near $72,723. Notably, this peak has already been nearly met with a price of $73,835 recorded on March 14, 2024. Brandt underscores this observation with a caution, “The magnitude of each bull cycle has been roughly 20% of its predecessor, indicating significant energy loss.”

In his analysis, Brandt does not shy away from addressing the implications of Bitcoin’s halving events, which have historically been catalysts for substantial price increases. Despite this, he emphasizes the undeniable presence of the decay pattern: “But for now, we need to deal with the fact of Exponential Decay. It has happened. It is real. You may not want to believe it, but I place a 25% chance that Bitcoin has already topped for this cycle.”

In a communication on X, Brandt responded to a counter analysis by fellow analyst @Giovann35084111, who argued that Bitcoin follows a power law over time, suggesting the potential for ongoing growth despite the observed decay. Brandt acknowledged the validity. “Quite a thorough analysis,” Brand commented.

@Giovann35084111’s analysis extends beyond cyclical trends by illustrating how deviations from the power law at specific intervals, particularly around halving events, provide a structured prediction model. This approach projects systematic patterns in Bitcoin’s price movements, reinforcing a bullish outlook. The analyst predicts a significant rise in Bitcoin’s price, estimating the next top at the end of 2025 to reach between $210,000 and $250,000.

In a later post, Brandt emphasized that his main prediction is an ongoing bull market into September/October 2025. He explained, “I give more credence to a report I issued in February. Here is a chart from that analysis — projecting a bull market until Sep/Oct 2025,” indicating that his views are influenced by evolving market data and theoretical models.

At press time, BTC traded at $62,450.

Bitcoin price

Bitcoin Price Grinds Lower As Bears Aim For New Monthly Low

Bitcoin price struggled to settle above the $65,000 zone. BTC is again moving lower and there is a risk of more downsides below $62,000.

  • Bitcoin started another decline after it failed to surpass the $64,000 resistance zone.
  • The price is trading below $64,500 and the 100 hourly Simple moving average.
  • There is a key bearish trend line forming with resistance at $63,350 on the hourly chart of the BTC/USD pair (data feed from Kraken).
  • The pair could accelerate lower if there is a daily close below the $62,400 support zone.

Bitcoin Price Dives Again

Bitcoin price attempted a fresh increase above the $64,000 zone. However, BTC failed to gain pace for a move above the $65,000 resistance zone. A high was formed at $64,301 and the price started another decline.

There was a move below the $63,800 level. The price declined below the 50% Fib retracement level of the upward move from the $62,408 swing low to the $64,301 high. Bitcoin is now trading below $63,200 and the 100 hourly Simple moving average.

There is also a key bearish trend line forming with resistance at $63,350 on the hourly chart of the BTC/USD pair. The pair is signalling a bearish bias below the 76.4% Fib retracement level of the upward move from the $62,408 swing low to the $64,301 high.

Immediate resistance is near the $63,350 level or the trend line. The first major resistance could be $64,000 or $64,300. A clear move above the $64,300 resistance might send the price higher. The next resistance now sits at $65,000.

Bitcoin Price

Source: BTCUSD on TradingView.com

If there is a clear move above the $65,000 resistance zone, the price could continue to move up. In the stated case, the price could rise toward $65,500. The next major resistance is near the $66,200 zone. Any more gains might send Bitcoin toward the $67,500 resistance zone in the near term.

More Losses In BTC?

If Bitcoin fails to rise above the $63,350 resistance zone, it could continue to move down. Immediate support on the downside is near the $62,400 level.

The first major support is $62,000. If there is a close below $62,000, the price could start to drop toward $61,200. Any more losses might send the price toward the $60,000 support zone in the near term.

Technical indicators:

Hourly MACD – The MACD is now gaining pace in the bearish zone.

Hourly RSI (Relative Strength Index) – The RSI for BTC/USD is now below the 50 level.

Major Support Levels – $62,400, followed by $62,000.

Major Resistance Levels – $63,350, $64,000, and $65,000.

Expert Says Bitcoin Price Has Topped And Is In Exponential Decay, Why This Is Not A Bad Thing

Crypto expert Peter Brandt has boldly claimed that the Bitcoin top for this market cycle may already be in. He made this conclusion based on his “exponential decay” thesis, which he noted may actually be good for the Bitcoin ecosystem.

Why Bitcoin’s Price Has Topped

Brandt explained that historical data suggests that Bitcoin’s price has topped. He further alluded to an “exponential decay,” which he noted could be used to describe Bitcoin. Brandt’s exponential decay thesis is based on the fact that Bitcoin’s percentage gain has significantly reduced in every subsequent bull cycle. 

For context, Bitcoin, according to the crypto expert, recorded a 122x increase from its market low to market high between 2015 and 2017. However, that was only 21.3% of Bitcoin’s price gain in the previous cycle (between 2011 and 2013).

Bitcoin price

Source: X

Brandt further noted that the same thing happened between 2018 and 2021. Despite a 22x increase from its market low to market high, Bitcoin only recorded 18% of the price increase it saw in the previous cycle. Having laid this premise, the crypto expert concluded that this market cycle shouldn’t be any different as Bitcoin will likely see about 20% of the price gain recorded in the previous cycle. 

Taking $15,473 as the market low for this cycle, he noted that 20% of the previous cycle’s gain would mean that the market high for this cycle was supposed to be $72,723, a price level that Bitcoin already hit on its way to a new all-time high (ATH) of $73,750. 

Meanwhile, the crypto expert acknowledged that Bitcoin historically records its most price gains after the Bitcoin halving, which just recently occurred. However, he added that the crypto community has to deal with the fact of the exponential decay, which has made him believe there is a 25% chance that Bitcoin has already topped this cycle.”

Why The Exponential Decay Might Be Bullish For Bitcoin

Brandt mentioned that Bitcoin would likely drop to the mid $30,000 or its 2021 lows if it has indeed topped. He, however, added that this decline could be the “most bullish thing that could happen from a long-term view.”

Related Reading: Brace For Price Impact: Dogecoin Whales Move Massive 456 Million DOGE To Exchanges

From a “classical charting point of view,” the crypto expert hinted that Bitcoin was still primed for major parabolic moves to the upside, even though it doesn’t happen now. 

He also shared an example of what Bitcoin’s chart could look like when this move happens with the crypto token rallying above $100,000. Brandt also alluded to Gold’s chart from August 2020 to March 2024 as an example of what Bitcoin’s price action could look like soon enough. Interestingly, he recently predicted that Bitcoin will soon be “King over Gold.”

Bitcoin price chart from Tradingview.com

Bitcoin Drops Below 4-Hour MA – Bearish Trend Ahead?

Following a pullback, the price of Bitcoin has continued on its downward movement. The coin, after failing to break above the 100-day Simple Moving Average (SMA) and the trend line has experienced a drop of over 6% from its previous high.

Will the price of BTC continue to move in a downward direction or will it reverse and start moving in an upward direction?

As of the time of writing, the price of BTC was trading around $62,972 which is about 28% down from its all-time high and was down by 1.27% in the last 24 hours. Although the price is trading below the 100 SMA on the 4-hour chart, on the daily chart it is still trading above the 100 SMA.

Current Condition Of Indicators And What They Suggest

Looking at the chart, technically a support level and a resistance level of $59,653 and  $67,255 were formed respectively. However, there could be more support and resistance levels created if the price continues to move downward.

Bitcoin

4-Hour Moving Average: A technical observation of the chart from the 4-hour timeframe as seen in the image below reveals that the price is trending below the 100-day moving average. This suggests that the price is on a downtrend and could potentially move further downward.

4-Hour RSI indicator: The Relative Strength Index (RSI) indicator here suggests a downward trend as the RSI signal has crossed and is trending below the 50% line as observed on the above chart.

Bitcoin

The MACD indicator from the 4-hour chart also suggests that the price might continue to move downward as the MACD histograms are trending below the zero line. Both the MACD line and the Signal line have crossed and are trending below the MACD zero line, indicating a bearish trend, as seen in the above image.

Possible Outcome

With the setup of the above indicators, it can be suggested that the price of Bitcoin is still bearish and that there are possibilities that it could still move further downward.

If Bitcoin continues downward and breaks below the support level of $59,653, it could witness a deep correction to create a new support level. However, if the price fails to break below this support level, it could start an upward correctional movement towards its previous level of $67,255 and if it manages to break above this level, the price will begin an uptrend.

Bitcoin

Bitcoin Enters ‘Danger Zone’ Post-Halving, Analyst Warns Of Potential Downside

Following the halving event on April 19, the price of Bitcoin has displayed a puzzling performance. BTC initially gained nearly 10% to trade as high as $67,020 on April 24. However, in the last two days,  the digital asset’s price has declined by 6.49%, falling below the $63,000 price mark. 

As expected, such negative performance has drawn attention from investors and market speculators. In particular, renowned analyst with X handle Rekt Capital has provided a theory on Bitcoin’s price fall and perhaps an insight into the future price movements of the crypto market leader.

BTC Potential Price Decline Ahead?

In an X post on April 26, Rekt Capital stated that Bitcoin has now entered the Post-Halving “Danger Zone.” The analyst described this phenomenon as a period during which Bitcoin has historically experienced price corrections after the halving event. Rekt Capital noted that in 2016, Bitcoin recorded these price retraces in the three weeks following the Halving event. During this time, the token’s price declined by 11%. 

The analyst postulates that Bitcoin is now in the Post-Halving “Danger Zone” of the current bull cycle following its price fall over the last two days. It is worth stating that if Bitcoin mirrors past price movement in this phase, the token could be heading for $60,000. However, Rekt Capital states that if the crypto market leader experiences such a fate, it will be within the next two weeks. 

At the time of writing, Bitcoin trades around $62,672 with a decline of 2.44% in the last day. This price fall underscores BTC’s negative performance in the last month in which it has lost 11.16% of its market value. 

BitcoinBTC trades at $63,023 on the daily chart | Source: BTCUSD chart on Tradingview.com

Bitcoin ETFs Record Minor Inflow; Net Outflows Hit $217 Million

According to data from SoSoValue, the Bitcoin Spot ETF market recorded net outflows to the tune of $217 million on April 25. Unsurprisingly, Grayscale’s GBTC accounted for $138 million of these figures as its total outflows now approach $17 billion.

Notably, for the first time ever, Fidelity’s FBTC and Valkyrie’s BRRR  produced net outflows estimated at $22 million and $20 million, respectively. Meanwhile, ARK Invest’s ARKB and Bitwise’s BITB also experienced a loss in investment on Thursday.

Interestingly, all other Bitcoin Spot ETFs recorded zero net flows except Franklin Tempton’s EZBC, which saw a net inflow of $1.87 million. At the time of writing, the BTC spot ETFs have a combined value of $128 billion, reflecting a remarkable growth since their trading debut on January 11.

Forbes Unveils 20 Crypto ‘Zombies,’ Declares Ripple And XRP Among The Undead

In a controversial report, Forbes unveiled a list of 20 “crypto billion-dollar zombies,” Layer 1 (L1) tokens, which the news outlet defines as crypto assets with substantial valuations but “limited utility beyond speculative trading.” 

These cryptocurrencies and projects include Ripple, XRP, Ethereum Classic (ETC), Tezos (XTZ), Algorand (ALGO), and Cardano (ADA), among others. 

XRP And Ethereum Classic In The Spotlight

Ripple Labs, the company behind XRP, was highlighted as a prominent crypto zombie. Despite XRP’s active trading volume of around $2 billion daily, Forbes asserts that the token’s primary purpose remains “speculative” and “lacking meaningful utility.” 

However, Ripple Labs and XRP are not alone in this regard. Forbes reveals that 50 blockchains, excluding Bitcoin (BTC) and Ethereum (ETH), currently trade at values surpassing $1 billion, with at least 20 of them classified as “functional zombies.” Collectively, these 20 blockchains hold a market value of $116 billion, despite having “limited user bases.”

Crypto

According to Forbes, an example of a “functional zombie” is Ethereum Classic, which maintains the distinction of being the original Ethereum chain. 

While ETC has a market value of $4.6 billion, its fee generation in 2023 was less than $41,000, raising questions about the blockchain’s viability for the news organization.

Another crypto project in Forbes’ report is Tezos, which raised $230 million through an initial coin offering (ICO) in 2017. 

Tezos’ XTZ token currently holds a market capitalization of $1.2 billion. However, the blockchain’s fee earnings were meager, with $5,640 in February 2024 and a total of $177,653 for all of 2023. 

Algorand, once hailed as an “Ethereum killer” due to its capability of processing 7,500 transactions per second, faces similar challenges. 

Despite a market cap of $2 billion and a treasury holding of $500 million, Algorand earned $63,000 in blockchain transaction fees throughout 2023. For Forbes, this casts doubt on its actual adoption and utility.

Crypto ‘Zombie’ Blockchains

The zombie blockchains are categorized into two groups by Forbes: spin-offs and direct competitors to established blockchains like Bitcoin and Ethereum. 

Spin-off zombies include Bitcoin Cash (BCH), Litecoin (LTC), Monero (XMR), Bitcoin SV (BSV), and Ethereum Classic. 

These blockchains, collectively valued at $23 billion, reportedly emerged from “disagreements” among programmers regarding the governance and direction of the original chains

Forbes notes that when such conflicts arise, hard forks occur, resulting in new networks that share the same transaction history as their predecessors. The agency claims that their market value “often exceeds” their real-world usage.

Overall, The report highlights a growing disparity between the valuations of certain projects in the cryptocurrency industry and their actual utility and usage. Consequently, Forbes refers to these projects as “zombies.”

Crypto

Featured image from Shutterstock, chart from TradingView.com 

Timing The Breakout: When Will Bitcoin Escape The Post-Halving Consolidation?

Bitcoin (BTC), the largest cryptocurrency in the market, has been trading within a re-accumulation range between the $59,000 and $70,000 price levels for the past month and a half. 

Crypto analyst Rekt Capital recently shared its perspective on this phase and its potential duration, drawing from historical patterns and data in a post on social media platform X (formerly Twitter).

Breakout Timing And Historical Patterns

According to Rekt’s analysis, Bitcoin tends to experience a re-accumulation range following the Halving event, which occurs every four years to counteract any inflationary effect on Bitcoin by lowering the reward amount for miners and maintaining scarcity. 

Historically, This consolidation phase lasts up to 150 days before Bitcoin breaks into a parabolic uptrend. Based on this pattern, if Bitcoin continues to consolidate for the next 150 days, Rekt suggests a breakout would be expected in September 2024.

The ideal duration of a re-accumulation range is crucial in determining Bitcoin’s future trajectory. Rekt Capital noted that when Bitcoin reached a new all-time high (ATH) of $73,700 in mid-March, it accelerated its cycle by 260 days. However, with over 49 days of consolidation, the acceleration has reduced to approximately 210 days.

Resetting The Bitcoin Halving Cycle

Repeating historical trends, where Bitcoin consolidates for 150 days after the Halving, would still indicate an acceleration in the current cycle, albeit by a lesser extent of 60 days. 

Nevertheless, Rekt contends that Bitcoin would ideally need to consolidate for at least 210 days to fully resynchronize with its historical Halving cycles and reset the current acceleration in this cycle to 0. This would bring the rate of acceleration to 0 days and potentially lead to a breakout around November 2024.

The analyst further suggested that to achieve a 200+ day post-Halving consolidation and fully resynchronize with historical Halving cycles, Bitcoin would need to replicate its mid-2023 re-accumulation range, which lasted 224 days before a new uptrend emerged. Rekt concluded:

Overall, how long this current Re-Accumulation Range will last will dictate the remaining acceleration in this cycle and ultimately influence where Bitcoin will finally peak in its Bull Market. 

Bitcoin

The largest cryptocurrency, with a market capitalization of $1.2 billion, is currently trading at $64,400, showing minimal fluctuations compared to Thursday’s price movements. 

Recently, Bitcoin has encountered resistance at the $66,000 level, hindering its ability to consolidate above this threshold. Conversely, the $63,400 level may serve as a support base for the cryptocurrency in the event of heightened downward volatility over the weekend.

Featured image from Shutterstock, chart from TradingView.com

Crypto Analyst Predicts Massive Move For Bitcoin, What’s The Target?

Despite BTC’s recent unimpressive price action, crypto analyst Doctor Profit has shared his bullish sentiment for Bitcoin and the broader crypto market. The analyst further suggested that a parabolic move was imminent and that crypto investors should position themselves accordingly. 

Crypto Market Preparing For A “Third Industrial Revolution”

Doctor Profit mentioned in an X (formerly Twitter) post that the crypto market “is preparing itself for the third Industrial Revolution,” thereby hinting at a trend reversal for Bitcoin and altcoins soon enough. “Be part of it, or regret for [a] lifetime,” the crypto analyst added as he warned crypto investors of missing this market rally.  

Related Reading: HBAR Prices Crashes 35% As BlackRock Denies Any Ties To Hedera

In a previous X post, Doctor Profit gave an idea of what to expect from the crypto market (Bitcoin in particular) when it makes its next leg up. He stated that the flagship crypto will rise to $84,000 after it is done trading the sideway range between $60,000 and $72,000. In another X post, he claimed that the super cycle will start after Bitcoin hits $72,000. 

Meanwhile, Doctor Profit suggested that the price corrections experienced were normal and usually occur in each crypto cycle. He further remarked that the 10 to 20% price fluctuations weren’t big moves. His statement echoes the sentiment of Alex Thorn, Head of Research at Galaxy Digital, who previously warned that bull markets weren’t “straight lines up.”

Bitcoin Is In The Re-Accumulation Period 

In a recent X (formerly Twitter) post, crypto analyst Rekt Capital confirmed that Bitcoin is currently in the Re-Accumulation phase, which occurs after the Bitcoin Halving. He further noted that the goal now “is for Bitcoin to move sideways to catch a breather, for the market to cool off after [a] fantastic Pre-Halving price performance.  

According to Rekt Capital, this Re-Accumulation period can last for multiple weeks “and even up to 150 days.” The analyst revealed that once this period is over, Bitcoin will experience a breakout from this sideways range, followed by a parabolic uptrend

This uptrend phase is said to last for over a year. However, with the probability of this being an accelerated market cycle, Rekt Capital remarked that the duration for this uptrend could be cut in half. Crypto analysts like Tom Dunleavy, Partner and Chief Investment Officer (CIO) at MV Capital, predict that the flagship crypto will rise as high as $100,000 when that time comes. 

At the time of writing, Bitcoin is trading at around $64,360, up in the last 24 hours according to data from CoinMarketCap.

Bitcoin price chart from Tradingview.com

Bitcoin Bearish Signal: Analyst Warns Of Potential Drop To $59,000

Amidst the anticipated positive effect of the recently concluded Bitcoin Halving event, Ali Martinez, a well-known cryptocurrency analyst and trader has issued a noteworthy warning about BTC’s trajectory, predicting that the price of the crypto asset could undergo a correction to the $59,000 mark.

Potential Declines For Bitcoin

Martinez’s analysis delves into the potential for Bitcoin to experience possible dives on the downside in the short term. Considering the BTC’s chart in the 12-hour timeframe, the analyst noted that two signals have manifested signaling potential price declines.

Related Reading: Analyst Points To Possible 30% Bitcoin Correction, Calls For Caution

These include a red candlestick from the TD (Tom Demark) Sequential and a death cross between the 50 and 100 Simple Moving Average (SMA). As a result, Martinez believes that the development could trigger a price drop to $63,300. Additionally, he urged the community to be ready for further dips to around $61,000 and $59,000.

Bitcoin

Martinez previously highlighted that the TD Sequential indicator on the 12-hour chart has flashed a sell signal. This signal came in light of Bitcoin experiencing a mid-level resistance of a parallel channel. Given this, he underscores a cautious approach amidst times like this, given the history of this indication, especially in the event that the digital asset falls below the $65,500 support level.

According to the expert, the trend score for the coin’s accumulation has fallen to zero. Specifically, this suggests that whales are either distributing or not hoarding BTC at the moment.

It seems Martinez’s forecast has taken place as BTC is already trading below the aforementioned support level. Following the price decline, Bitcoin has also seen a notable drop in accumulation.

Over the past few weeks, there has been consolidation in Bitcoin’s price as it has been unable to sustain its surge over its all-time high of $73,000 achieved in March. On Thursday, BTC witnessed a notable drop to around $63,000, which higher inflation and slower growth in the United States were considered to be a catalyst for the drop.

BTC’s Path To $1 Million

Even though there have been some short-term swings with Bitcoin, its long-term trend is still positive. Jack Mallers, the Chief Executive Officer (CEO) of Strike has predicted a long-term growth for BTC to a whopping $1 million.

Mallers shared his perspective on the digital asset’s future trajectory during an interview with David Lin. The financial instability in the bond markets, which significantly involves banks, is the foundation upon which Maller draws his projection.

He asserts that significant liquidity infusions could result from the possible rescue needed to stabilize these markets, driving up the price of assets like Bitcoin. Mallers believes BTC’s value will rise, underlining the limited availability of BTC when paired with rising demand.

At the time of writing, BTC was trading at $64,207, indicating a 0.72% increase in the last 24 hours. Despite the crypto asset showing positive signs, its trading volume is down by over 8% in the past day.

Bitcoin

Spot Bitcoin ETFs Rocked By Outflows, BTC Price Succumbs To Bears

The Spot Bitcoin ETFs have seen their demand drop since the start of this month, and this was again evident in the considerable outflows recorded on April 26. This poor run has had far-reaching effects on the broader crypto market as Bitcoin’s price has succumbed to unfavorable market conditions. 

Spot Bitcoin ETFS Record $217 Million Of Outflows

Farside Investors revealed in an X (formerly Twitter) post that the Spot Bitcoin ETFs recorded $217 million of net outflows on April 25, one of their largest this month. Grayscale’s Bitcoin Trust (GBTC) accounted for most of these outflows, with investors moving $139.4 million out of the fund. 

Related Reading: Why Is The Dogecoin Price Down Today?

Some other funds also recorded individual outflows. Ark Invest’s Spot Bitcoin ETF recorded $31.3 million in outflows, while Valkyrie and Bitwise’s ETFs saw $20 million and $6 million in daily outflows, respectively. Notably, Fidelity’s Wise Origin Bitcoin Fund (FBTC) recorded a net daily outflow for the first time since these funds were approved, with $22.6 being moved out of the fund on Thursday. 

Meanwhile, BlackRock’s dry spell continued with its iShares Bitcoin Trust (IBIT) recording zero inflows for the second consecutive day. Although the fund has yet to record net daily outflows since launching, this undoubtedly represents a setback, considering that it had, before April 24, recorded 71 consecutive days of daily inflows. 

These Spot Bitcoin ETFs’ outflows have led to a wave of sell-offs from the fund issuers to fulfill redemptions. As a result, Bitcoin’s price action has been rather unimpressive as of late, with the flagship crypto experiencing significant price declines due to the heightened selling pressure. This development has put the bears firmly in control, with data from Coinglass showing that more Bitcoin longs than shorts have been liquidated in the last 24 hours. 

Macro Economic Factors Also Affecting Bitcoin’s Price

An initial estimate released by the Bureau of Economic Analysis on April 25 showed that the US Gross Domestic Product (GDP) grew at an annual rate of 1.6% in the first quarter, which was way below expectations. This data report further diminishes hopes of rate cuts this year and looks to have played out in investors’ minds as Bitcoin briefly dropped below $63,000 following the report’s release. 

Meanwhile, the Personal Consumption Expenditures (PCE) inflation data is set to be released on April 26. This PCE report could come in higher than expectations, adding to the growing concerns about the unlikelihood of rate cuts this year.

Interest rates have significant implications on risk assets, including crypto, and if the Federal Reserve decides to take a hawkish stance, it could negatively impact the crypto market. 

Bitcoin price chart from Tradingview.com

Vertex AI Price Forecast: Bitcoin Has 60% Chance Of Hitting $100,000, Key Predictions Unveiled

On-chain analytics firm Spot On Chain’s team of analysts, using Google Cloud’s Vertex artificial intelligence (AI), has conducted an in-depth analysis to forecast the future price of Bitcoin (BTC). 

Their latest report provides valuable insights into the leading cryptocurrency’s short-, medium-, and long-term outlook.

Bitcoin Price Forecasts

According to Spot On Chain’s report, Bitcoin prices are expected to fluctuate between $56,000 and $70,000 during May, June, and July 2024. 

This projected range indicates the potential for market volatility, with a 48% probability assigned to the scenario where BTC prices may dip below $60,000. Moreover, the report advises a cautious approach, acknowledging the possibility of short-term fluctuations or corrections in the price.

Spot On Chain’s analysis reveals a significant movement in the latter half of 2024, with a compelling 63% probability of Bitcoin reaching $100,000. 

This mid-term projection reflects a prevailing bullish sentiment in the market, further fueled by anticipated rate cuts after the Federal Open Market Committee’s (FOMC) December 2023 meeting. 

These rate cuts aim to bring the federal funds rate down to 4.6% and are expected to boost demand for risk-on assets such as stocks and Bitcoin.

Looking ahead to the first half of 2025, Spot On Chain’s modeling indicates a strong probability that Bitcoin will cross the $150,000 threshold. Specifically, a 42% probability is assigned to this scenario, indicating a bullish outlook for Bitcoin’s price trajectory.

What’s more, looking at the entire year of 2025, the probability of Bitcoin exceeding $150,000 rises to an eye-popping 70%. Based on historical data and patterns in previous cycles, Bitcoin reached a new all-time high approximately 6 to 12 months after the Halving event

Price Consolidation On The Horizon?

Crypto analyst Retk Capital has also provided insights into the current Bitcoin price action, shedding light on key resistance levels and the potential for a consolidation phase before an anticipated parabolic upside.

According to Retk Capital’s analysis, Bitcoin has consistently been rejected from the $65,600 resistance level, failing to regain it as a support level. 

This resistance zone has significantly impeded Bitcoin’s upward movement in recent days, as seen on the cryptocurrency’s daily BTC/USD chart below. 

Bitcoin

Retk Capital further highlights that Bitcoin has been witnessing downside wicks into a pool of liquidity at approximately $60,600. This occurrence has been observed over multiple weeks, indicating the presence of buyers in that price range. 

If Bitcoin experiences further downward movement, the analyst believes that there is a possibility that it may approach this area once again. The analyst further notes:

Price dropping without context can be emotionally challenging. However, understanding that this downside is part of the consolation within a technical range-bound structure that will precede Parabolic Upside makes this experience much more comforting.

As of this writing, BTC is trading at $63,900, down nearly 8% over the past two weeks and the same percentage over the past 30 days.

Featured image from Shutterstock, chart from TradingView.com

Bitcoin Price Turns Red And At Risk of More Downsides Below $63K

Bitcoin price failed to recover above the $65,500 resistance. BTC is again moving lower and there is a risk of more downsides below $63,000.

  • Bitcoin started another decline after it failed to surpass the $65,500 resistance zone.
  • The price is trading below $64,500 and the 100 hourly Simple moving average.
  • There is a connecting bearish trend line forming with resistance at $64,500 on the hourly chart of the BTC/USD pair (data feed from Kraken).
  • The pair could accelerate lower if there is a daily close below the $63,000 support zone.

Bitcoin Price Faces Hurdles

Bitcoin price started a recovery wave from the $62,750 support zone. BTC was able to climb above the $64,000 and $64,500 resistance levels. However, the price failed to clear the $65,500 resistance zone.

A high was formed at $65,300 and the price started another decline. There was a move below the $64,500 level. The price tested the 50% Fib retracement level of the recovery wave from the $62,743 swing low to the $65,300 high.

Bitcoin is now trading below $64,500 and the 100 hourly Simple moving average. There is also a connecting bearish trend line forming with resistance at $64,500 on the hourly chart of the BTC/USD pair.

Immediate resistance is near the $64,500 level or the trend line. The first major resistance could be $65,350 or $65,500. A clear move above the $65,500 resistance might send the price higher. The next resistance now sits at $66,200.

Bitcoin Price

Source: BTCUSD on TradingView.com

If there is a clear move above the $66,200 resistance zone, the price could continue to move up. In the stated case, the price could rise toward $67,000. The next major resistance is near the $67,400 zone. Any more gains might send Bitcoin toward the $68,800 resistance zone in the near term.

More Losses In BTC?

If Bitcoin fails to rise above the $64,500 resistance zone, it could continue to move down. Immediate support on the downside is near the $64,000 level.

The first major support is $63,750 or the 61.8% Fib retracement level of the recovery wave from the $62,743 swing low to the $65,300 high. If there is a close below $63,750, the price could start to drop toward $62,750. Any more losses might send the price toward the $61,200 support zone in the near term.

Technical indicators:

Hourly MACD – The MACD is now gaining pace in the bearish zone.

Hourly RSI (Relative Strength Index) – The RSI for BTC/USD is now below the 50 level.

Major Support Levels – $64,000, followed by $63,750.

Major Resistance Levels – $64,500, $65,350, and $66,200.

Bitcoin Bears Risk Losing $7.2 Billion If BTC Price Reaches This Level

The Bitcoin price continues to fluctuate wildly after crashing from its all-time high price above $73,000. This has triggered a wave of bearish sentiment in the market, causing a large number of crypto traders to go short on the pioneer cryptocurrency. As a result, these bears lose, risking a large amount if the Bitcoin price resumes its bullish rally.

Bears Will Lose $7.2 Billion If Bitcoin Reclaims All-Time High

In a post shared on X (formerly Twitter), crypto analyst Ash Crypto revealed an interesting trend concerning Bitcoin that has been developing. The screenshot shared shows that a large number of short trades have been placed on BTC, with the expectation that the price could continue to fall.

Now, so far, these bulls look to be right as Bitcoin has failed to successfully clear $67,000. However, they stand to lose a lot of money if BTC is able to clear this resistance and resume upward. According to Ash Crypto, there is over $7.2 billion worth of BTC shorts which risk liquidation if Bitcoin were to reach a new all-time high price above $74,000.

At the time, the Bitcoin price had recovered above $66,000, spurring a flurry of bearish activity in the market. However, these bears seem to have succeeded, as the BTC price has fallen below $64,000 at the time of writing.

As a result, bears have been emboldened, with the expectation that the Bitcoin price will still from here. So far, the liquidation trends risks have continued to rise as the BTC price falls. Data from Coinglass shows that if Bitcoin were to recover above $44,000 and reach a new all-time high, bears stand to lose over $10 billion.

Bitcoin

BTC Bulls Are Not Giving Up

Even though Bitcoin bears seem to be making bank with the price of Bitcoin falling, the bulls are far from done. Rather, they have been using this price decline as an opportunity to fill up their bags. This accumulation has been even more prominent among Bitcoin whales, who have picked up 1.4% of the total supply in the last month.

On-chain data tracker Santiment reported that in the last four weeks, Bitcoin whales have added 266,000 BTC to their balance. The cohort responsible for this are those holding between 1,000 and 10,000 BTC, making them the mega whales. In total, they spent $17.8 billion on buying BTC in just one month.

As a result of this accumulation, these 1,000-10,000 BTC whales now hold 25.16% of all BTC in existence. Their numbers are also on the rise, with Santiment identifying this as the “Highest crowd bullish bias since all-time high week in early March.”

For now, Bitcoin continues to struggle with the bears to hold the $63,000 support. Its price is down 4.05% in the last day to trade at $63,600, at the time of writing.

Bitcoin price chart from Tradingview.com