The Central Bank of Nigeria issued a directive on Tuesday asking financial institutions to identify persons or entities transacting in or operating Bybit, KuCoin, OKX and Binance, according to contents of the letter seen by CoinDesk.
Bitcoin Brief Bounce Back Above $67,000: Triggers Nearly $300 Million In Total Liquidations
The crypto market has recently experienced a wave of liquidations, amounting to nearly $300 million, closely following Bitcoin’s sharp reclaim of the $67,000 mark.
This surge in Bitcoin’s value, a stark reversal from its previous downtrend, caught many traders off guard, especially those who had placed bets on the continuation of the market’s decline.
Over 80,000 Traders Faces Liquidation
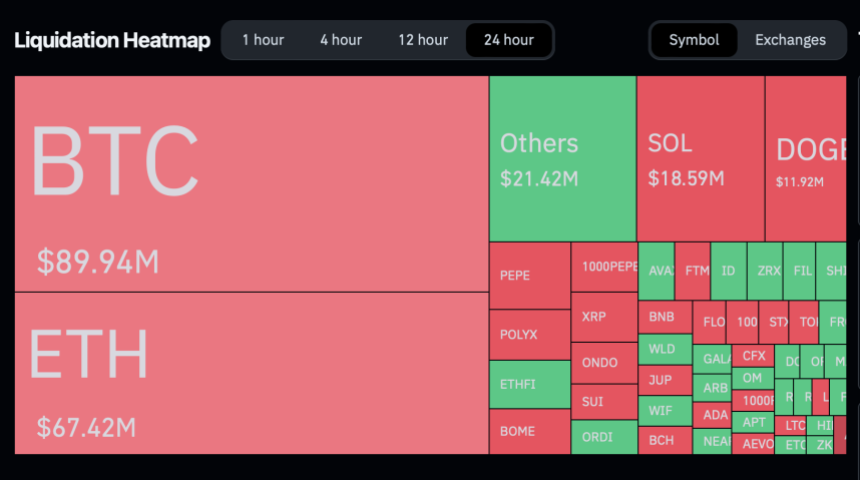
The data provided by Coinglass sheds light on the magnitude of the liquidations, revealing that approximately 86,047 traders suffered losses exceeding $250 million within a mere 24-hour period.
Major exchanges like Binance, OKX, Bybit, and Huobi were the arenas for these significant financial setbacks, with Binance traders bearing the brunt of the liquidations.
Particularly, Binance recorded $128.7 million in liquidations, while other major platforms such as OKX, Bybit, and Huobi also experienced significant liquidations, amounting to $99.87 million, $33.18 million, and $17.70 million, respectively. Meanwhile, despite also facing liquidations, the smaller exchanges had a comparatively minor impact.
Most affected positions were short trades, reflecting a widespread anticipation of a market downturn that did not materialize as expected. Short positions recorded an estimated 57.55% of the liquidations, equivalent to $164.10 million, from traders betting against the market.
On the flip side, long position holders also faced their share of losses, contributing to nearly 40% of the total liquidations, amounting to $121.07 million.
Bitcoin Recovery And Future Prospects
The sharp recovery of Bitcoin, momentarily reclaiming highs above $67,000, has reignited interest in its market behavior and future trajectory.
Despite a 6.6% dip in its market capitalization over the past week, Bitcoin’s value saw a notable 6% increase in the last 24 hours, with its market cap presently sitting above $140 billion. This resurgence in trading activity, with daily volumes climbing from below $60 billion to heights above this mark, signifies renewed investor confidence and heightened trading interest.
Adding to the discourse, cryptocurrency analyst Willy Woo presents an optimistic outlook for Bitcoin, suggesting the possibility of a “double pump” cycle reminiscent of the market patterns observed in 2013.
According to Woo, this pattern could herald two significant price surges for Bitcoin in the coming years, with the first peak anticipated by mid-2024 and a subsequent, more substantial rise in 2025.
While such dual surge scenarios are rare, Woo’s analysis, based on current market conditions and Bitcoin’s growth potential, offers a glimpse into the future of the world’s leading cryptocurrency.
At the rate the #Bitcoin Macro Index is pumping, I wouldn’t be surprised if we get a top by mid-2024, which would hint at a double pump cycle like 2013… a second top in 2025. pic.twitter.com/i2a0V5ytPv
— Willy Woo (@woonomic) March 19, 2024
Featured image from Unsplash, Chart from TradingView
Hong Kong’s Markets Regulator Issues Warning Against Crypto Exchange Bybit
Hong Kong’s markets regulator identified Bybit as a suspicious cryptocurrency exchange and placed several of its products on its suspicious investment products list.
Ether is Now the Largest Institutional Crypto Asset: Bybit Research
Ether is now the largest single asset held by institutions, with Bybit speculating that this may be because of an upward swing from the Dencun upgrade.
Institutional Traders Split Between Bitcoin, Ether: Bybit Research
Numbers from the exchange show institutional traders largely ignored altcoins in favor of perceived “safe” assets.
Coinbase market share grows outside US trading hours amid Binance saga: Report

According to Kaiko Research, Bybit experienced a rise in market share around the clock, whereas Coinbase witnessed significant growth outside of the United States trading hours.
FTX Sues Bybit to Claw Back $953M in ‘Misappropriated Funds’
The FTX estate says the funds were “preferentially” or “fraudulently” transferred to Bybit and affiliates in the lead-up to its November 2022, bankruptcy filing.
Analyst Points Out Weird Bitcoin Activity On Bybit & Deribit Before Flash Surge
An analyst has pointed out how some suspicious Bitcoin buying activity took place on Bybit and Deribit in the leadup to yesterday’s flash surge.
Bitcoin Taker Buy Sell Ratio Saw Extraordinary Spikes On Bybit & Deribit Yesterday
In a new post on X, Julio Moreno, head of research at CryptoQuant, discussed how the BTC taker buy-sell ratio looked like for the different exchanges in the market leading up to the surprise rally yesterday.
The “taker buy sell ratio” here refers to an indicator that keeps track of the ratio between the taker buy and taker sell volumes for Bitcoin on any given exchange (or group of platforms).
When the value of this metric is greater than 1, it means that the taker buy volume is more than the sell volume currently. Such a trend suggests that the investors are willing to pay more to purchase the asset and thus, a bullish sentiment is shared by the majority.
On the other hand, a value under the threshold implies a bearish mentality is active on the exchange as the traders are willing to sell the asset at a lower price at the moment.
Now, here is a chart that shows the trend in the 24-day simple moving average (SMA) Bitcoin taker buy-sell ratio over the past few days for four exchanges: Binance, OKX, Bybit, and Deribit.
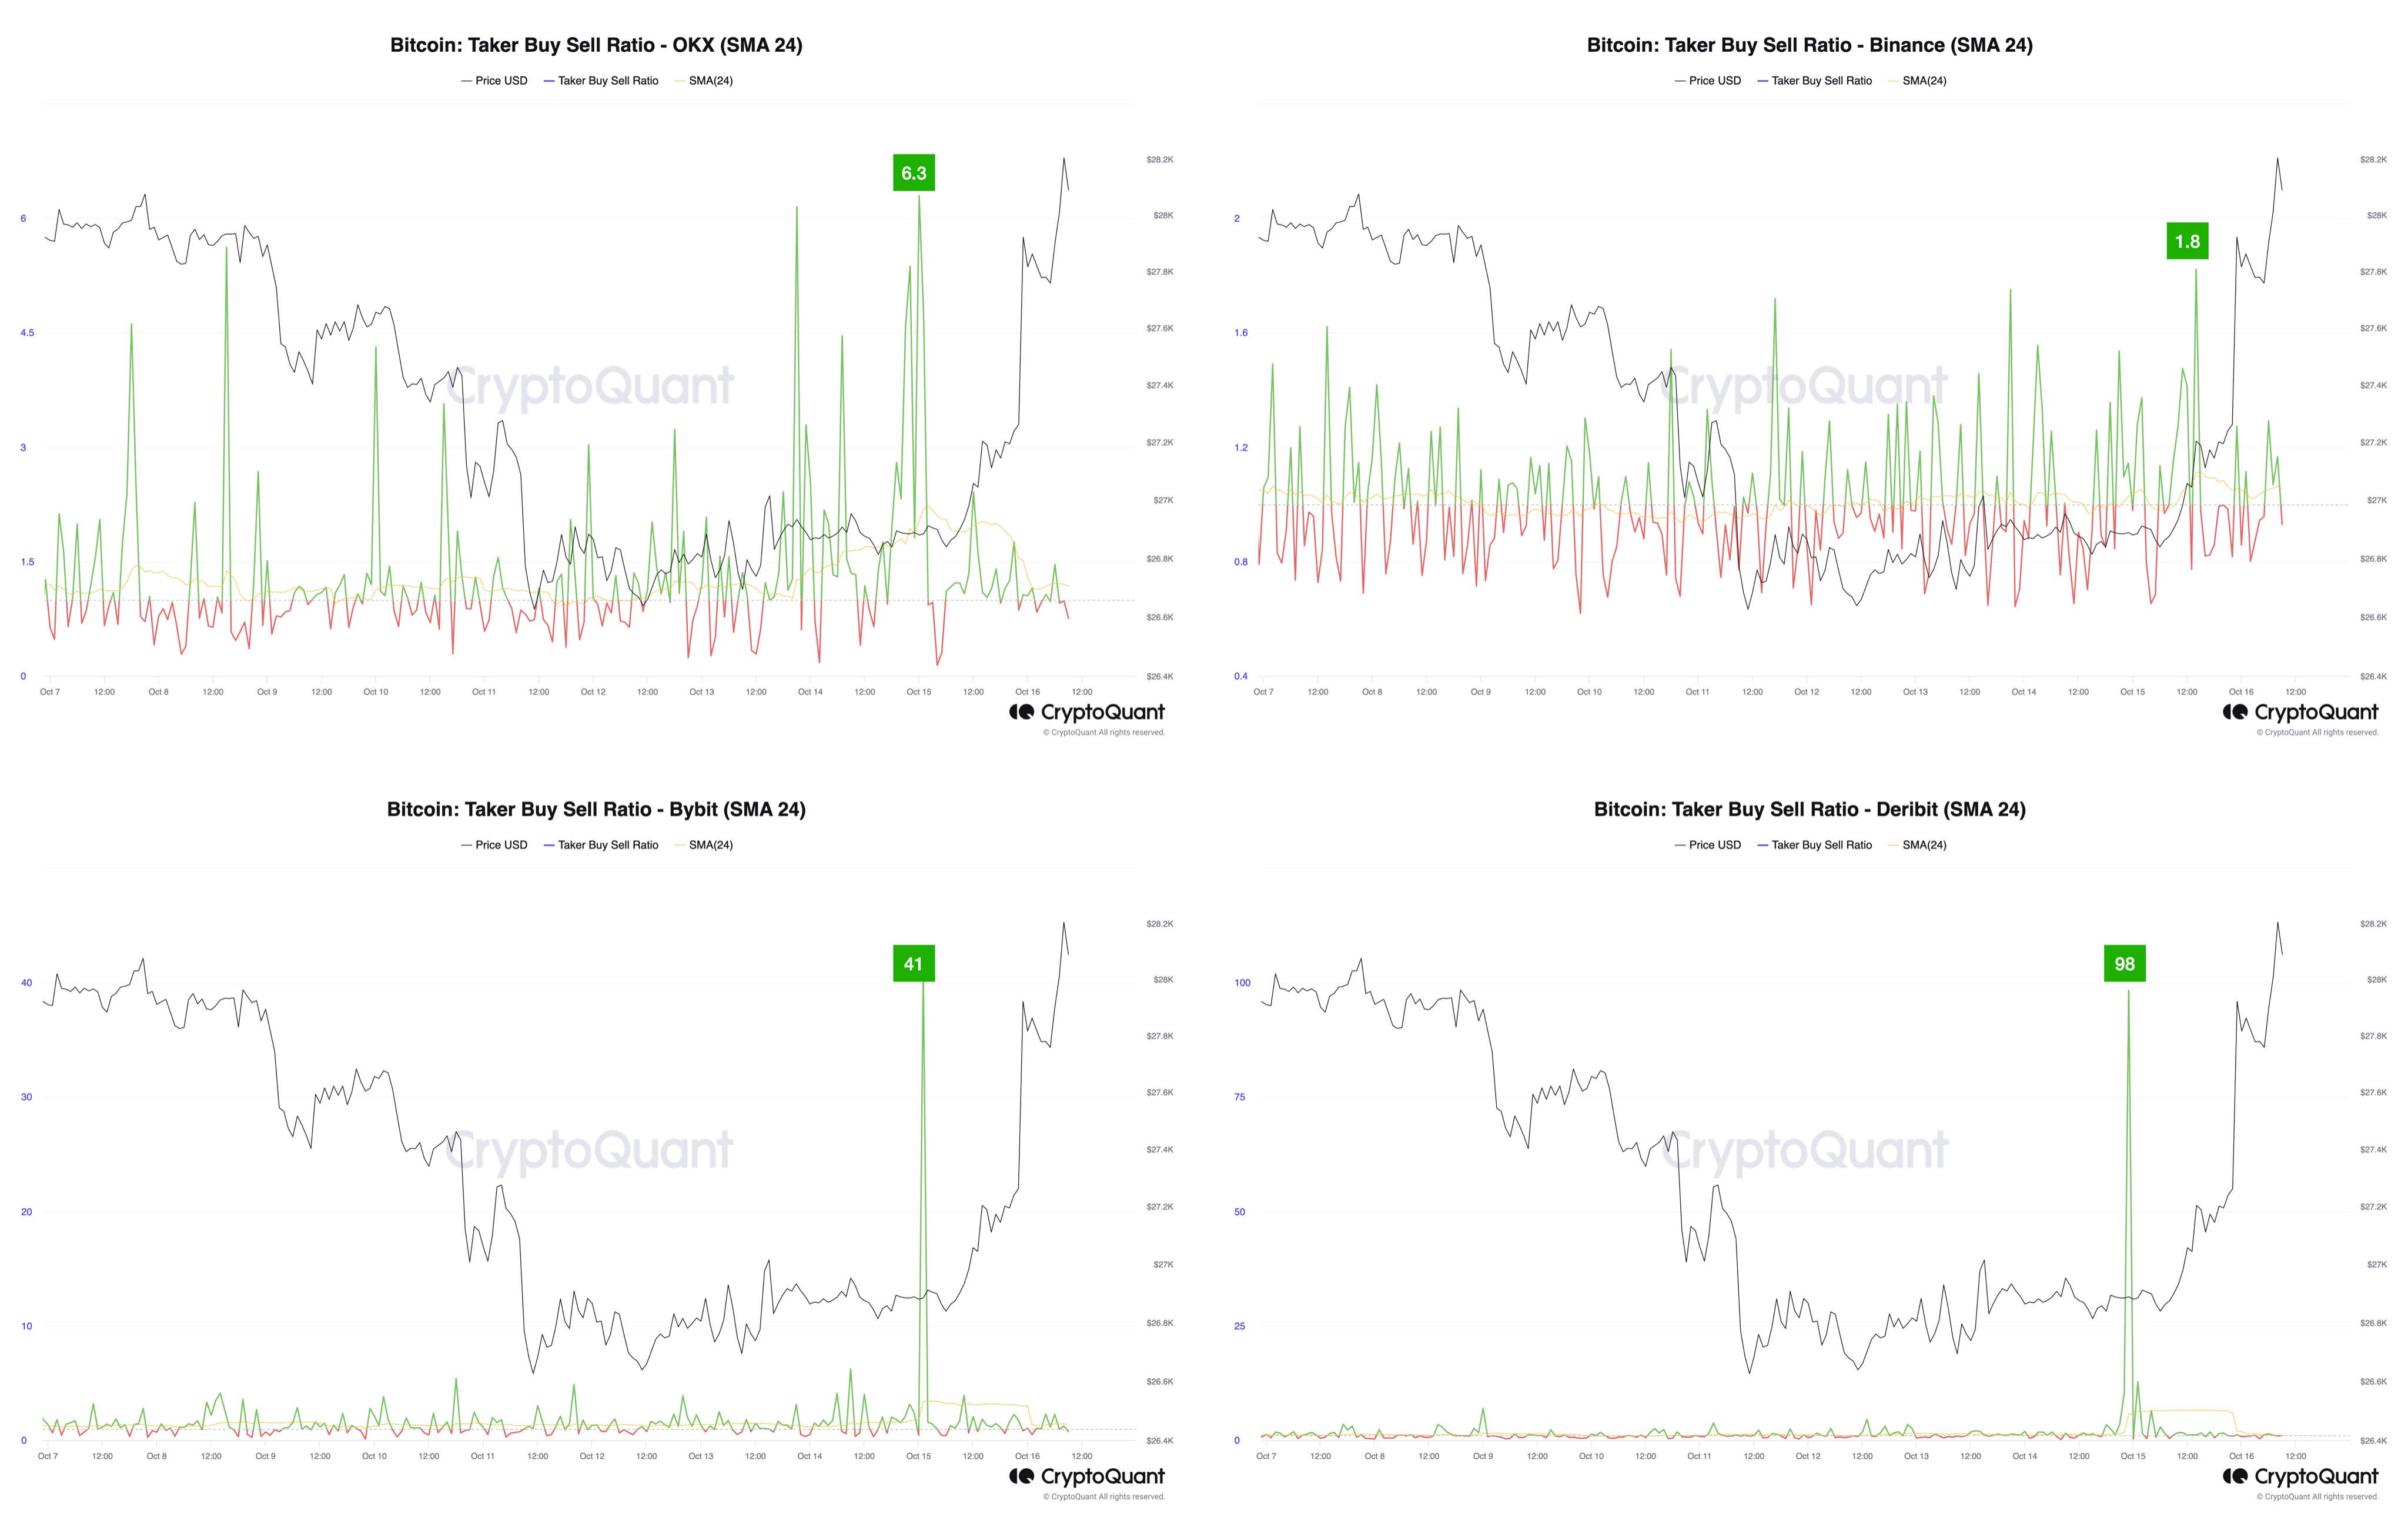
Yesterday, Bitcoin saw a very sharp sudden rally as false news broke out that the iShares BTC spot ETF had been approved by the US SEC. This surge, however, retraced in as spectacular a fashion as it had occurred as the market quickly realized that the rumor was without any substance.
From the chart, it’s visible that all four of these exchanges saw spikes in the taker buy-sell ratio in the hours leading up to this rally. The spikes on Binance and OKX, though, were of pretty normal levels, as spikes of similar scales had occurred in the preceding days as well.
In the case of Bybit and Deribit, however, the 24-day SMA of the ratio had hit peaks of 41 and 98, respectively, which are both extremely high levels. For comparison, the indicator only hit 1.8 on Binance and 6.3 on OKX.
This would suggest that some really high Bitcoin buying volume was observed on Bybit and Deribit, which was unlike what was seen on other exchanges in the sector.
It’s unclear what this pattern means, but it’s possible that some users on these platforms had already been tipped on the fake announcement in advance.
BTC Price
Regardless of the quick rally and crash, Bitcoin has enjoyed some upward momentum during the past couple of days as the cryptocurrency’s value has now climbed toward the $28,500 level.
Why Some Crypto Firms Are Suspending Services in the U.K.
Luno, Bybit and PayPal have recently withdrawn certain services from the U.K. – just ahead of tough new promotions rules for crypto firms coming into effect.
Bybit will suspend services in UK following financial regulator’s ‘final warning’

Headquartered in Dubai, crypto exchange Bybit said it will suspend services to residents of the United Kingdom starting in October due to “regulatory changes.”
Crypto Exchange Bybit ‘Exploring All Options’ to Stay in UK: CEO
Companies like Luno and PayPal have halted certain crypto operations in the country in response to regulations set to take effect next month.
Bybit debuts AI-powered ‘TradeGPT’ for market analysis and data driven Q&A

Cryptocurrency exchange Bybit has released a free AI-powered trading assistant delivering insights from the platform’s market data.
Worldcoin’s Newly-Launched WLD Token Spikes Over 20% on Major Crypto Exchanges
The highly anticipated project co-founded by OpenAI’s Sam Altman launched its token on Monday.
Bybit Gains Crypto License in Cyprus
The Dubai-based crypto exchange will gain now a foothold in the European Union after its exit from Canada and the U.K.
Don’t be mean to CEXs — Crypto relies on them

Centralized crypto exchanges have a crucial role left to play in bridging traditional finance with decentralized cryptocurrencies.
Crypto Exchange Bybit Integrates ChatGPT Into Trading Tools
Traders will be able to analyze market data with the tool.
ByBit plugs into ChatGPT for AI-powered trading tools

ToolsGPT marries ByBit’s market data with ChatGPT’s AI to generate technical analysis, price data and trading metrics.
Crypto exchange Bybit exits Canada, citing ‘recent regulatory development’

Headquartered in Dubai, Bybit plans to leave Canada while exploring expansion into new markets like Kazakhstan.
Crypto Exchange Bybit Exits Canada Citing Recent Regulatory Development
Bybit has announced that it will be exiting the Canadian market starting as soon as May 31 due to recent regulatory developments in the country, adding to several other exchanges that pulled out from the country.
ByBit joins crypto exchanges offering crypto lending services

Dubai-based cryptocurrency exchange ByBit rolls out cryptocurrency lending service, joining a handful of major exchanges that offer interest-bearing lending facilities.


