Ethereum gained bullish momentum above the $1,850 resistance against the US Dollar. ETH price is currently correcting lower from $1,945, but it might find bids near $1,850.
- Ethereum is in a positive zone and it recently climbed above the $1,900 resistance.
- The price is now well above the $1,850 support and the 100 hourly simple moving average.
- There is a short-term contracting triangle forming with support near $1,915 on the hourly chart of ETH/USD (data feed via Kraken).
- The pair could correct lower, but the bulls are likely to remain active above $1,850.
Ethereum Price Extends Gains
Ethereum started a fresh increase after it broke the $1,850 resistance, similar to bitcoin. ETH even surpassed the $1,920 resistance and settled nicely above the 100 hourly simple moving average.
However, the price struggled to continue higher above $1,945 and $1,950. There were two attempts to clear $1,945, but the bulls failed. A high is formed near $1,946 and the price is currently correcting lower. There was a break below the $1,920 support level.
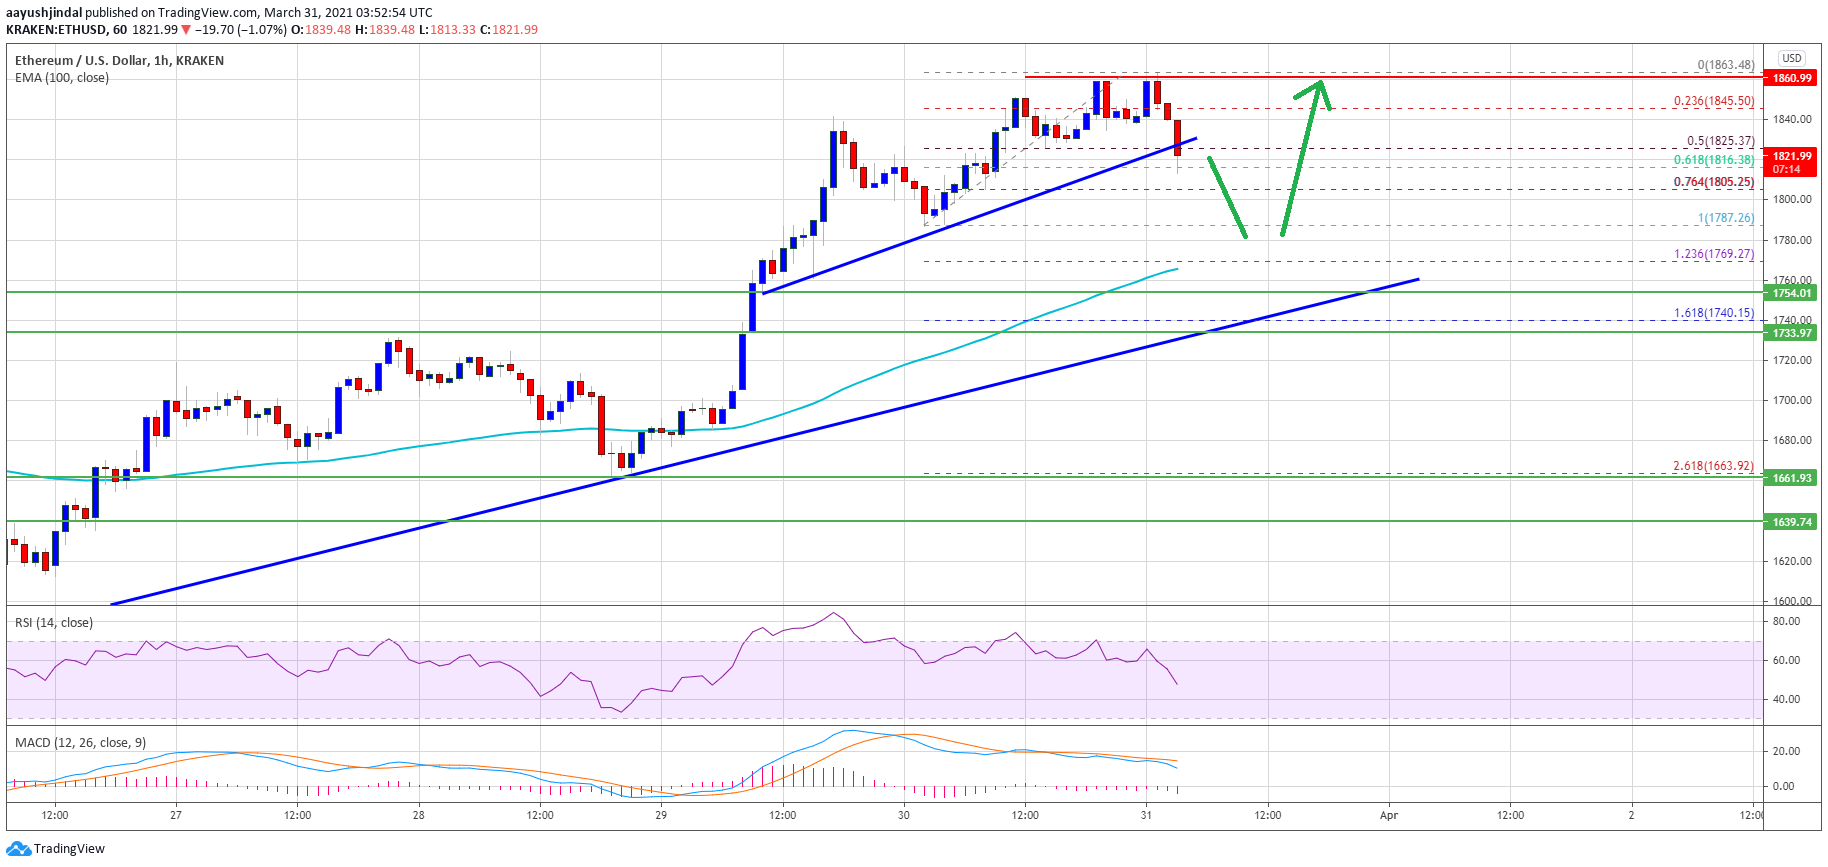
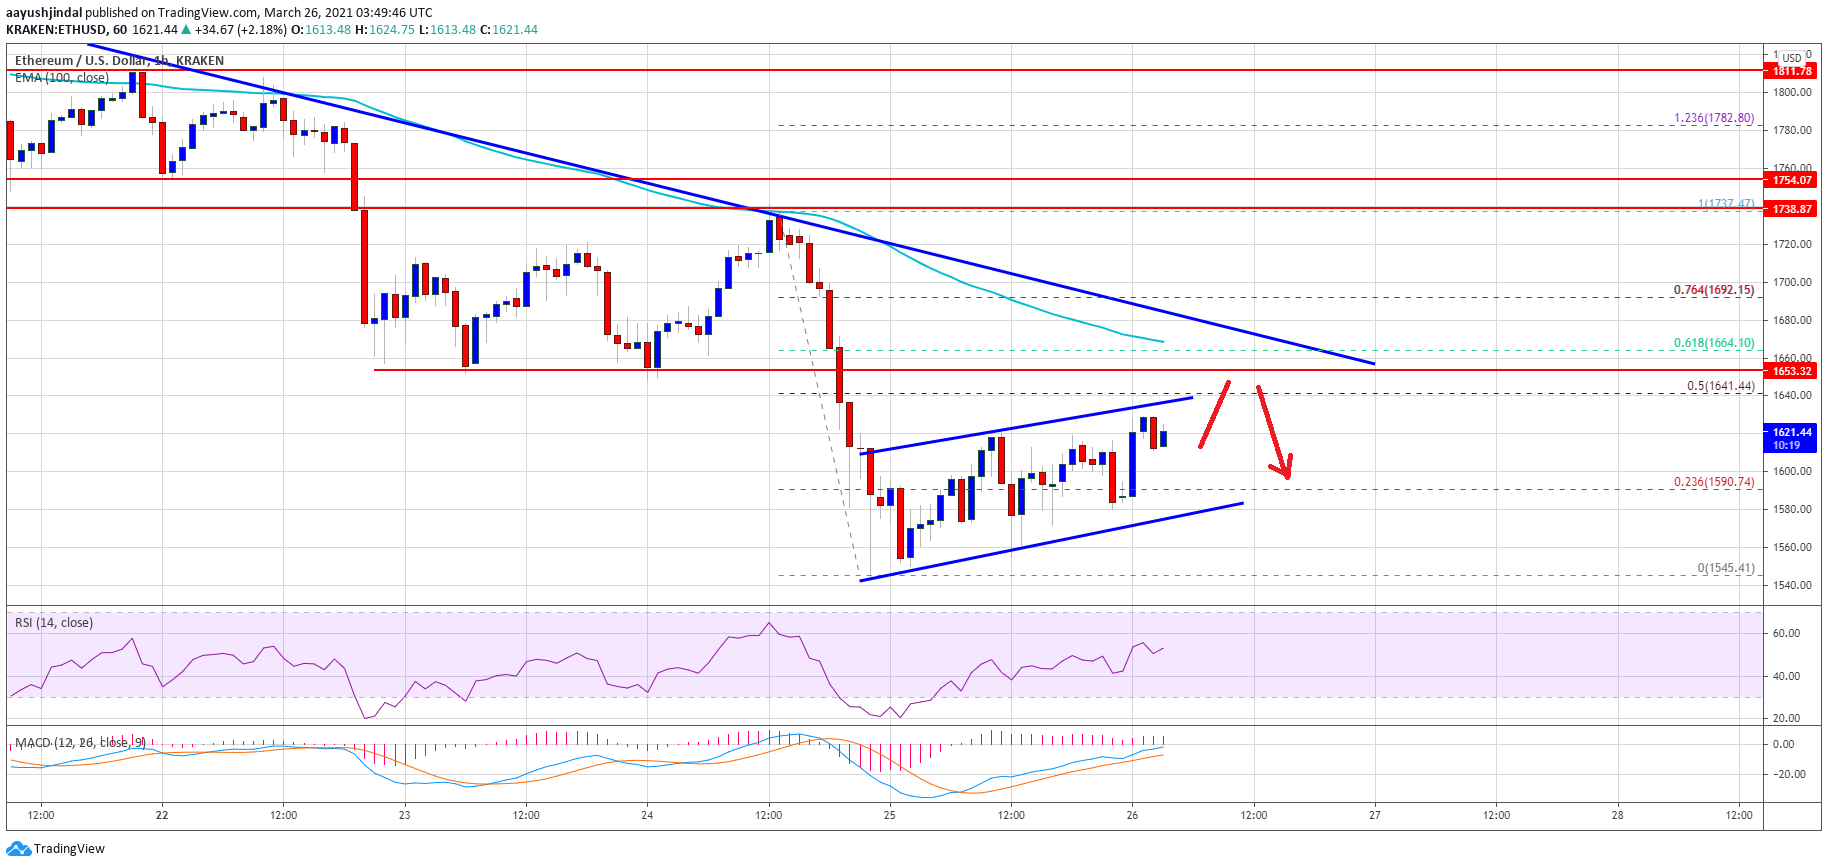
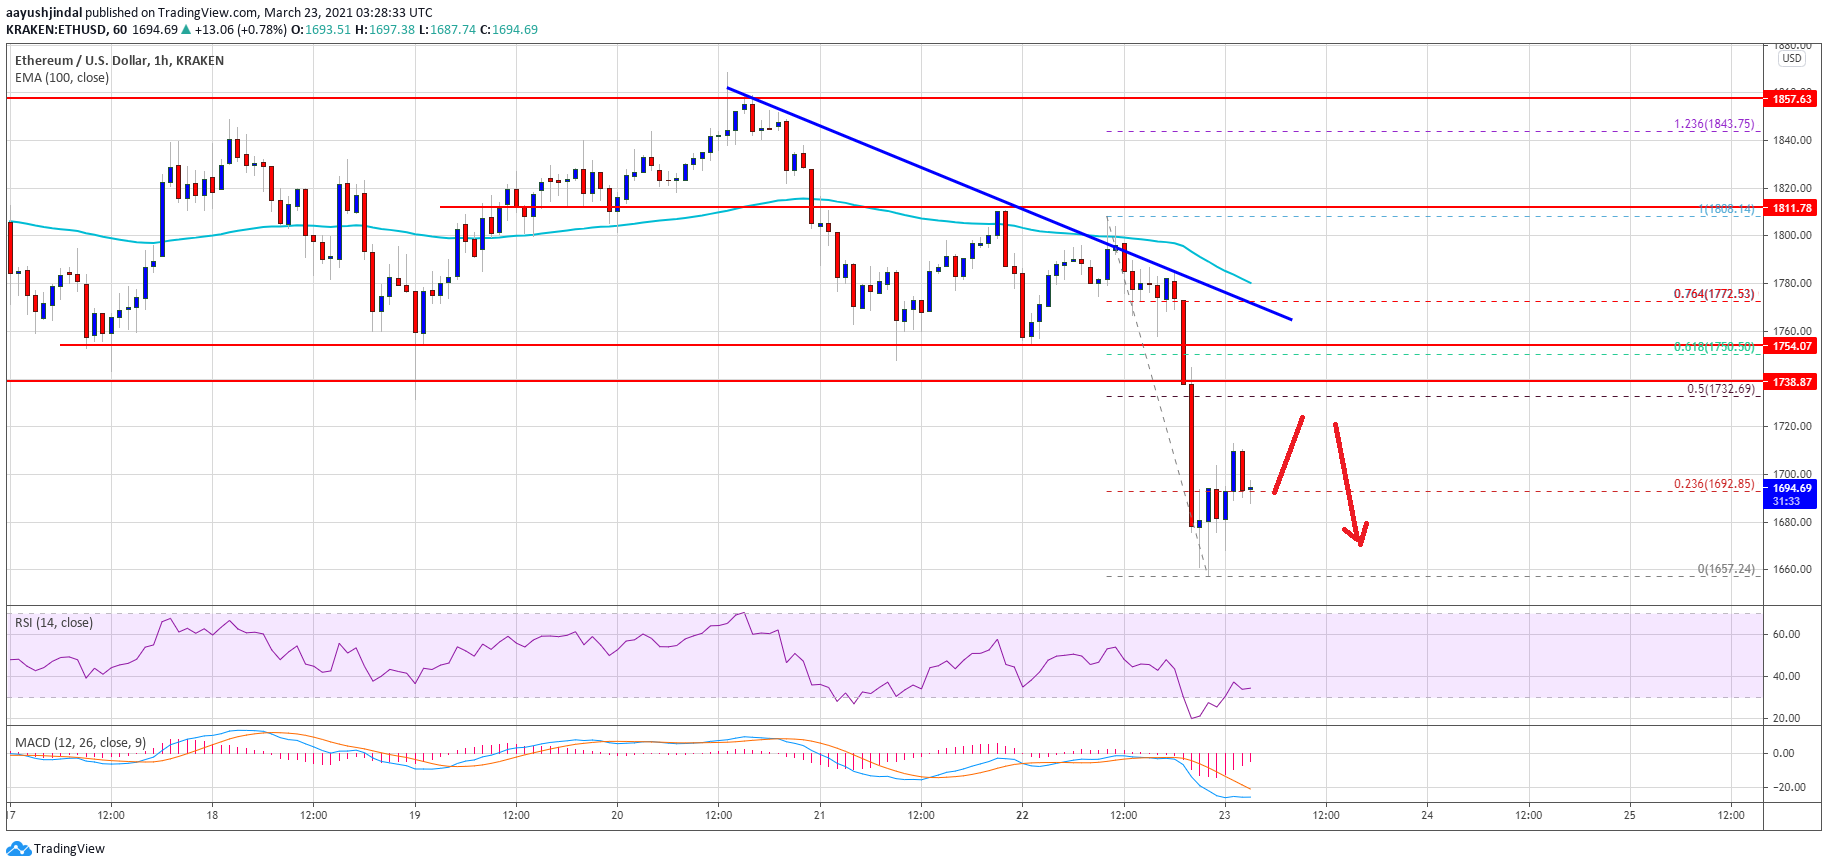
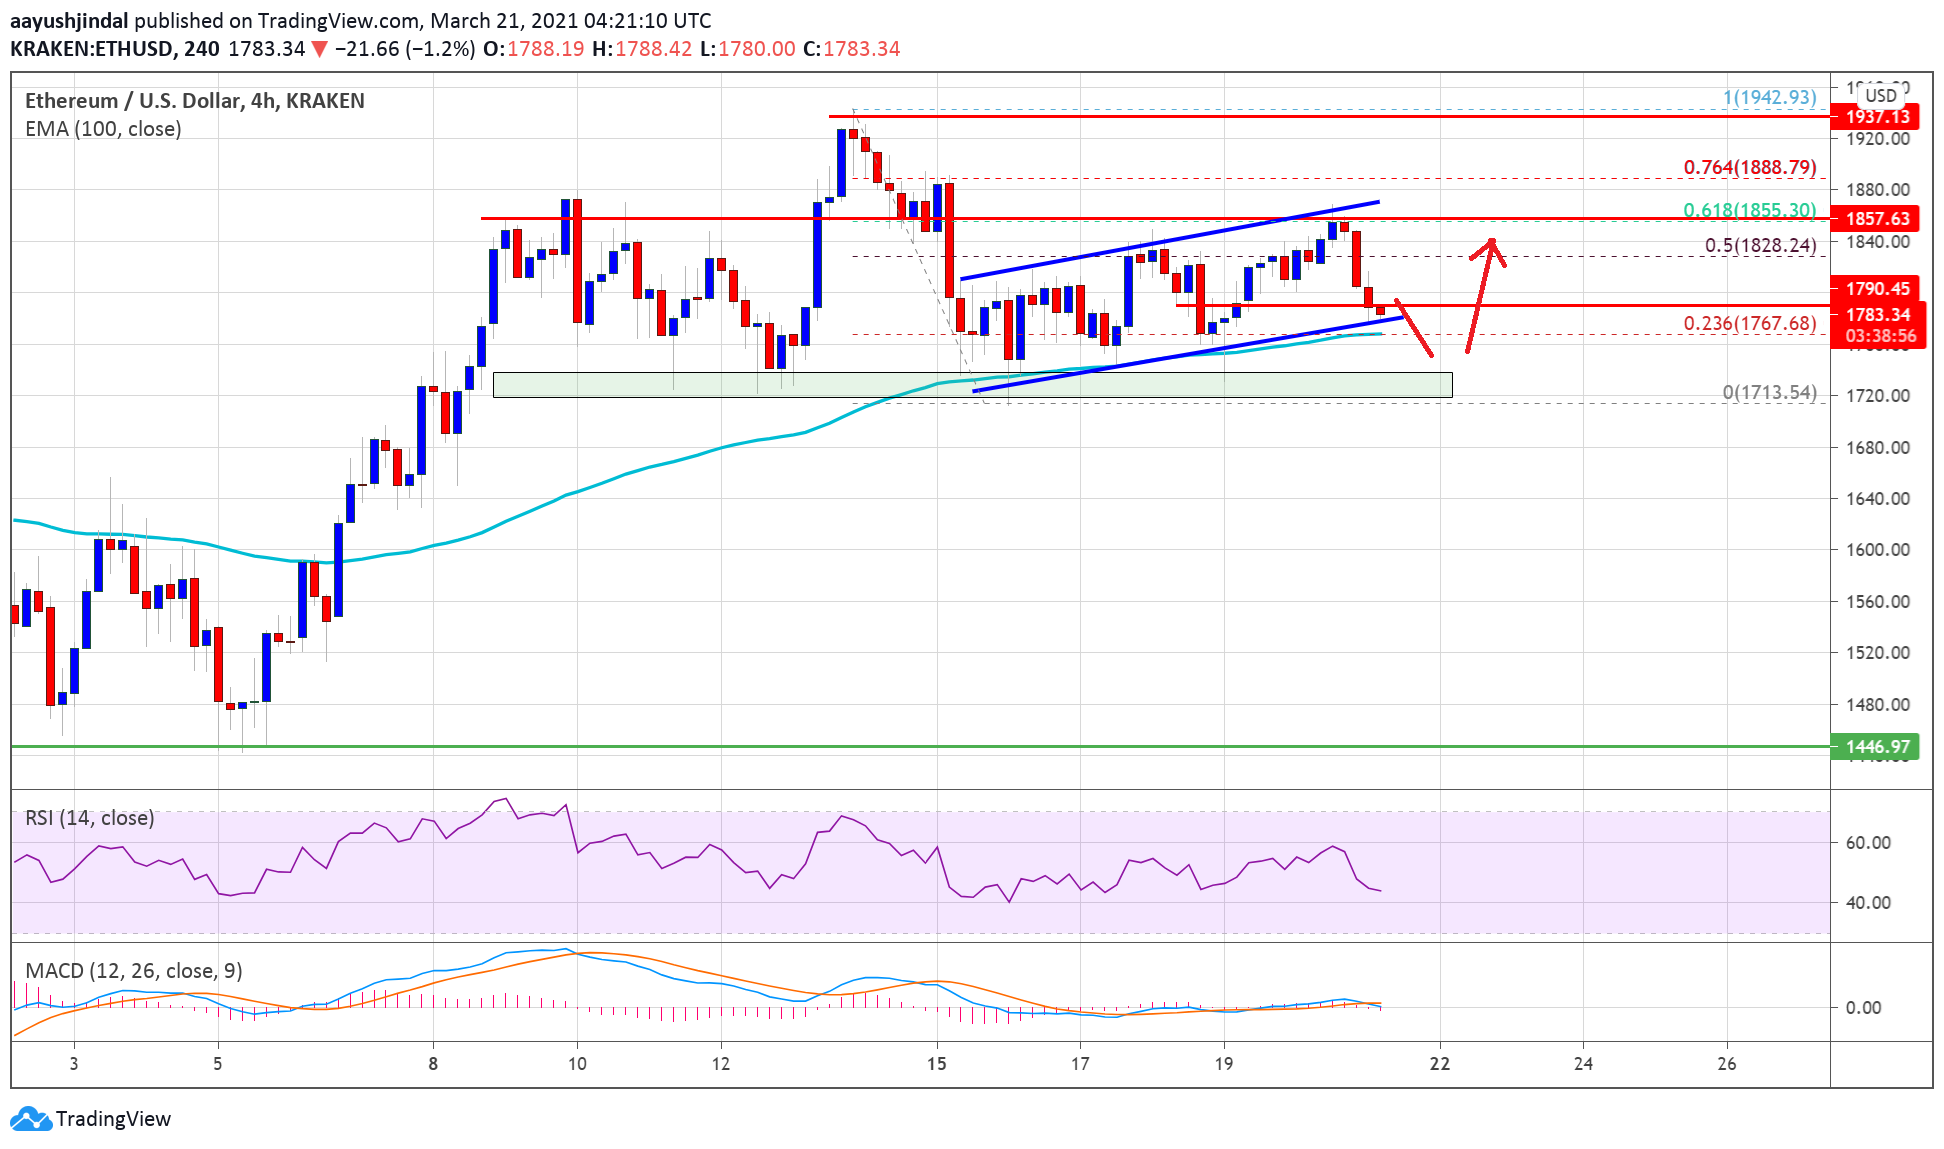
The price is now approaching the $1,915 support. There is also a short-term contracting triangle forming with support near $1,915 on the hourly chart of ETH/USD.
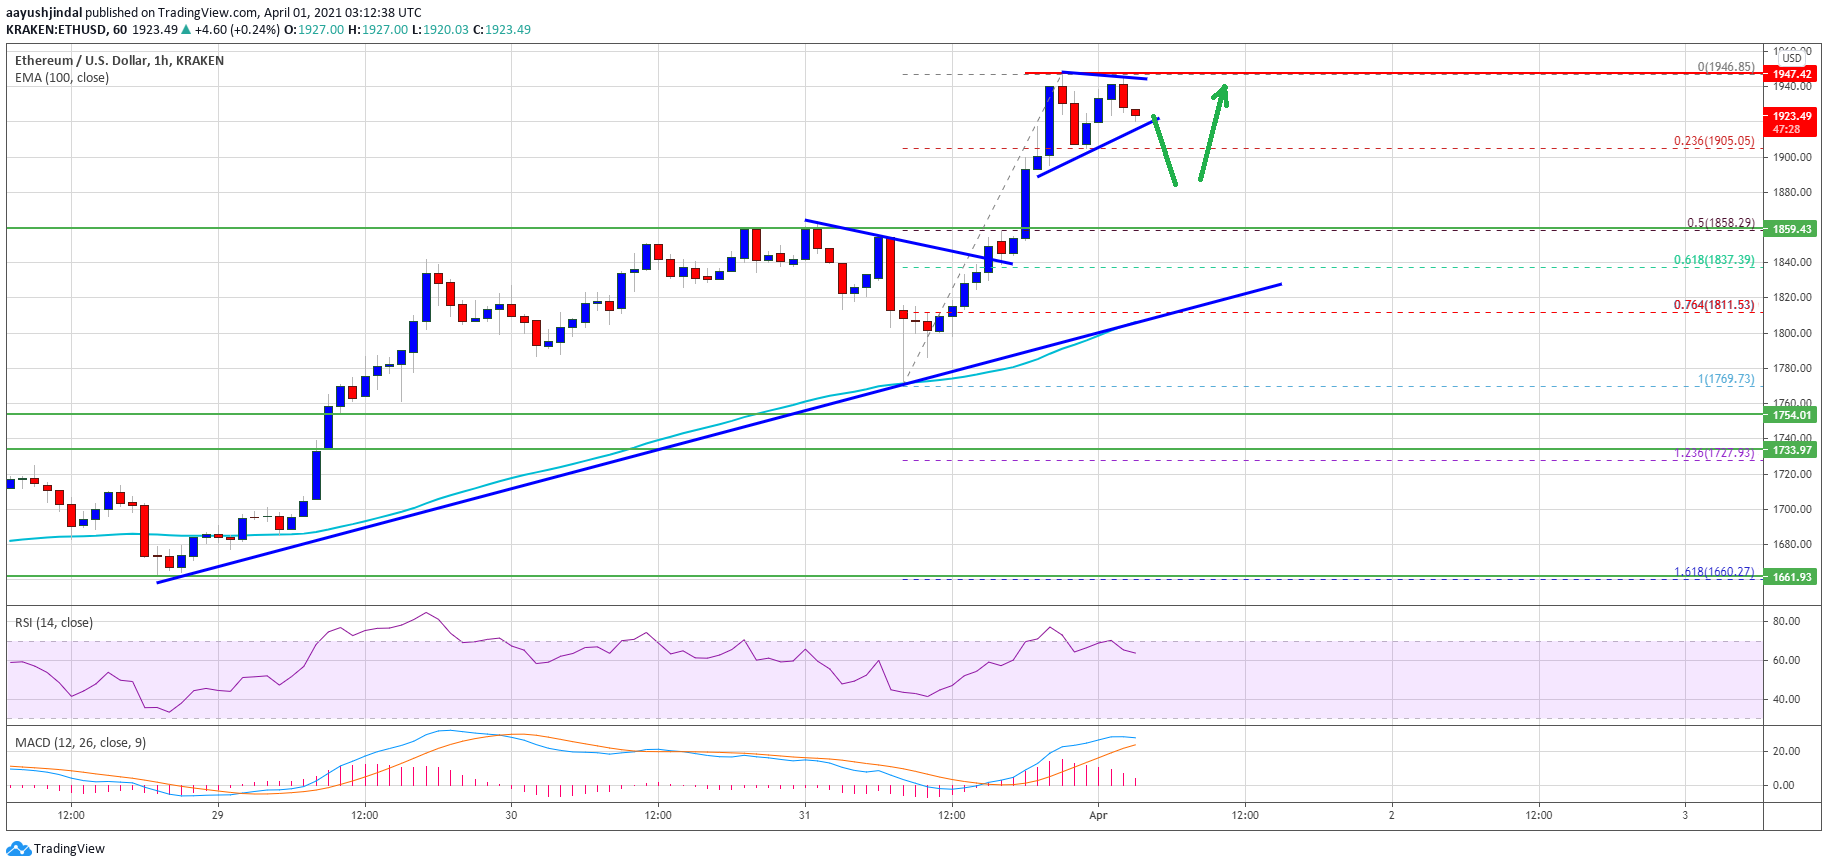
Source: ETHUSD on TradingView.com
If there is a downside break, the price could test the 23.6% Fib retracement level of the recent wave from the $1,769 swing low to $1,946 high. On the upside, the $1,945 and $1,950 levels are immediate hurdles. A clear break above the $1,950 resistance could clear the path for a test of the $2,000 level. Any more gains might call for a move towards the $2,045 level.
Dips Limited in ETH?
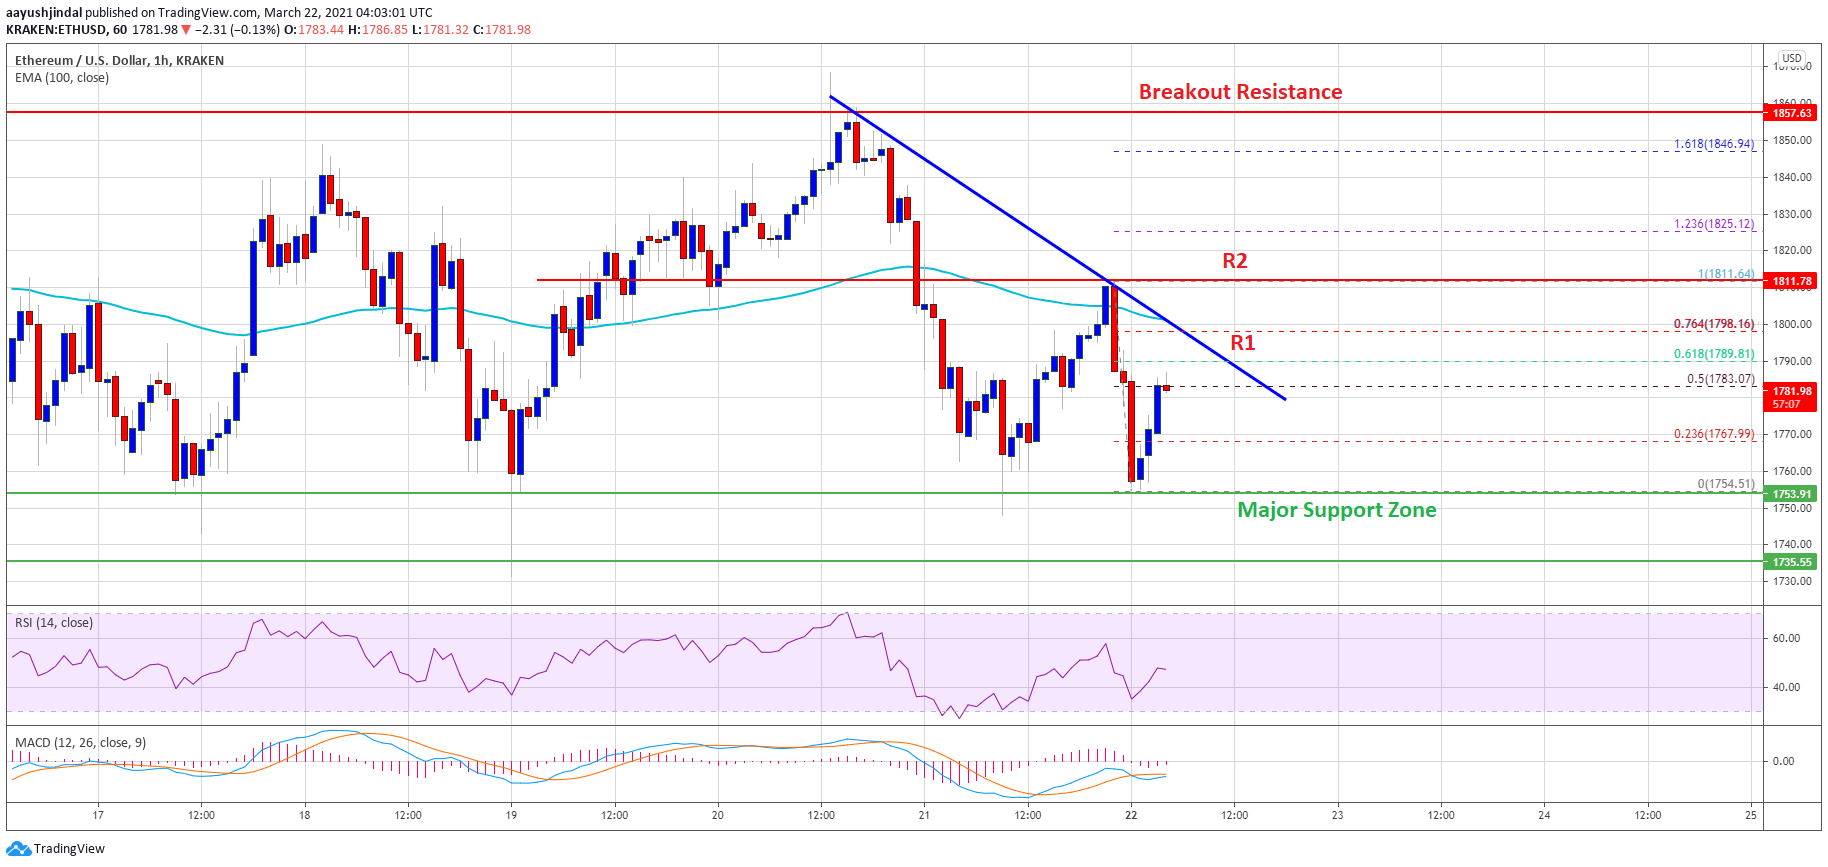
If Ethereum fails to climb above the $1,945 and $1,950 resistance levels, it could correct lower. An initial support on the downside is near the $1,905 level.
The first major support is near the $1,860 level. It is near the 50% Fib retracement level of the recent wave from the $1,769 swing low to $1,946 high. The main support is now forming near the $1,850 level (the recent breakout zone), below which ether price might decline towards the 100 hourly SMA at $1,800.
Technical Indicators
Hourly MACD – The MACD for ETH/USD is slowly losing momentum in the bullish zone.
Hourly RSI – The RSI for ETH/USD is now declining towards the 60 level.
Major Support Level – $1,850
Major Resistance Level – $1,950