Ethereum To See Fresh Move Soon? What Futures Data Says

Data shows the Ethereum Open Interest has been trading at relatively low levels recently. Here’s what this could mean for the asset’s price.

Ethereum Open Interest Has Been Moving Sideways Since Its Plunge

As explained by an analyst in a CryptoQuant Quicktake post, the ETH Open Interest has followed a similar trajectory as the price of the cryptocurrency recently. The “Open Interest” here refers to the total number of derivative-related contracts open for Ethereum on all exchanges.

When the value of this metric goes up, it means that investors are currently opening up new positions on these platforms. Generally, this kind of trend leads to an increase in the market’s total leverage, so the asset price could become more volatile.

On the other hand, a decline in the indicator implies the investors are either closing up their positions of their own volition or getting forcibly liquidated by their platform. Such a drawdown may accompany violent price action, but once the drop is over, the market could become more stable due to the reduced leverage.

Now, here is a chart that shows the trend in the Ethereum Open Interest over the last few months:

Bitcoin Open Interest

As displayed in the above graph, the Ethereum Open Interest registered a sharp drop earlier alongside the asset’s price. The plunge in the metric was naturally caused by the long contract holders being washed out in the price drawdown.

As the price has mostly consolidated sideways since the decline, so has the value of the Open Interest. The quant notes,

This alignment suggests a cooling down of activity within the futures market. Consequently, the market appears poised for the resurgence of either long or short positions, potentially initiating a fresh and decisive market movement in either direction.

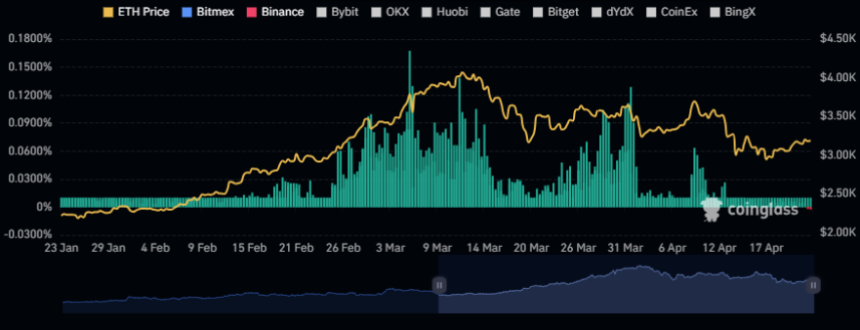
Another indicator related to the derivative market that could be relevant for Ethereum’s future price action is the funding rate. This metric tracks the periodic fees that derivative contract holders are currently paying each other.

Positive funding rates imply that the long holders are paying the shorts a premium to hold onto their positions; hence, that bullish sentiment is dominant. Similarly, negative values suggest that a bearish sentiment is shared by the majority of the derivative traders.

The chart below shows that the Ethereum funding rate has recently turned red.
Ethereum Funding Rates

Historically, the market has been more likely to move against the opinion of the majority, so the fact that the funding rate has flipped negative may be a good sign for the chances of any potential uptrends to start.

ETH Price

Ethereum has gradually increased over the last few days, as its price has now reached $3,200.

Ethereum Price Chart

Ethereum Leaves Bitcoin Behind, But Is This Rally Sustainable?

Ethereum has left Bitcoin in the dust with its latest rally towards $3,100. Here’s whether this run is sustainable based on futures market data.

Ethereum Has Separated From Bitcoin With Over 7% Jump In Past Week

While Bitcoin has been in consolidation lately, Ethereum appears to have been putting together bullish momentum entirely of its own, as the asset has jumped more than 7% in the past week.

The chart below shows how ETH has performed during the last month.

Ethereum Price Chart

In the last 24 hours, Ethereum reached a peak of $3,130 level, a mark it only reached for the first time since the first half of April 2022. Since then, the coin has come down a bit, as it now floats around $3,100.

Nonetheless, despite this small retrace, ETH has still performed notably better than the original cryptocurrency. Now, the asset’s investors might be wondering if the coin could continue this run. Perhaps data related to the futures market might shed some light.

ETH Funding Rates Have Been At Positive Levels Recently

As pointed out by an analyst in a CryptoQuant Quicktake post, the ETH funding rate has had positive values recently. The “funding rate” is an indicator that keeps track of the periodic fees that traders on the futures market are exchanging between each other right now.

When the value of this metric is positive, it means that the long holders are currently paying a premium to the short investors to hold onto their holdings. Such a trend implies the majority sentiment in the futures market is bullish.

On the other hand, the indicator being negative implies a bearish sentiment is dominant in the sector right now as the short holders outweigh the long traders.

Now, here is a chart that shows the trend in the 30-day simple moving average (SMA) of the Ethereum funding rate over the past couple of years:

Ethereum Funding Rates

As the above graph shows, the 30-day SMA Ethereum funding rate had shot up to extremely high levels in the first half of January. Interestingly, this is when the market top due to the Bitcoin spot ETFs occurred.

After the price drawdown following the event, the funding rate calmed as the longs that had piled up saw liquidation. As the recent rally in the coin has occurred, the funding rate has once again gone up.

However, This time, the 30-day SMA Ethereum funding rate isn’t quite at the extreme levels it was last month. This could mean that the futures market isn’t yet too overheated.

Naturally, this could potentially allow for the current Ethereum rally to go on for a while still. It should be noted, though, that as the funding rates go higher, the chances of a long squeeze taking place go up.

Thus, while ETH may not be quite at the same risk as last month, a long squeeze could still be on the horizon, becoming more probable to happen as the speculators continue to open up more positions.

Ethereum Breaks $2,900, But Watch Out For Futures Overheating

Ethereum has broken beyond the $2,900 level during the past day, but data shows the futures market may be starting to become overheated.

Ethereum Has Now Broken Through The $2,900 Level

While Bitcoin has slumped to an overall sideways trajectory recently, Ethereum appears to have decided to pick a path of its own, as the second largest asset in the sector has surged almost 4% over the past 24 hours.

During this latest jump, Ethereum has touched the $2,900 mark for the first time since the start of May 2022. The below chart shows how the coin has performed over the last few days.

Ethereum Price Chart

Following this rise, Ethereum investors would now be enjoying profits of more than 16% over the past week. In the same period, Bitcoin has only put together returns of about 8%.

While ETH’s decoupling may be an optimistic sign for the asset, a pattern seems to be emerging that could prove to be a worrying sign.

ETH Open Interest Has Observed A Sharp Increase Recently

As explained by an analyst in a CryptoQuant Quicktake post, the ETH Open Interest has gone through a strong surge recently. The “Open Interest” is an indicator that keeps track of the total amount of Bitcoin futures contracts that are currently open on all centralized derivative exchanges.

When the value of this metric rises, it means that the investors are opening up fresh positions on the futures market right now. Generally, total leverage in the sector goes up as more positions pop up, so this trend can result in a higher amount of volatility for the cryptocurrency.

On the other hand, a decline in the indicator implies ETH futures contract holders are either closing up their positions of their own volition, or are being liquidated by their platform. The asset’s price may behave more stably following such a decrease.

Now, here is a chart that shows the trend in the Ethereum Open Interest over the last few years:

quicktake-image

From the graph, it’s visible that the Ethereum Open Interest has risen to high levels recently and has attained a peak that’s higher than any witnessed in almost two years.

“This surge indicates sustained confidence among futures traders in Ethereum’s current uptrend,” notes the quant. “However, given the impulsive nature of the recent ascent, traders should exercise caution and consider the potential for sudden liquidation events, which could trigger notable short to mid-term price declines.”

As mentioned before, the asset becomes more likely to show volatility when this indicator rises. The source of this volatility can be mass liquidation events called squeezes, which can trigger a violent cascade effect on the futures market, amplifying the price swing that triggered the event.

Since the Ethereum Open Interest is very high right now, a futures squeeze could definitely be a possibility for the cryptocurrency.

Ethereum Futures Market Cool Off Sets Stage For ETH To Rally: Quant

An analyst has explained that the latest cooldown in the Ethereum futures market could suggest there is potential for a price rise to resume for ETH.

Ethereum Funding Rates Have Seen A Decline Recently

An analyst in a CryptoQuant Quicktake post explained that the ETH funding rates have seen a cooldown from their previously overheated levels. The “funding rate” refers to the periodic fees that futures contract holders on derivative platforms currently exchange with each other.

When the value of this metric is positive, it means that the long contract holders are paying a premium to the shorts to hold onto their positions. Such a trend implies that most traders share a bullish sentiment right now.

On the other hand, the under zero indicates that a bearish sentiment is currently dominant in the futures market, as the short traders are overwhelming the longs.

Now, here is a chart that shows the trend in the Ethereum funding rates over the last few months:

Ethereum Funding Rates

As displayed in the above graph, the Ethereum funding rates have been mostly positive during the last few months, implying that traders on the futures side of the market have mostly been bullish about the asset.

The few times that the metric did dip into the negative inside this period didn’t turn out to be anything major, as the indicator only attained low red values and rebounded back inside the green territory without too much wait.

The chart shows that during some phases of this lasting period of bullish sentiment, the metric attained particularly high values. “However, it’s crucial to note that elevated values in funding rates raise concerns about a potential overheated state in the perpetual markets, signaling the possibility of an impending long-squeeze event,” notes the quant.

A “squeeze” is an event in which a sharp swing in the price triggers a large number of liquidations, which in turn feed into this price move, elongating it and causing further liquidations.

When such a cascade of liquidations affects the long side of the market (that is, the price move in question is a rapid drawdown), the event is known as a “long squeeze.”

Generally, the side of the futures market most heavily dominated by traders is likelier to fall prey to a squeeze. Thus, when the funding rates are highly positive, a long squeeze can be more probable.

Recently, though, as Ethereum has gone through its latest correction, so have the funding rates. Although they are still positive, their magnitude may no longer be associated with an overheated market, and the risk of a long squeeze would have thus fallen.

“Consequently, there exists the potential for the price to resume its upward trajectory following the completion of the ongoing correction stage,” explains the analyst.

ETH Price

Ethereum has declined by around 5% during the past week as its price has now fallen under $2,400.

Ethereum Price Chart

Ethereum Funding Rates Turn Deep Red, What Does It Mean?

Data shows the Ethereum funding rates have been quite negative in recent days. Here’s what this could mean for the cryptocurrency’s price.

Ethereum Funding Rates Have Been Under The Zero Mark Recently

As explained by an analyst in a CryptoQuant post, a short squeeze may be a possibility for the asset currently. The “funding rate” is an indicator that keeps track of the periodic fees that traders on the futures market are exchanging with each other.

When the value of this metric is positive, it means that the long contract holders are paying a premium to the short holders right now. Such a trend implies the longs outweigh the shorts currently, and hence, a bullish mentality is the dominant force in the sector.

On the other hand, negative values suggest the majority of the futures market users share a bearish sentiment at the moment as the shorts are the ones paying a fee.

Now, here is a chart that shows the trend in the Ethereum funding rates over the past week:

Ethereum Funding Rates

As displayed in the above graph, the Ethereum funding rates had been positive until just a couple of days back, implying that the majority of the futures traders had been betting on the asset’s price to go up.

The metric’s value has plunged to the negative zone during the past day or so, however, suggesting that a complete flip in mentality has occurred among the investors.

This bearish sentiment, though, may not necessarily be bad for the price. This is because the more the mentality has become skewed in one direction historically, the more probable the price of the cryptocurrency has become to show a sharp move in the opposite direction.

One major reason why this happens is that mass liquidation events, which are popularly called “squeezes,” are more likely to involve the dominant side of the futures market.

During a squeeze, a sudden swing in the price ends up liquidating a large amount of contracts at once. Such liquidations only provide fuel for the price move that caused them, thus amplifying it further. This can lead to a cascade of more liquidations.

As shorts have piled up in the Ethereum futures market recently, the probability of a short squeeze occurring would be elevated. Naturally, if such an event does take place, the asset’s value could see a sharp rebound.

This doesn’t necessarily have to happen, of course, and if it does, it may not be soon. From the chart, it’s visible that the funding rate had remained at notable positive values for a while before the ETH price finally registered its plunge.

ETH Price

Ethereum has taken a hit of more than 3% during the past week as the asset’s price is now trading under the $1,600 level.

Ethereum Price Chart

Ethereum Leverage Ratio Is Rising, What Does It Mean?

Data shows the Ethereum leverage ratio has been going up recently, something that may lead to higher volatility for the asset’s price.

Ethereum Estimated Leverage Ratio Has Risen To 23% Now

As explained by an analyst in a CryptoQuant Quicktake post, the Ethereum leverage ratio is pointing at increased risk in the market. The “estimated leverage ratio” (ELR) refers to the ratio between the Ethereum open interest and derivative exchange reserve.

The former of these, the “open interest,” keeps track of the total amount of positions that are currently open in the ETH futures market, while the latter metric, the derivative exchange reserve, simply measures the number of tokens sitting in the wallets of all centralized derivative exchanges.

The ELR basically tells us about how much leverage the average user on the futures market is currently opting for. When this indicator has a high value, it means that the open interest has a significant value compared to the exchange reserve, and so, the average contract is going for a high amount of leverage.

On the other hand, low values imply that the futures market users aren’t willing to take risks at the moment as they haven’t taken any significant amount of leverage.

Now, here is a chart that shows the trend in the Ethereum ELR over the last few years:

Ethereum ELR

Historically, whenever the ELR has gone up, the price of the cryptocurrency has become more likely to show volatility. This is due to the fact that a higher amount of leverage means that the average contract becomes more likely to get liquidated.

A large amount of liquidations happening at once can lead to chaos in the market, and since this is more likely to happen when the ELR is high, the price can naturally have a greater chance of turning volatile.

As displayed in the above graph, the Ethereum ELR had risen to some high values in August. As it usually plays out, this overleveraged market condition resulted in sharp price action for the asset, which, in this case, occurred in the form of a steep crash from the $1,800 level to the $1,600 level.

The ELR quickly cooled down to relatively low values with the crash, as the positions with the most leverage were weeded out. For a while, the metric moved sideways at these lows, but recently, the indicator has once again started to rise.

At present, the metric has a value of 23%, which isn’t as high as the pre-August crash value, but is still notable nonetheless. Huobi, Derbit, and OKX appear to have a disproportionate amount of leverage as compared to the wider sector, as the ELR for the platforms is currently 88%, 73%, and 43%, respectively.

“When ELR increases, volatility tends to follow the same path,” notes the quant. “In this sense, Ethereum may be heading towards a period of increased turbulence.”

ETH Price

Ethereum had declined towards $1,500 at the start of the week but has since made recovery back above the $1,600 mark.

Ethereum Price Chart

Ethereum Open Interest Nears All-Time Highs Ahead Of Merge

Data shows the Ethereum open interest has surged up to near all-time high values as the ETH 2.0 merge comes closer.

Ethereum Open Interest Has Sharply Risen Up Recently

As per the latest weekly report from Arcane Research, the ETH open interest in futures and perps has surged up to 4.2 million ETH in recent days.

The “open interest” is an indicator that measures the total amount of Ethereum futures and perps contracts currently open in the market (denominated in ETH). The metric includes both shorts and longs.

When the value of this indicator is high, it means a large number of contracts are currently open in the market. Such values usually lead to higher volatility in the price of the crypto.

On the other hand, low values of the metric suggest many contracts have been closed on the market. This can result in lesser volatility for the coin.

Now, here is a chart that shows the trend in the Ethereum futures and perps open interest over the past year:

The value of the metric seems to have moved up recently | Source: Arcane Research’s The Weekly Update – Week 31, 2022

As you can see in the above graph, the Ethereum open interest has observed uptrend in the past week and is now near the all-time high value.

The current value is the 2nd highest ever recorded for the indicator, just below the 4.21 million ATH set back on July 14th of this year.

While the massive hedging amid arbitrage opportunities like Celsius’ bankruptcy was behind the last peak, the report notes that the current rise is likely caused by trading strategies ahead of the 2.0 merge.

The ETH futures market is also observing massive discounts at the moment. Normally, high open interest and negative basis like right now lend for the possibility of a short squeeze (an event where short liquidations cascade together due to a sudden swing in price).

But Arcane Research points out that the latest increase in leverage is likely from more conservative risk management, which would mean that any possible short squeeze that might take place currently won’t be too significant.

ETH Price

At the time of writing, Ethereum’s price floats around $1.7k, down 1% in the past week. Over the last month, the crypto has gained 40% in value.

The below chart shows the trend in the price of the coin over the past five days.

Looks like the value of the crypto has come down during the last two days | Source: ETHUSD on TradingView
Featured image from Kanchanara on Unsplash.com, charts from TradingView.com, Arcane Research


Ethereum Investors Close 300k Long Positions on Bitfinex, Rally To Stop Soon?

Data shows around 300k in ETHUSD long positions have been closed on the Bitfinex Ethereum futures market, something that could provide impedance to the latest rally.

Ethereum Long Positions Have Dropped By More Than 300k During The Last Few Days On Bitfinex

As pointed out by an analyst in a CryptoQuant post, the past data of the ETHUSD long positions on the crypto exchange Bitfinex would suggest the current pattern may prove to be bearish for the value of the coin.

The relevant metric here is the total number of Ethereum long positions (ETHUSD pair) currently open on the Bitfinex exchange.

When the value of the indicator is high, it means a bullish sentiment is more dominant among investors on the platform right now.

On the other hand, low values could suggest whales on the exchange currently don’t believe the coin’s price is going to go up soon.

Now, here is a chart that shows the trend in the ETHUSD long positions on Bitfinex during the past year:

The value of the metric seems to have sharply declined in recent days | Source: CryptoQuant

As you can see in the above graph, the quant from the post has marked the relevant points of trend for the ETHUSD Bitfinex longs during the period.

It looks like whenever Ethereum long positions on the platform have observed a plunge down, so has the value of the crypto.

This trend has taken place either immediately after the drawdown on the indicator, or some days following the fact.

The longest gap between the price plunge and the metric’s decline in the past year was back in March, where the crypto continued to rally for 18 days before forming the local top.

In the past week, the Ethereum longs on Bitfinex have once again seen a sharp downwards move, amounting to around 300k such positions being closed.

So far, the coin has continued to keep going up for around 6 days now. If the past pattern is anything to go by, then the current trend may mean ETH could observe a local top forming in the next 12 days.

ETHUSD

At the time of writing, Ethereum’s price floats around $1.7k, up 8% in the last seven days. Over the past month, the crypto has gained 40% in value.

The below chart shows the trend in the price of the coin over the last five days.

Looks like the price of the coin has been mostly trending sideways during the last few days | Source: ETHUSD on TradingView
Featured image from Kanchanara on Unsplash.com, charts from TradingView.com, CryptoQuant.com

JPMorgan Analysts Say That Big Money Are Dumping Bitcoin For Ethereum

Ethereum has recently made its way into the radar of institutional investors. More big money has been flowing into the digital asset in recent months following the success of decentralized finance (DeFi). With this much money coming in from institutional investors, the value of ETH has seen significant growth in the past couple of months. Data shows that institutional investors are getting into Ethereum as early as possible, eliminating the possibility of “missing the bus” when the cryptocurrency eventually becomes an important part of traditional finance markets.

Ethereum being more valuable than top cryptocurrency bitcoin is a hotly debated topic in the crypto space. Despite being the most valuable, JPMorgan analysts have put forward that institutional investors are moving away from bitcoin and taking more positions in ETH. As crashes have rocked the market, the value of bitcoin has taken numerous hits. And with these have come a relaxation of the highly confident price predictions made for the asset.

Related Reading | September Leaves Behind Trail Of Blood, Bitcoin Long Liquidations

Institutional Investors Turn Away From Bitcoin Futures

Restrictions on the purchase of actual cryptocurrencies have left institutional investors trading on crypto futures. Bitcoin futures have seen much interest from the big investors who do not have to invest directly in cryptocurrencies. But recent data shows that these big-time investors are beginning to exit from Bitcoin futures in favor of investing in Ethereum futures.


ETH recovers above $3,000 | Source: ETHUSD on TradingView.com

JPMorgan analysts released a note that contained their findings for the cryptocurrency market. According to the analysts, the decreased interest in bitcoin futures did not spell good news for the digital asset. Explaining further, the analysts said, “This is a setback for bitcoin and a reflection of weak demand by institutional investors that tend to use regulated CME futures contracts toga exposure to bitcoin.”

Bitcoin futures have consistently traded below the actual market price of the cryptocurrency on the Chicago Mercantile Exchange, as institutional investors pull out and begin to stake on Ethereum.

Ethereum Currently Overvalued

Last week, a JPMorgan analyst had pointed out that at its current price, Ethereum is currently overvalued. The analyst put the digital asset’s value at $1,500, about 55% less than its current trading range. But it seems that despite this low fair valuation, ETH is still beating out top coin bitcoin for big money coming into the market. Ethereum has also held up better in the face of recent market crashes.

Related Reading | Billionaire Mike Novogratz Says He’s “Not Nervous” About Crypto Sell-Off

While bitcoin futures prices have dropped below the asset’s trading price, Ethereum futures have risen relative to the asset’s market price. Reports show that between the months of August and September, the price of Ethereum futures has risen 1% over the actual price of Ethereum. “This points to much healthier demand for Ethereum versus Bitcoin by institutional investors,” said the analysts.

Featured image from The Cryptonomist, chart from TradingView.com