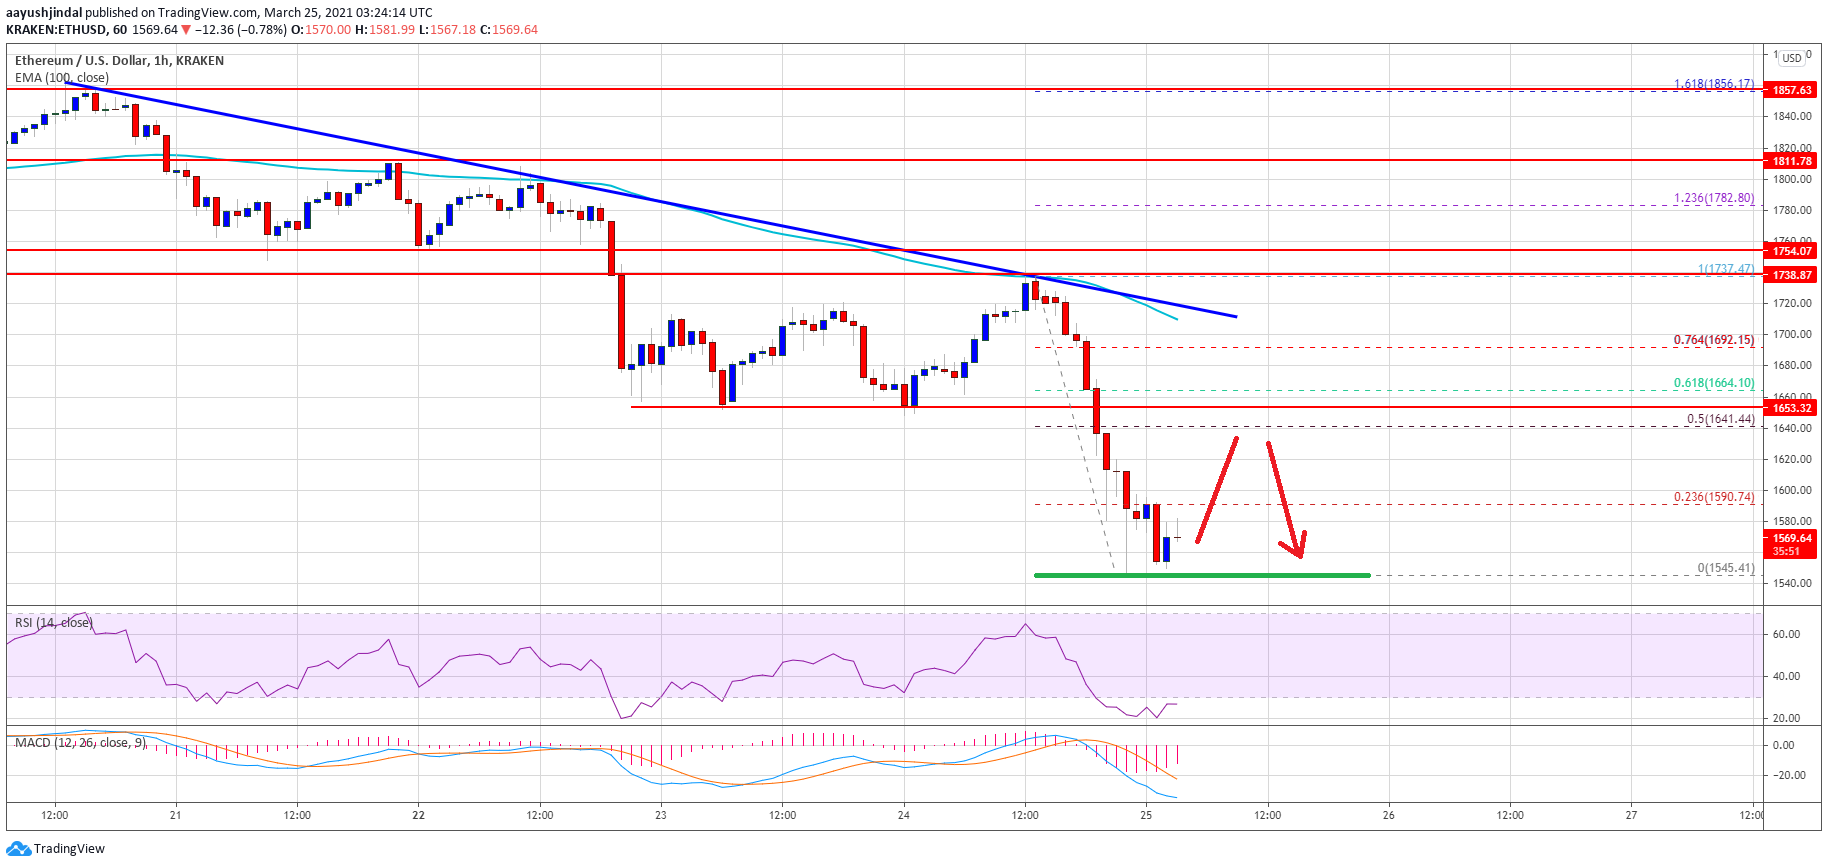
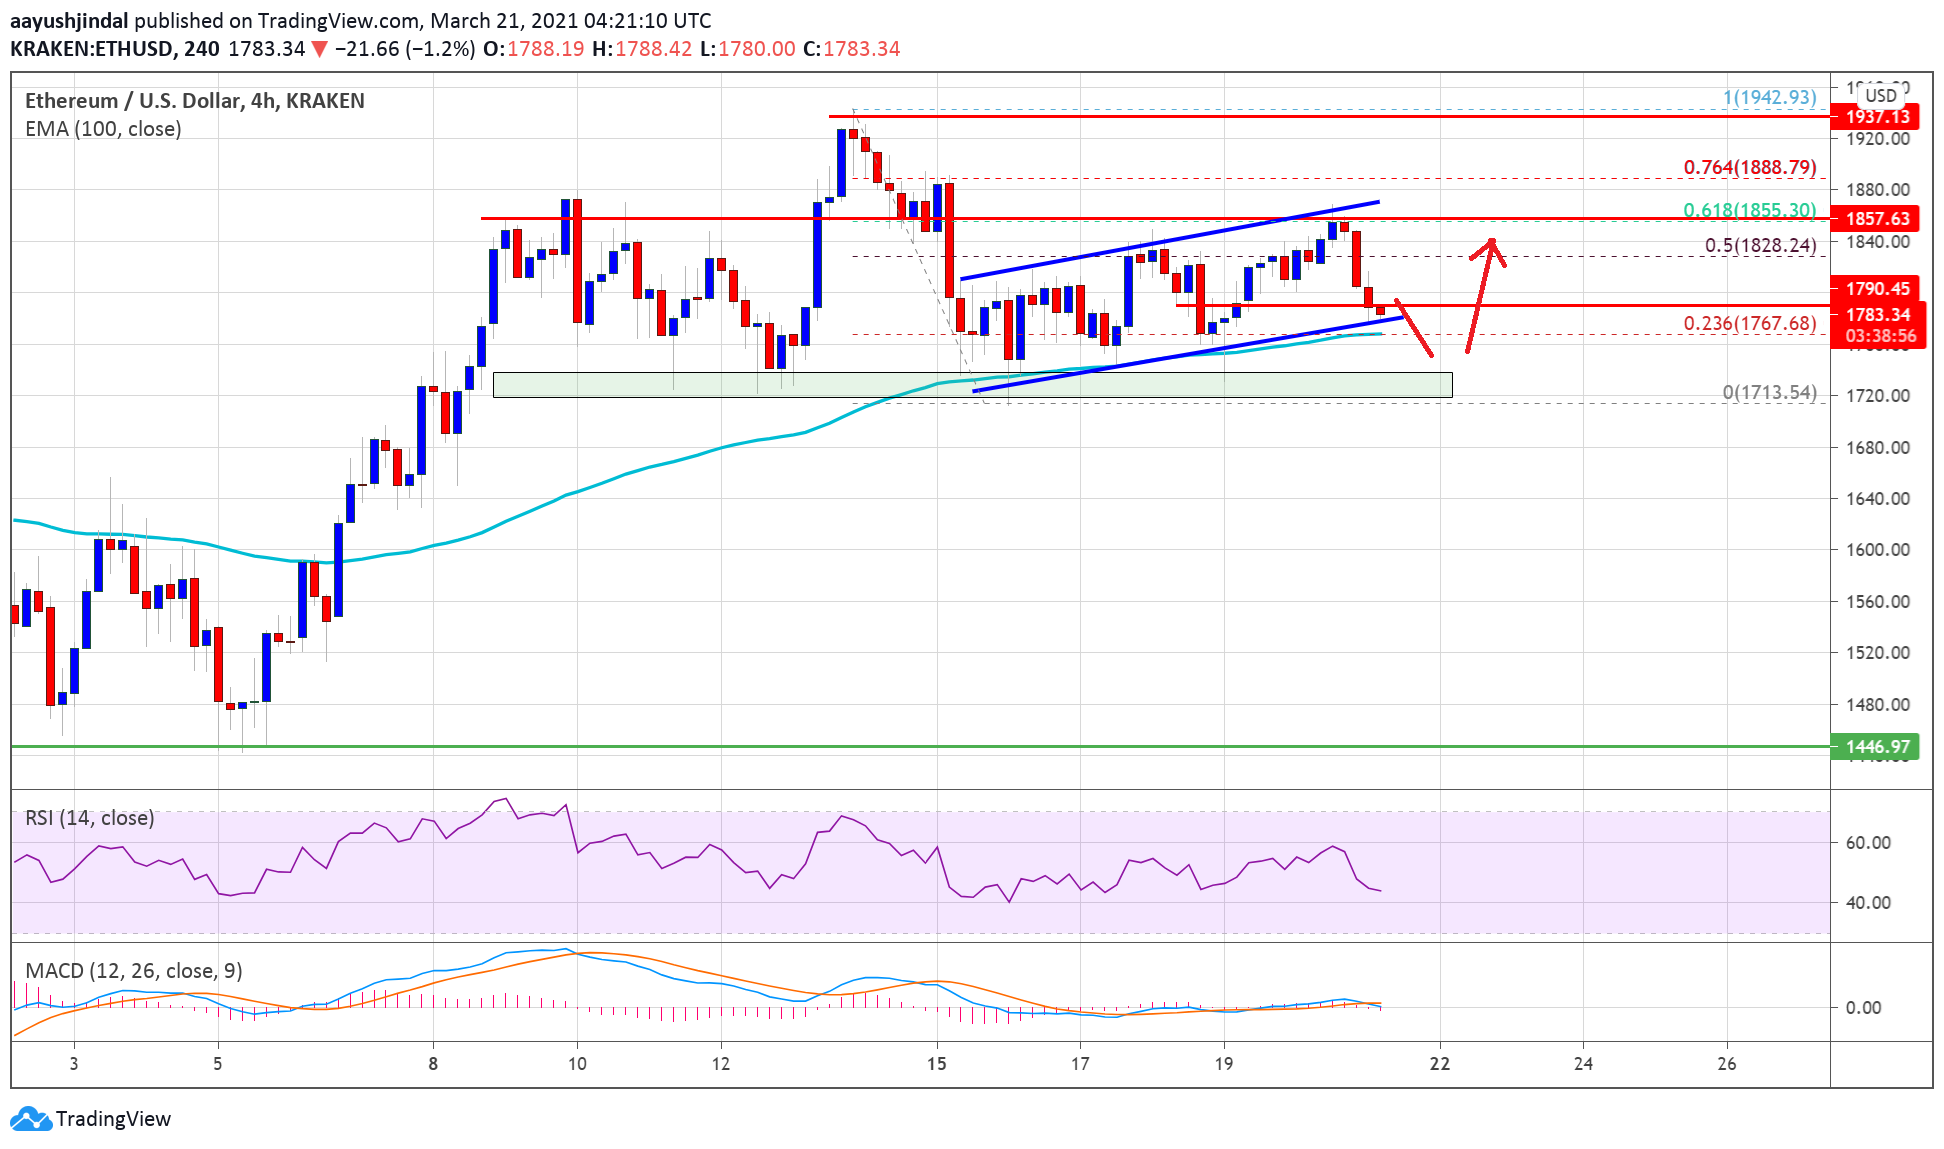
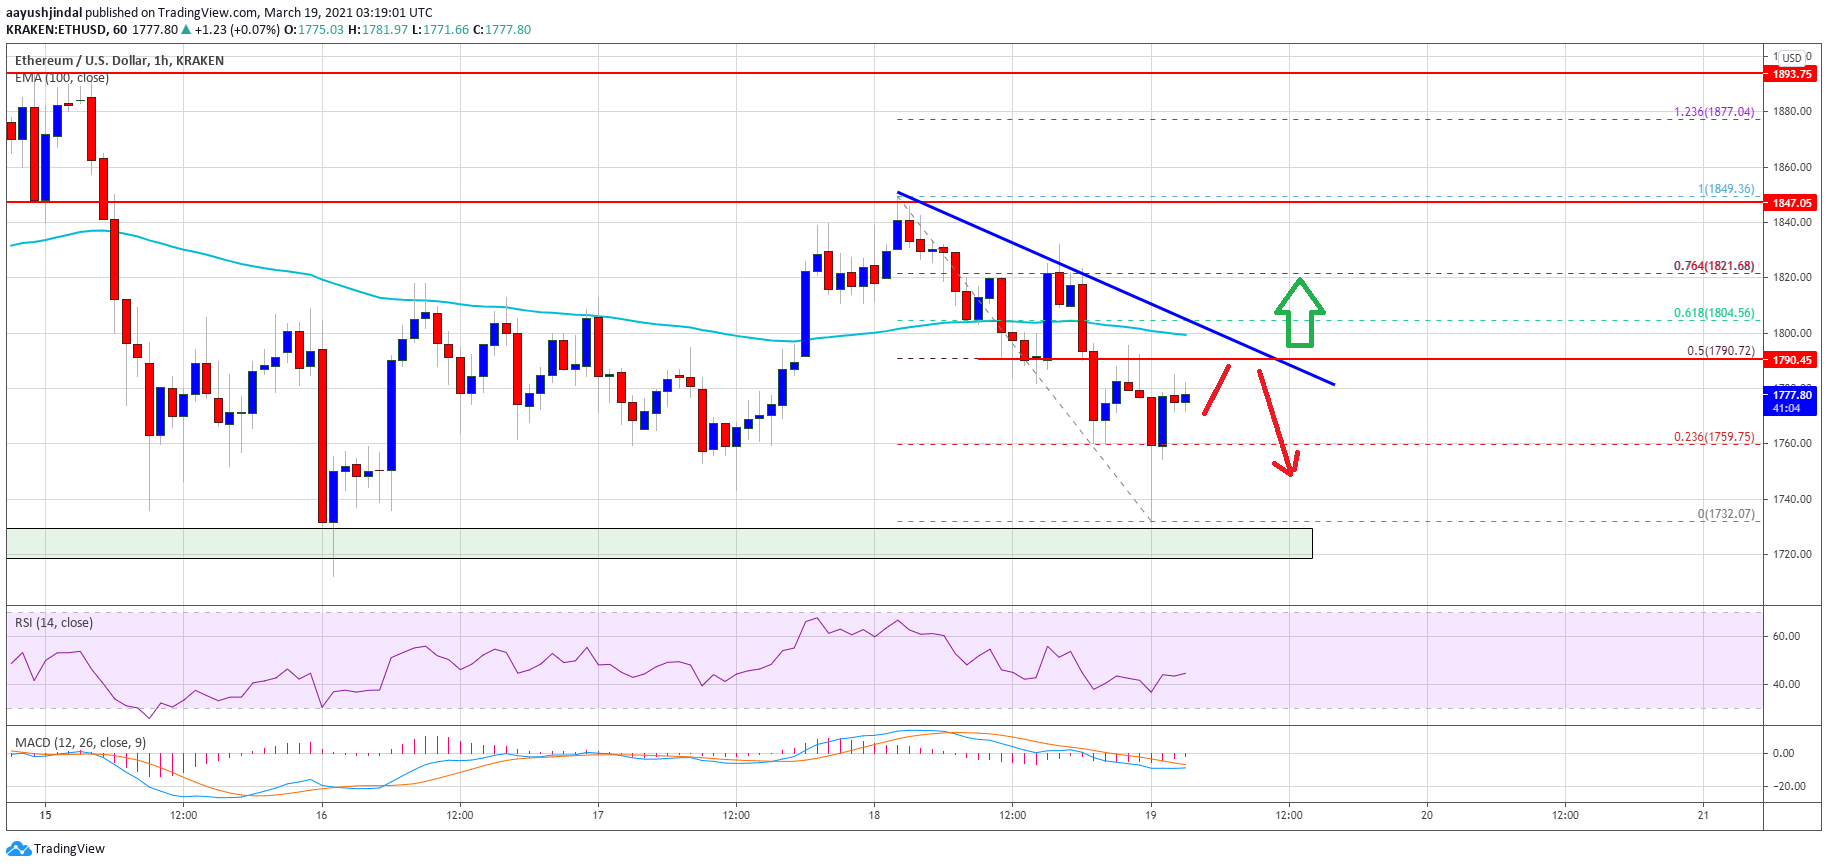
Ethereum is likely forming a strong support base above $1,580 against the US Dollar. ETH price could recover further, but it could face a strong resistance near $1,650.
- Ethereum remained strong above $1,550 and started a decent recovery.
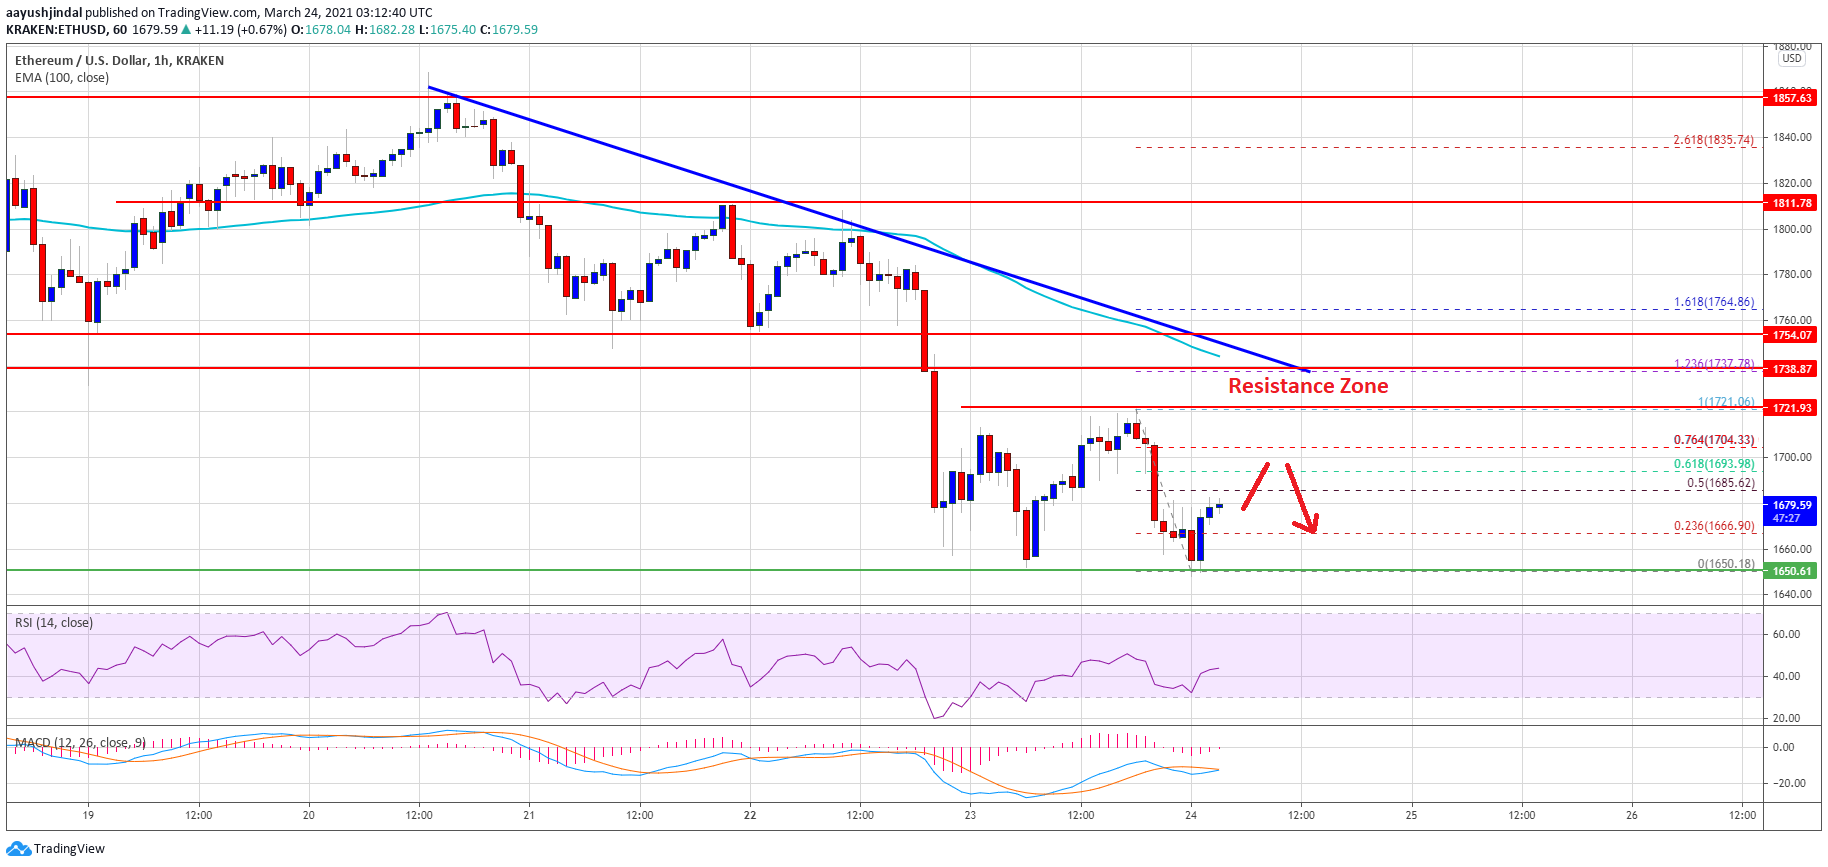
- The price is still well below the $1,650 resistance and the 100 hourly simple moving average.
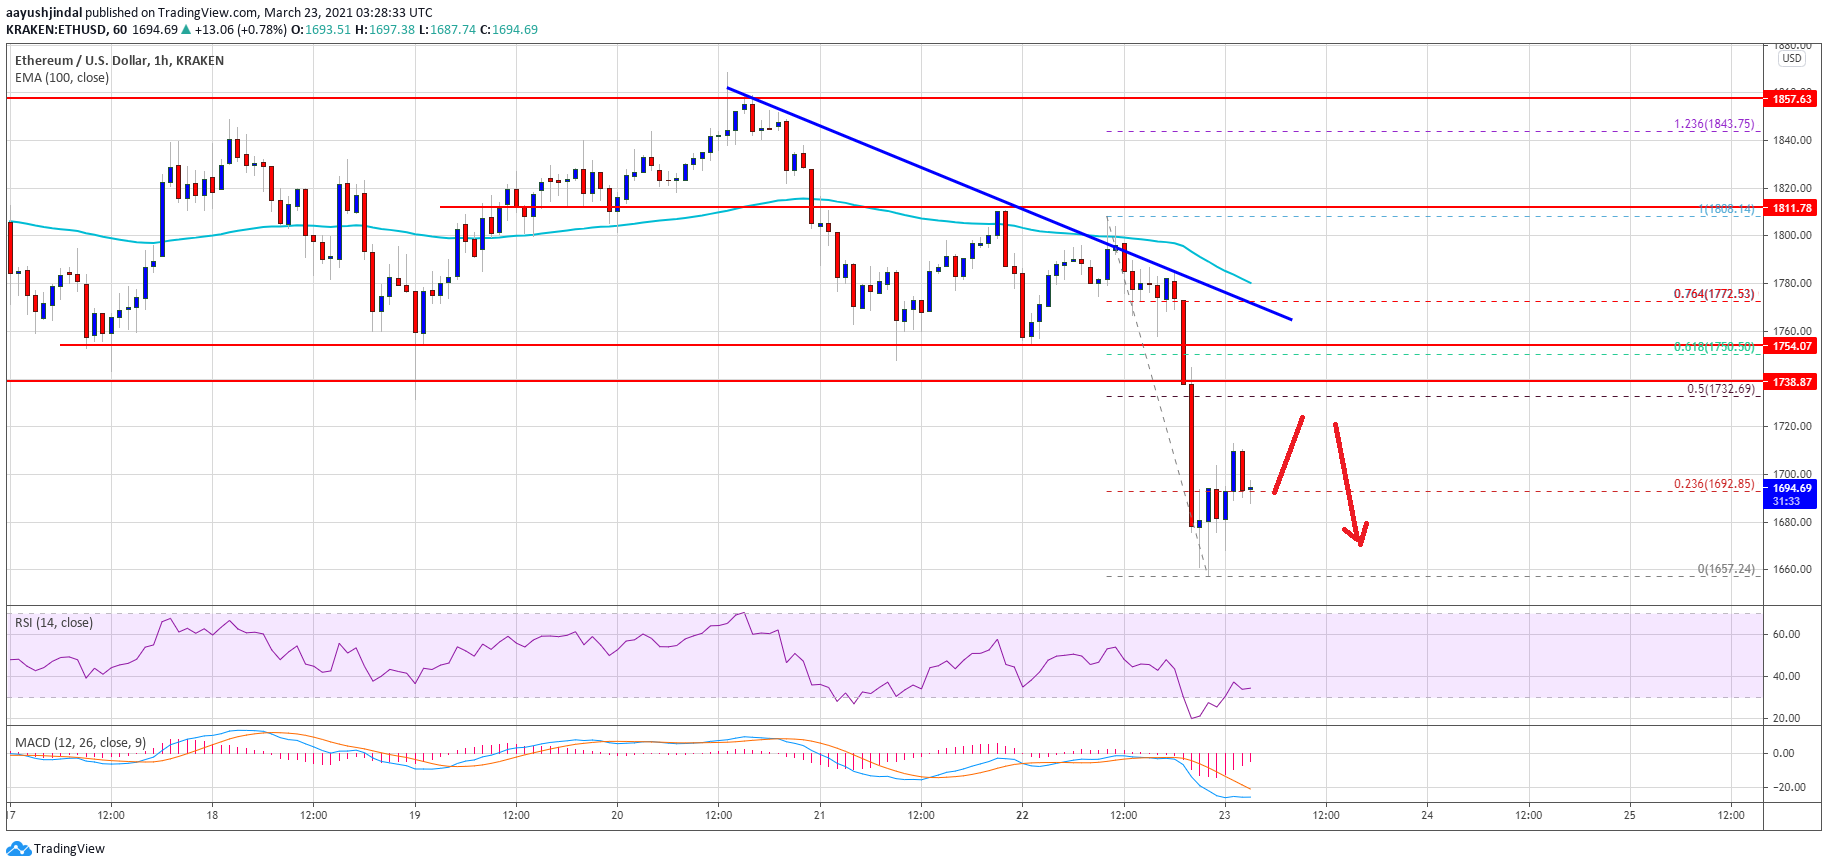
- There is a crucial bearish trend line forming with resistance near $1,660 on the hourly chart of ETH/USD (data feed via Kraken).
- The pair could correct higher, but it is likely to face a strong selling interest near $1,650 and $1,660.
Ethereum Price Back above $1,600
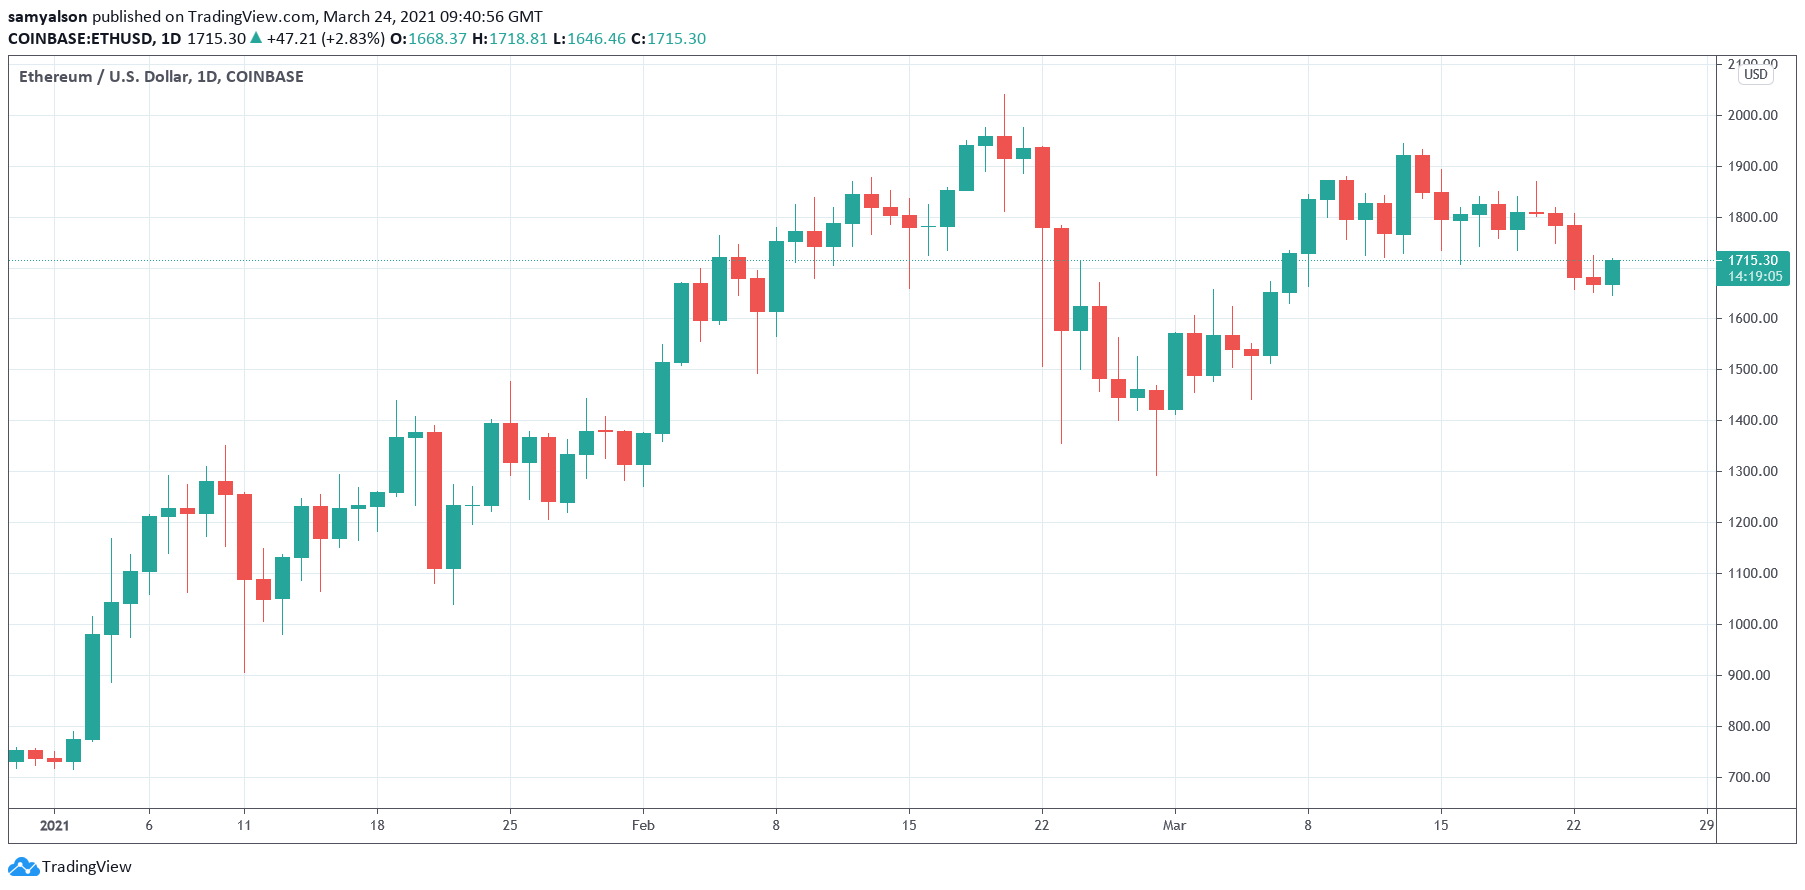
Ethereum found support near the $1,550 zone and recently started an upside correction, unlike bitcoin. A low was formed near the $1,545 level before the price climbed back above $1,600.
There was a break above the $1,605 and $1,610 levels. It seems like the price is following a rising channel with resistance near $1,640 on the hourly chart. The 50% Fib retracement level of the downward move from the $1,737 high to $1,545 low is also near $1,641.
The main resistance is still near the $1,650 level and the 100 hourly simple moving average. There is also a crucial bearish trend line forming with resistance near $1,660 on the same chart.
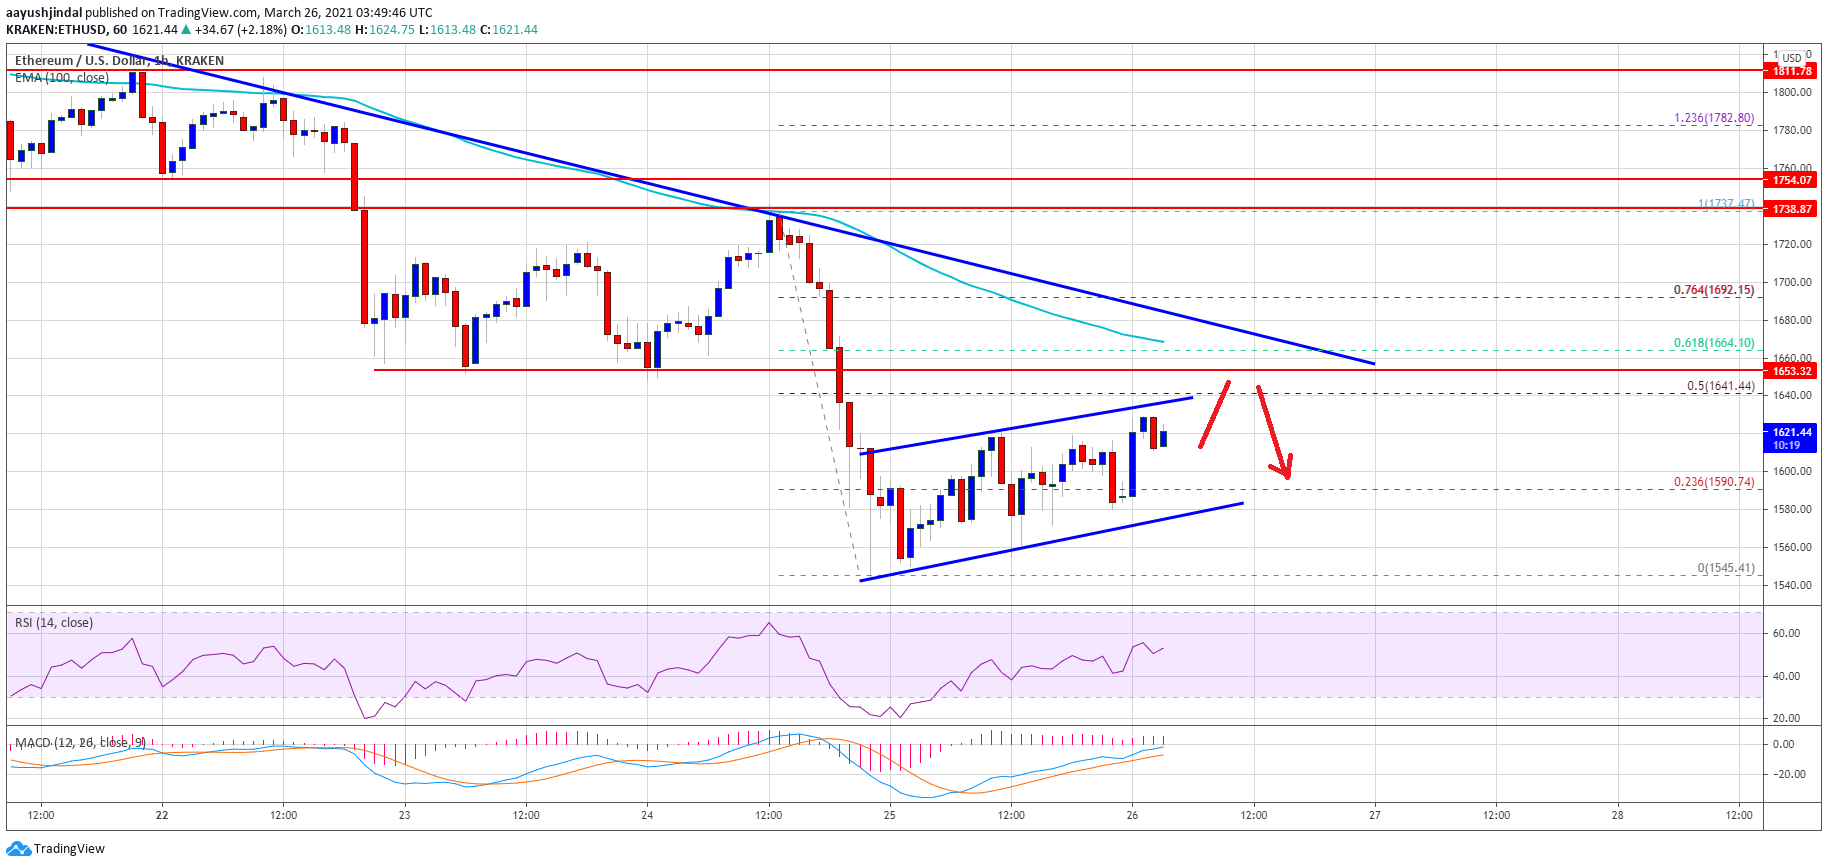
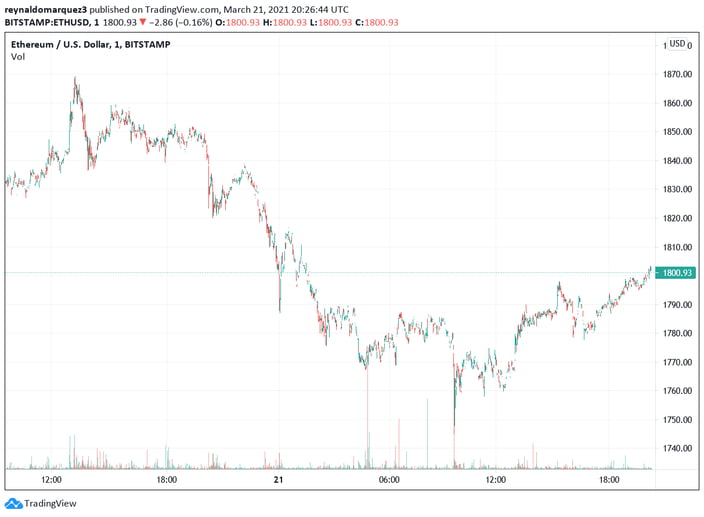
Source: ETHUSD on TradingView.com
The trend line is close to the 61.8% Fib retracement level of the downward move from the $1,737 high to $1,545 low is also near $1,641. A successful close above the $1,650 and $1,660 levels is must for a strong increase in the near term. In the stated case, the price is likely to rise further above the $1,680 and $1,700 levels. The next major hurdle is near the $1,740 level.
Fresh Decline in ETH?
If Ethereum fails to climb above the $1,640 and $1,650 resistance levels, it could start a fresh decline. An initial support on the downside is near the $1,600 level.
The first key support is near the $1,580 level and the channel lower trend line. The main support is near the $1,550 level. A clear downside break below the $1,550 support could lead the price towards the $1,500 level in the near term.
Technical Indicators
Hourly MACD – The MACD for ETH/USD is gaining momentum in the bullish zone.
Hourly RSI – The RSI for ETH/USD is now above the 50 level.
Major Support Level – $1,580
Major Resistance Level – $1,650