Is A $72K Bitcoin Surge On The Horizon? Glassnode’s Latest Analysis Points To An Answer

Recent insights from Glassnode’s cofounders, shared under their X (formerly Twitter) account ‘Negentrophic’ have sparked interest in Bitcoin market dynamics, leading to a promising stabilization and possible price surge.

Market Sentiments And EMA Trends

With Bitcoin’s value recently wavering below the $70,000 mark, a detailed analysis from the cofounders suggests that a strong support level around the $62,000 50-day Exponential Moving Average (EMA) could set the stage for a significant rebound.

This crucial support level indicates a strong buying sentiment, indicating the market’s confidence in the cryptocurrency’s value and a potential resistance against further declines.

Using the strategic placement of the 50-day EMA as a support point, the analysis suggests that investors might see the current price levels as a solid base, preventing significant downward movements.

This perspective is reinforced by recent price movements, where despite a pre-halving general dip, Bitcoin has experienced a 7.1% increase in value over the past week, and the same uptick continued in the last 24 hours.

Bitcoin (BTC) price chart on TradingView

Further analysis by the Glassnode cofounders delves into the behavior of EMAs over different durations. Short-term EMAs indicate a growing inclination among investors to buy, while longer-term EMAs lean towards selling.

This contrasting behavior between short and long-term EMAs sheds light on the current phase of the market, which seems to be in a period of consolidation after the notable 92% increase in Bitcoin’s price over six weeks earlier in the year.

Such insights are vital as they offer a deeper understanding of the underlying market forces and investor behavior during volatile periods.

Meanwhile, Glassnode’s team’s analytical approach extends beyond simple price movements. Yesterday, they compared the current market conditions to the early 2021 “strong correction,” which they term “wave 4” of the ongoing market cycle.

This historical perspective provides a lens through which current trends can be evaluated, suggesting a cyclic return to bullish conditions reminiscent of past market behaviors.

Bitcoin Bullish Projections And Market Dynamics

Bitfinex analysts have highlighted significant activities around Bitcoin withdrawals, supporting the optimistic outlook on Bitcoin. The current levels, echo those of January 2023, suggest that investors are increasingly moving their Bitcoin to cold storage—a sign that many anticipate further price increases.

Veering back to Glassnode’s projections yesterday based on their indexes and Fibonacci levels, the cofounders were boldly optimistic, anticipating a potential 350% increase from current market levels.

Notably, this forecast highlights the expected financial trajectory and underscores a growing confidence among experts and market analysts in Bitcoin’s market performance and its foundational economic principles.

Featured image from Unsplash, Chart from TradingView

‘More Upside Is Coming’: Crypto Market Set For 350% Growth, Predicts Glassnode Cofounders

Negentropic, the official X (formerly Twitter) account of Glassnode’s cofounders, has offered its own bullish sentiment for the crypto market.

Glassnode Cofounders: There Would Be A Massive Growth Beyond Recent Corrections

According to their analysis, the market, excluding the top 10 cryptocurrencies, known as “OTHERS,” is showing signs of a strong uptrend with the potential for “more upside” growth.

This observation amidst increased volatility and uncertainty following the recent Bitcoin Halving event on April 20 reduced miners’ block subsidy rewards from 6.25 BTC to 3.125 BTC.

The cofounders pointed out an intriguing pattern in the market’s behavior, comparing the current conditions to the “strong correction” seen in early 2021, which they identified as “wave 4” in the market cycle.

Using their index and Fibonacci levels, Glassnode’s cofounders anticipate approximately a 350% increase from the current market levels, noting:

More upside is coming. This index and our Fibonacci levels gives us, that we may see ~350% upside from current levels.

Notably, this bullish projection underscores their confidence in the potential for further market expansion despite recent downturns.

Crypto Market Recovery Amid Bitcoin Criticism And Post-Halving Predictions

While the Glassnode Co-founders have predicted significant growth for the crypto market, it’s important to note that the overall market sentiment remains bullish. After a notable decline last week, the global crypto market is showing signs of recovery, with nearly a 3% increase in the past 24 hours.

This upward movement can be attributed to major cryptocurrencies like Bitcoin and Ethereum, which have seen gains of 2.7% and 1.7% over the same period.

BTC price chart on TradingView amid crypto news

Bitcoin, the flagship cryptocurrency, has recently faced criticism from prominent figures like Peter Schiff, who criticized its high transaction fees and longer processing times.

Due to these challenges, Schiff labeled Bitcoin as a “failure” in terms of digital currency. However, it’s worth noting that Bitcoin’s average transaction fee has significantly decreased to $34.86 on April 21, following a record high of $128.45 the day before.

Bitcoin Average Transaction Fee

Meanwhile, analyst and founder of the Capriole Investment fund Charles Edwards has shared three possible scenarios for Bitcoin after the Halving.

Edwards highlighted the increase in Bitcoin’s electrical cost to $77,400 per new BTC coin produced, while the overall miner price, including block rewards and fees, surged to $244,000.

He predicts that Bitcoin’s price may skyrocket, approximately 15% of miners may shut down their operations, or transaction fees will remain elevated. Edwards expects a combination of these scenarios to unfold, ultimately leading to Bitcoin’s price surpassing $100,000.

Featured image from Unsplash, Chart from TradingView
111,000 BTC Move Out Of Exchange Wallets In A Month – Impact On Bitcoin Price?

The Bitcoin price has somewhat slowed down since reaching the unprecedented high of $73,000, moving mostly sideways since mid-March. However, with the halving event less than a fortnight away, all eyes will be on the premier cryptocurrency and all that pertains to it over the next couple of weeks.

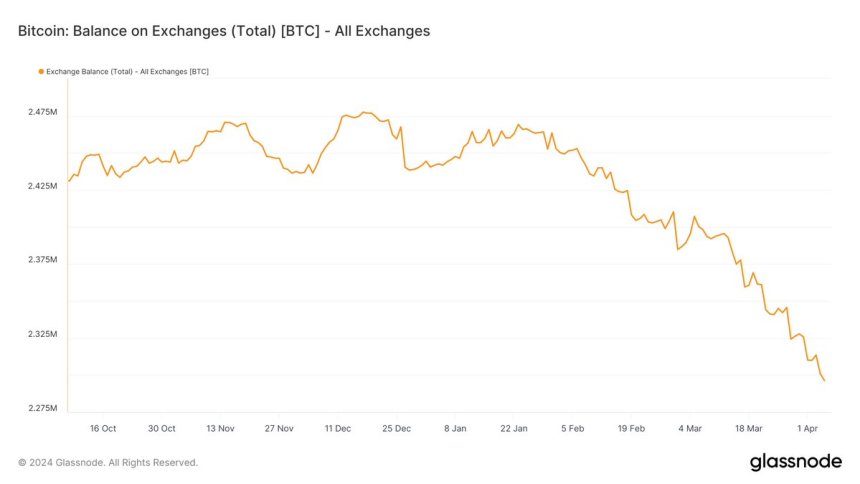
According to a recent on-chain observation, the BTC supply on exchanges has been on a steady decline over the past few months. This trend has sparked discussions on what this could mean for the Bitcoin price, both in the short and long term.

$7.55 Billion Transferred Out Of Exchange Wallets In The Past Month

Prominent crypto pundit Ali Martinez took to the X platform to share that a significant amount of Bitcoin has been moved out of crypto exchanges over the past month. The relevant metric here is Glassnode’s Balance on Exchanges, which tracks the total amount of a cryptocurrency (Bitcoin, in this case) held across all exchange addresses.

A decrease in the value of this indicator implies that investors are making more withdrawals than deposits of Bitcoin into centralized exchanges. The metric’s increase, on the other hand, indicates that more BTC is flowing into these exchanges than leaving.

Bitcoin price

According to Martinez, about 111,000 BTC (worth approximately $7.55 billion) have been transferred out of known crypto exchange wallets in the past month. Typically, an exodus of funds (of this magnitude) suggests a significant shift in the sentiment of Bitcoin investors.

While the exact rationale behind such a massive movement of Bitcoin remains unclear, the flow of funds from trading platforms suggests a growth in investor confidence. This implies that BTC owners are more interested in holding their assets in the long term rather than selling for short-term gains.

Furthermore, this continuous downward trend in BTC’s balance on exchanges could set the stage for a bullish rally for the Bitcoin price. A sustained drop in the BTC’s supply on centralized exchanges could result in a supply crunch – a scenario where the supply of a particular asset is lower than its demand, leading to a surge in its value. 

Another potential bullish catalyst for the Bitcoin price is the upcoming halving event, which is expected to occur on April 18, 2024. With the miners’ rewards slashed in half and the production of Bitcoin slowed, this event is expected to impact the value of BTC positively.

Bitcoin Price At A Glance

As of this writing, the Bitcoin price stands at around $69,537, reflecting a 2.7% increase in the last 24 hours.

Bitcoin price

Bitcoin Long-Term Holders & Price Top: Glassnode Reveals Pattern

The on-chain analytics firm Glassnode has explained that Bitcoin tends to reach a potential top when the long-term holders show this pattern.

Bitcoin Long-Term Holders Have Been Ramping Up Distribution

In a new report, Glassnode discussed the influence that the BTC long-term holders have on the cryptocurrency’s supply dynamics. The “long-term holders” (LTHs) here refer to the Bitcoin investors who have been holding onto their coins for more than 155 days.

The LTHs comprise one of the two main divisions of the BTC user base based on holding time, with the other cohort known as the “short-term holders” (STHs).

Historically, the LTHs have proven themselves to be the persistent hands of the market. They don’t quickly sell their coins regardless of what is happening in the broader sector. The STHs, on the other hand, often react to FUD and FOMO events.

As such, it’s not unusual to see the STHs participating in selling. However, the LTHs showing sustained distribution can be something to note, as selling from these HODLers, who usually sit tight, may have implications for the market.

There are many different ways of tracking the behavior of the LTHs, but in the context of the current discussion, Glassnode has used the “LTH Market Inflation Rate” metric.

As the report explains:

It shows the annualized rate of Bitcoin accumulation or distribution by LTHs relative to daily miner issuance. This rate helps identify periods of net accumulation, where LTHs are effectively removing Bitcoin from the market, and periods of net distribution, where LTHs add to the market’s sell-side pressure.

Now, here is a chart that shows the trend in the BTC LTH Market Inflation Rate over the past several years:

Bitcoin LTH Market Inflation Rate

In the chart, the analytics firm has also attached the data for the asset’s Inflation Rate, which is basically the amount that the miners are introducing into the circulating supply by solving blocks and receiving rewards for them.

When the LTH Market Inflation Rate equals 0%, these HODLers are accumulating amounts exactly equal to what the miners are issuing.

This implies that the indicator below the 0% mark suggests the LTHs are pulling coins out of the supply, while it being above is a sign that they are either distributing or just not buying enough to absorb what the miners are producing.

The graph shows that historically, the cryptocurrency’s price has tended to reach a state of equilibrium and potentially even a top when the LTH distribution has peaked.

The LTH Market Inflation Rate has been increasing recently, but it’s yet to reach any significant levels. As for what this could mean for the market, Glassnode says:

Currently, the trend in the LTH market inflation rate indicates we are in an early phase of a distribution cycle, with about 30% completed. This suggests significant activity ahead within the current cycle until we achieve a market equilibrium point from the supply and demand perspective and potential price tops.

BTC Price

Bitcoin has retraced most of its recovery from the past few days, as its price has now declined to $63,800.

Bitcoin Price Chart

This Bitcoin Halving May Not Result In Supply Squeeze: Glassnode

Glassnode has suggested that the upcoming Bitcoin halving might not result in a supply squeeze that the market may have anticipated.

Bitcoin Halving May Not Carry Same Impact Due To Spot ETFs

In a new report, the on-chain analytics firm Glassnode has discussed the impact the next Bitcoin halving may have on the economics of the cryptocurrency.

The “halving” is a periodic event for BTC where its block rewards (the rewards the miners receive for adding blocks on the network) are permanently cut in half.

This event is built into the coin’s code, meaning it happens automatically. The halving kicks in after every 210,000 blocks, or approximately every four years.

The next such event will take place sometime in the coming month. Historically, the halving has been considered an important event for the asset due to how it influences its supply dynamics.

The block rewards the miners receive are the only way to introduce new BTC tokens into circulation. Since they get tightened during these events, the cryptocurrency’s production rate slows down following them.

As such, halvings are considered bullish events, with the price increasing following them due to the constrained supply, as supply-demand dynamics would dictate.

“However, the current market conditions differ from historical norms,” says Glassnode. The reason behind that is simple; there is something now that was never there in the past: the spot exchange-traded funds (ETFs).

Spot ETFs are investment vehicles that buy and hold Bitcoin and allow their users to gain indirect exposure to the cryptocurrency’s price action through them. Since the spot ETFs are available on traditional exchanges, they can be preferable for those not looking to dabble with digital asset platforms and wallets.

Thus, the ETFs have introduced a notable amount of fresh demand for the asset, with supply rapidly leaving the market and entering these funds. To put this demand into perspective, the analytics firm has compared it against the BTC amount miners issue on the chain daily.

Bitcoin Miner Issuance Vs Spot ETFs

As the above chart shows, the Bitcoin ETF flows have generally been much higher than what the miners have been introducing into circulation. Based on this, Glassnode believes “the upcoming halving might not result in the supply squeeze once anticipated.”

The report further says:

The ETFs are, in essence, preempting the halving’s impact by already tightening the available supply through their substantial and continuous buying activity. In other words, the supply squeeze usually expected from halvings may already be in effect due to ETFs’ large-scale bitcoin acquisitions.

Something to note, however, is that the ETFs aren’t certain to always be a bullish influence for the market. Should the current inflow-heavy regime flip to one dominated by outflows, the cryptocurrency could naturally witness extraordinary selling pressure.

In fact, the spot ETF netflows have been negative for Bitcoin for four straight days now, so such a trend shift may already be in action.

BTC Price

Bitcoin had recovered beyond the $68,000 level yesterday, but the coin has since declined again, falling back towards $64,200.

Bitcoin Price Chart

Is Altcoin Season On? Here’s What Glassnode Data Says

Here’s what the “Altseason Indicator” from the on-chain analytics firm Glassnode says regarding if an Altcoin season is currently going on or not.

What Altseason Indicator Says Regarding The Altcoin Season

In its latest weekly report, Glassnode has discussed what the Altcoin season status for the cryptocurrency market has looked like recently. To check whether the “altseason” is on, the analytics firm has devised its Altseason Indicator.

This metric judges if the investors are in a risk-on mode based on how capital rotations are occurring in the sector. There are two conditions the indicator checks for.

First, the Altseason Indicator looks at the capital netflows involving the three major asset classes in the sector: Bitcoin (BTC), Ethereum (ETH), and stablecoins.

For the former two assets, netflows are gauged using their “realized caps.” The realized cap is a capitalization model that calculates any asset’s total valuation by assuming that the real value of any token in circulation is the price at which it was last moved rather than the current spot price.

The last transfer for any coin was likely the last point at which it changed hands, so the price at the time of that transaction would be its current cost basis. As such, the realized cap sums up the cost basis of every holder in the sector.

Put another way, the realized cap measures the actual amount of capital the investors have put into the asset. Thus, changes in the metric would reflect the amount of capital flowing into or out of the asset.

For the stablecoins, net flows can be judged based on the supply or market cap alone, as the stables’ value remains tied to $1 at every point, so the magnitude of the market cap and realizes cap would be equal (both of these would also equal the supply, except for the unit).

For the Altcoin Season to be active, all three asset classes should have positive netflows. This is because capital generally enters the cryptocurrency sector through these coins and only then rotates into altcoins as investors’ appetite for risk rises.

The other condition the Altseason Indicator checks for is the momentum in the altcoin market cap itself. In particular, the metric confirms whether or not the altcoin market cap is currently over its 30-day simple moving average (SMA).

Altcoin Season Indicator

The chart shows that the Altseason Indicator first started flashing the risk-on signal in October of last year. However, the signal turned off when the market cooled off following the launch of the Bitcoin spot ETFs.

After staying off for 22 days this month, though, the Altseason Indicator seems to have been saying that the Altcoin season is back on.

BTC Price

At the time of writing, Bitcoin is trading around the $50,900 level, down 1% in the past week.

Bitcoin Price Chart

Bitcoin Bull Run: On-Chain Data Points To Declining Retail Participation

The price of Bitcoin has continued to soar this week, with the premier cryptocurrency consolidating its place above the $50,000 mark. Interestingly, on-chain data shows that a particular class of investors had less to do about the recent rally, sparking conversations about their participation in the current bull cycle.

Recent BTC Price Primarily Fueled By ‘Institutional Demand’

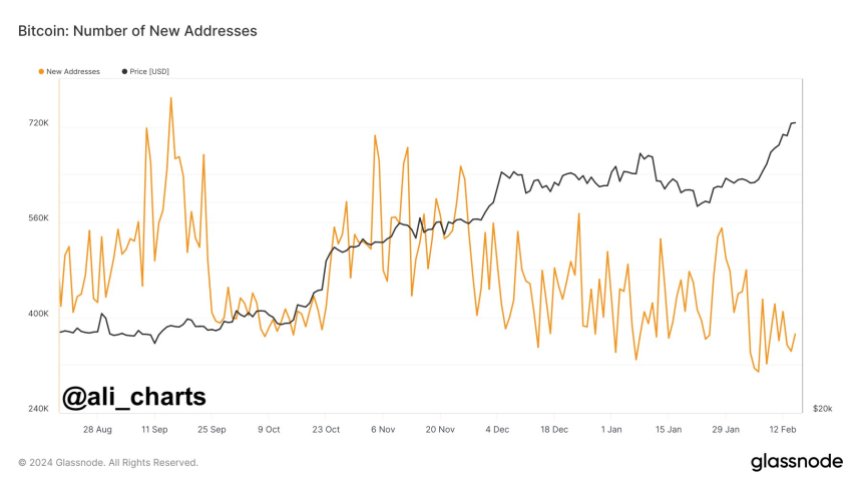
In a recent post on X, analyst Ali Martinez pointed out that there has been an apparent decline in the involvement of retail investors in the Bitcoin market. This shift comes despite the recent surge in the flagship cryptocurrency’s price.

This revelation is based on the noticeable fall in the daily creation of new Bitcoin addresses. According to the crypto intelligence platform Glassnode, this metric tracks the number of unique addresses that appeared for the first time in a transaction of the native coin in the network.

Bitcoin

Typically, more individuals are inclined to enter the market as the value of Bitcoin increases, often resulting in a spike in new addresses to store and transact the coin. However, there is currently a deviation between the BTC price and the creation of new addresses.

According to Martinez, this curious trend suggests a lack of retail participation in the ongoing Bitcoin bull run. The crypto analyst, however, tied the flagship cryptocurrency’s recent positive performance to institutional players’ activity.

This analysis seems to hold some weight, considering it’s been a little over a month since the Securities and Exchange Commission approved the trading of spot BTC exchange-traded funds in the United States. These investment products are issued and managed by some of the world’s largest financial companies, including BlackRock, Grayscale, Fidelity, and so on.

Bitcoin Whales Show Highest Activity Since 2022

Another on-chain revelation that somewhat supports the argument of increased institutional participation has emerged. According to analytics platform Santiment, BTC whale activity has been heating up lately, reaching its highest level in over 20 months.

Data from Santiment shows that wallets with 1,000 – 10,000 BTC are on an accumulation spree, adding roughly 249,000 coins (worth about $12.8 billion) in 2024 only. However, it is worth mentioning that a lower tier of investors (100 – 1,000 BTC) has sold more than 151,000 Bitcoin since the year started.

As of this writing, Bitcoin is valued at $51,950, reflecting a 0.6% decline in the past day. Nonetheless, the premier cryptocurrency has retained most of its weekly profit, having gained almost 10% in the last seven days.

Bitcoin

Bitcoin Short-Term Holders Just Locked In $647 Million In Profits

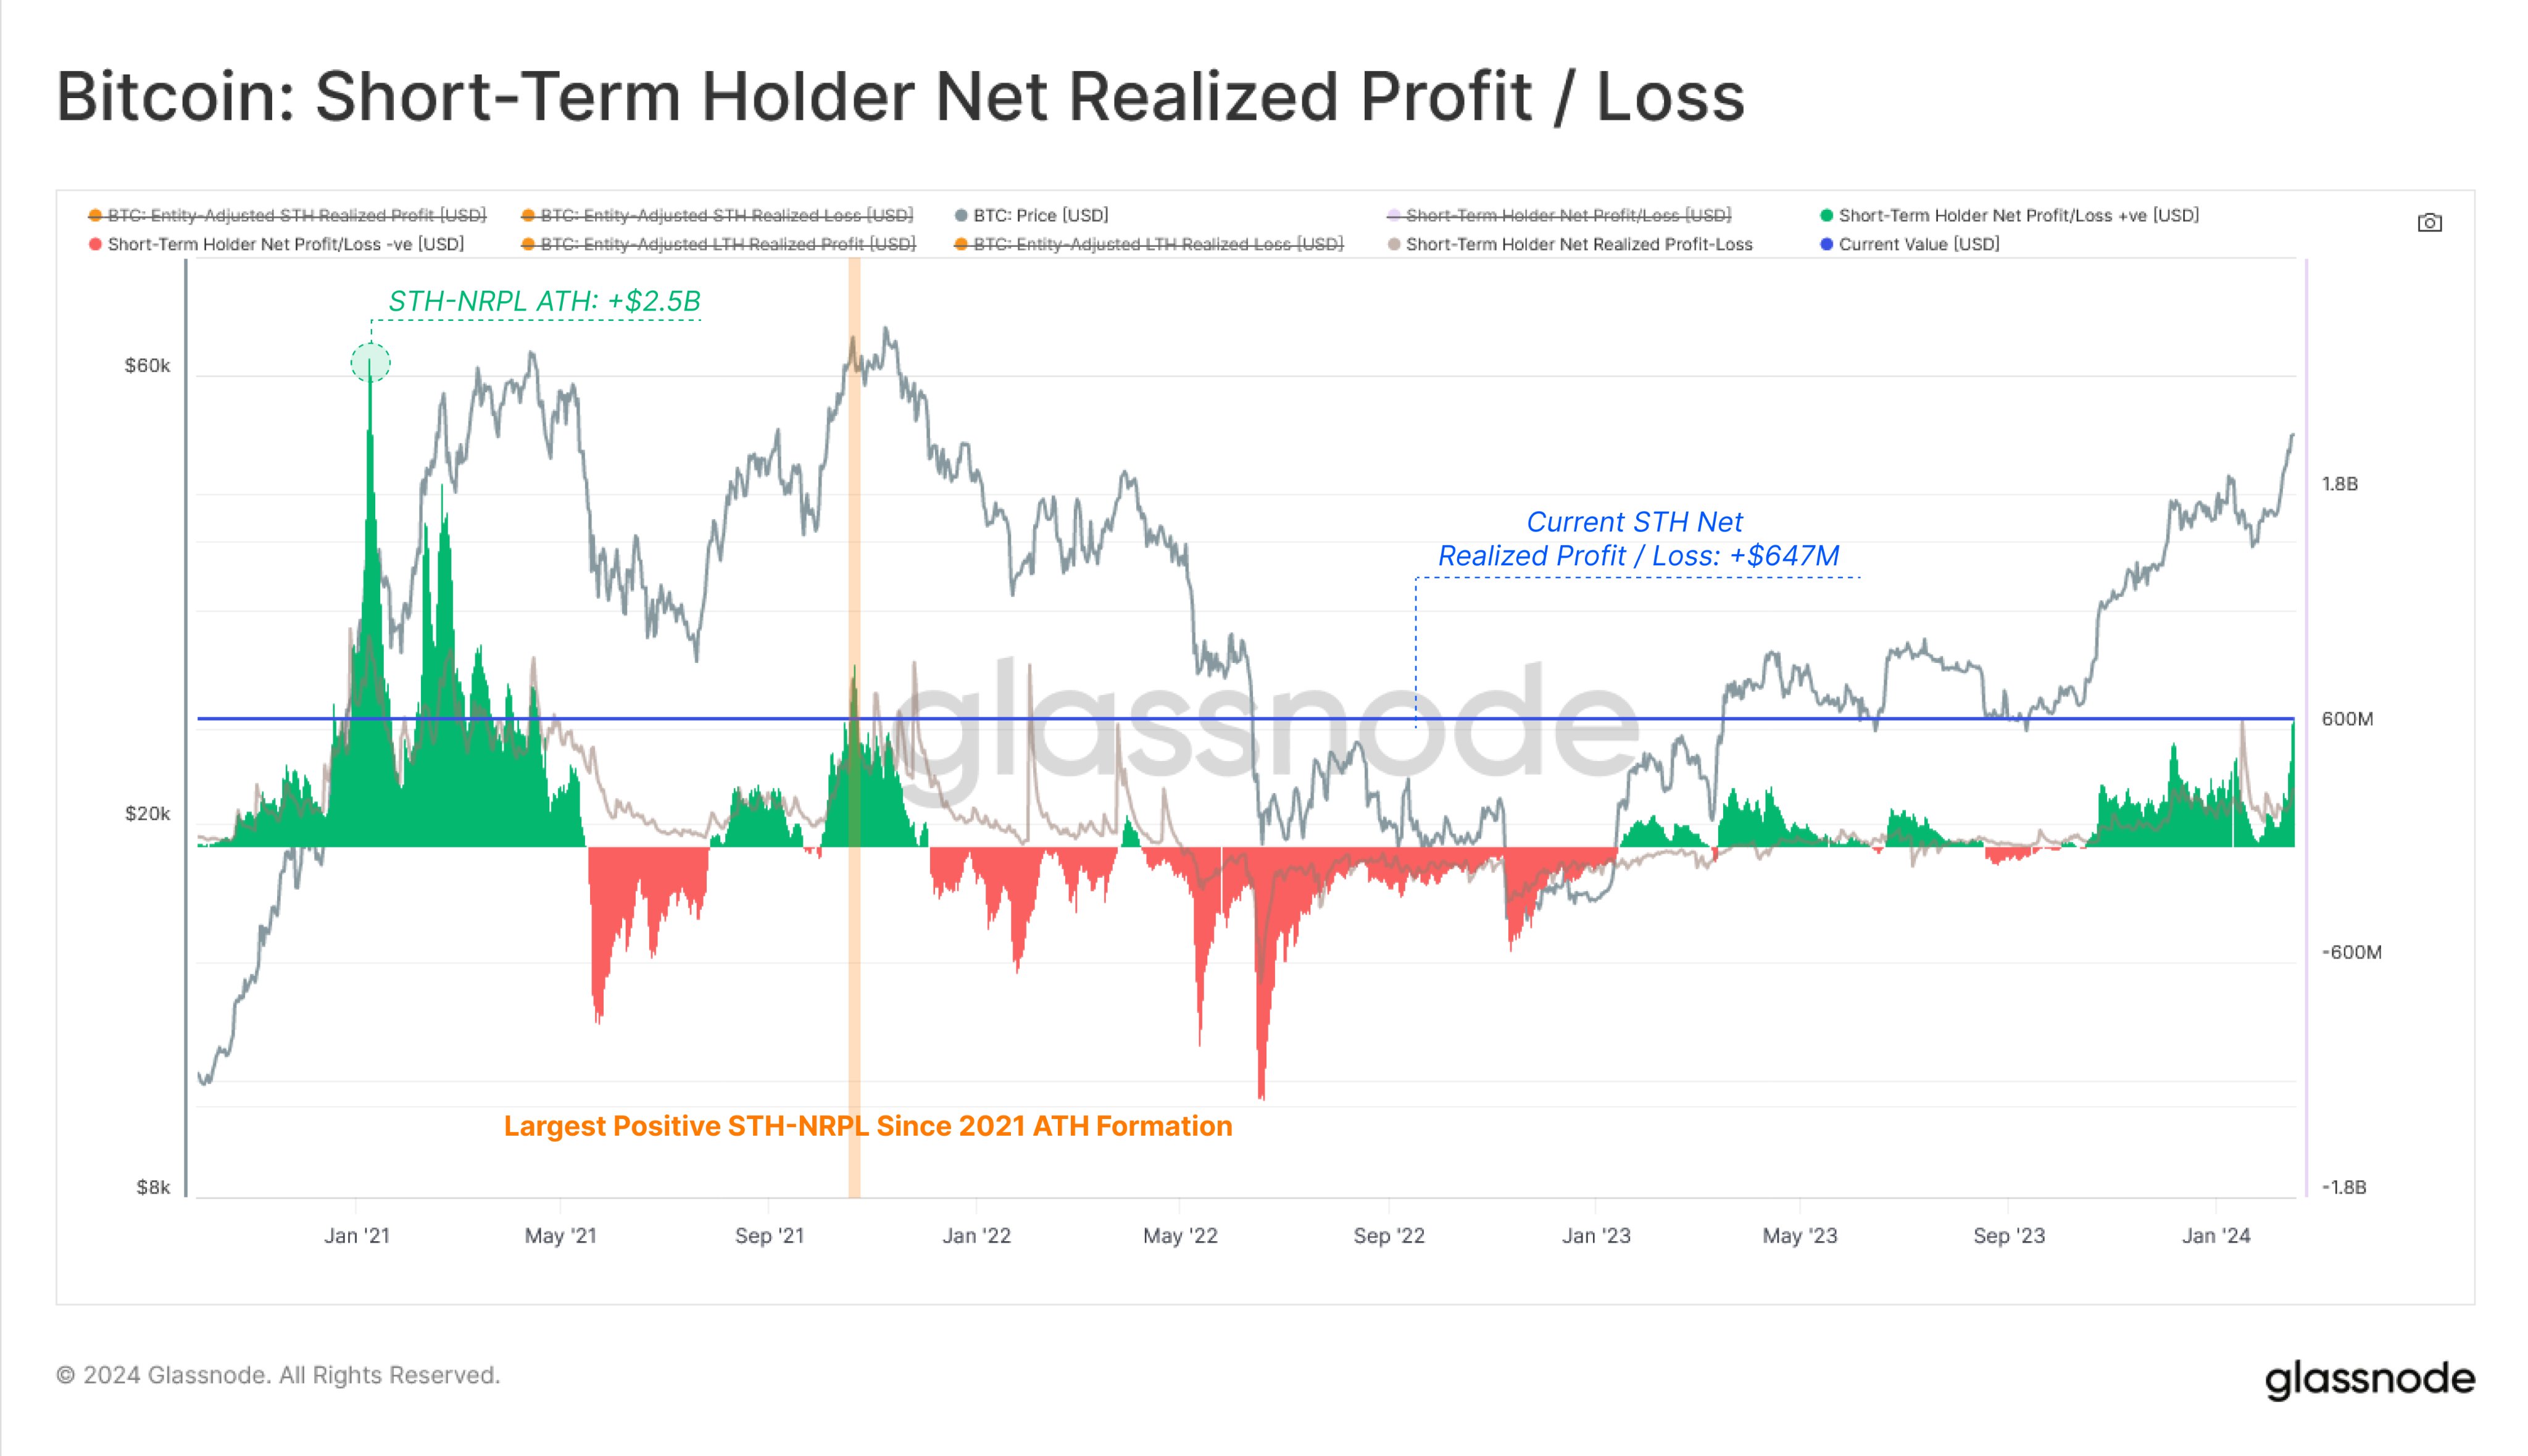
On-chain data from Glassnode shows that the Bitcoin short-term holders have recently participated in a massive $647 million profit-taking event.

Bitcoin Short-Term Holders Have Realized Large Net Profits Recently

According to data from the on-chain analytics firm Glassnode, the short-term holders have given a strong reaction to the $52,000 break. The “short-term holders” (STHs) here refer to the Bitcoin investors who bought their coins within the past 155 days.

Statistically, the longer an investor holds onto their coins, the less likely they become to sell at any point. The STHs have a relatively low holding time, so they easily sell during price rallies or crashes.

On the other hand, the “long-term holders” (LTHs), which make up the rest of the userbase (that is, those withholding time greater than 155 days), tend to carry a strong resolve.

Since the STHs are fickle-minded, it’s not surprising that they have made some selling moves after the latest rally in the asset. One way to gauge the reaction of this cohort is through the “Net Realized Profit/Loss” metric.

This indicator keeps track of the net profit or loss the investors realize across the network. The metric finds this value by going through the on-chain history of each coin being transferred right now to check the price it was moved at before.

Assuming that a change of hands occurred in the previous transfer and that another such change is happening with the current one, then the coin’s sale would realize a profit or loss equal to the difference between the two prices.

The Net Realized Profit/Loss sums up all such profits and losses and outputs the net value. Now, here is a chart that shows the trend in this indicator specifically for the Bitcoin STHs over the past few years:

Bitcoin STH Net Realized Profit/Loss

As displayed in the above graph, the Bitcoin STH Net Realized Profit/Loss has spiked to highly positive levels recently, implying that these investors’ profits have significantly outweighed the losses.

This cohort has realized $647 million in net profits during this latest selling spree. The chart shows that the last time the indicator was at higher positive values was back around the formation of the 2021 all-time high.

The current values aren’t off this mark, but the STH Net Realized Profit/Loss levels that hit back during the first half of the 2021 bull run are still far away. For perspective, the peak in the metric achieved back then was $2.5 billion, which remains the all-time high for the indicator.

BTC Price

Since the rapid surge above $52,000, Bitcoin has calmed down slightly, as it has moved sideways in the past few days. At present, BTC is trading at around $52,500.

Bitcoin Price Chart

Crypto Analyst Predicts Bitcoin To Reach $60,000, Here’s Why

Amid the recent rally that Bitcoin (BTC) experienced at the start of the week, several well-known cryptocurrency analysts seem to be bullish about the largest crypto asset, delivering multiple positive predictions for BTC in the short and long term.

Bitcoin Poised To Hit The $60,000 Price Mark

One of the famous crypto analysts who has recently shared exciting and positive predictions for Bitcoin is Ali Martinez. Martinez, known for his enthusiasm for cryptocurrency, took to the social media platform X (formerly Twitter) to share his projections with the community.

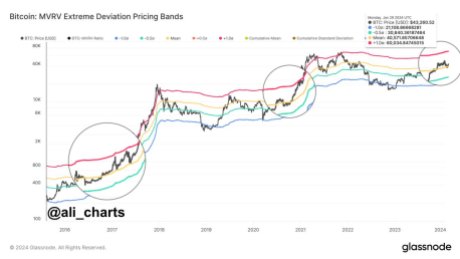
The analyst’s prediction delves into the Market Value to Realized Value (MVRV) ratio pricing band for Bitcoin. Ali Martinez has examined historical patterns seen in the previous bull markets that could send the price of BTC soaring.

According to him, the historical pattern seems to be appearing now in Bitcoin’s MVRV chart. He asserted that the BTC’s price has recovered from the mean MVRV level at $40,500, which is a similar form showing in the present market.

Bitcoin

He added that with this form, it is possible for Bitcoin to rise in the direction of the 1.0 standard deviation line. Due to this, Martinez anticipates the price of BTC to reach a fresh yearly high of $60,000 price mark.

The post read:

We are witnessing a similar pattern now. With the recent bounce from the mean MVRV at $40,500, there is potential for BTC to surge to the 1.0 standard deviation line at $60,000.

Martinez’s latest Bitcoin analysis has since sparked fresh sentiment from the crypto community toward the digital asset. His forecast came in light of BTC experiencing a rally, taking its price to $43,000 as of Tuesday, January 30.

Investors and traders are now keeping a careful eye on these events in hopes of identifying future BTC market opportunities. This also suggests the introduction of new investors and traders in BTC.

In another X post, the expert highlighted the emergence of fresh Bitcoin addresses. He noted that about “67 new entities” now hold 1,000 BTC and above, which indicates “a 4.50% rise in two weeks.”

Analyst Delve Into BTC’s Price Action

Negentropic, the co-founder of Glassnode, has revealed his latest projections for BTC’s price action. Negentropic reported that a substantial liquidity pool for long positions had formed as Bitcoin crossed $42,200, suggesting a “neutral impulse.”

This action points to BTC‘s plan to cross the $42,000 liquidity barrier, which might bring up more market change and volatility. He further noted that due to the action, liquidations totaling “$659 million” took place.

Furthermore, as optimism rises, he expects that liquidations in short positions might reach a whopping $1 billion. As a result, it will position the market for a possible upward trend.

Currently, Bitcoin’s price is trading at $42,979, demonstrating an increase of over 7% in the past week. However, its market cap and trading volume are each down by 1%, according to CoinMarketCap.

Bitcoin

Glassnode Co-Founder Warns: Bitcoin’s Surge Could Trigger A $1 Billion Liquidation Event – Here’s Why

A notable perspective recently came from the Glassnode co-founders Jan Happel and Yann Allemann, Negentropic on X, who recently shared insights into Bitcoin price dynamics. Notably, the analysts highlighted liquidity as a crucial factor for Bitcoin’s price trajectory.

Bitcoin Market On The Brink Of Spike In Volatility

Negentropic revealed that BTC’s recent ascent above $42,200 has created a significant liquidity pool for long positions, marked by a “neutral impulse” in the market.

This trend indicates that Bitcoin aims to bridge the liquidity gap above the $42,000 mark, which hints at potential volatility and significant market changes.

So far, about $659 million in liquidations have taken place,  leading Negentropic to predict that continuing the bullish momentum could trigger liquidations worth $1 billion in short positions.

This scenario could catalyze a market uplift through a “short squeeze,” a rapid price increase forcing short sellers to exit their positions. Such market movements often result in dramatic shifts, providing a fertile ground for Bitcoin’s growth.

Meanwhile, in a post uploaded last week, Negentropic linked the burgeoning liquidity in the crypto market to China’s efforts to stabilize its markets by injecting substantial liquidity. According to the Glassnode co-founder, this development could serve as a crucial catalyst for crypto like Bitcoin and equity markets as we progress into the first half of 2024.

This perspective aligns with the broader market recovery, as Bitcoin shows signs of resurgence following reduced selling pressure, particularly from the Grayscale Bitcoin Trust (GBTC).

Bitcoin trades for $43,166, up 6% in the past week. However, despite this uptick, the asset’s daily trading volume remains subdued, down from $26 billion last Monday to $14 billion today, indicating a cautious market sentiment.

Bitcoin (BTC) price chart on TradingView

BTC Bullish Signals Strengthen

Amid these market developments, bullish forecasts continue to emerge. Crypto analyst Jelle recently suggested that with Bitcoin reclaiming the $42,000 level, it might be “time to focus on longs once again.”

Echoing this sentiment, Michael van de Poppe, a prominent crypto analyst and pundit, expressed optimism in his latest YouTube video. He argued that the recent price correction in Bitcoin might have reached its conclusion.

Further supporting the bullish sentiment, Ali’s chart analysis reveals an increase in large Bitcoin holders. An additional 46 entities now possess 1,000 BTC or more, a 3% rise in just two weeks.

Featured image from Unsplash, Chart from TradingView

Ethereum Is The Biggest Winner In Post-ETF Approval Market: Glassnode

While Bitcoin has struggled since the much-anticipated spot ETFs have gone live, Ethereum has emerged as a winner in the sector.

Ethereum Has Done Better Against Both Bitcoin And Altcoins Recently

In its latest weekly report, the on-chain analytics firm Glassnode has discussed how Bitcoin, Ethereum, and the altcoins have performed against each other recently.

The cryptocurrency sector as a whole has enjoyed a net rise since BlackRock first filed for its exchange-traded fund (ETF) last year.

Ethereum Vs Bitcoin Vs Altcoins

This period was filled with speculation about whether the various spot ETFs would go through. Still, starting mid-October, the assets rose as confidence that approval would be achieved went up.

“Bitcoin’s market cap has increased by +68.8% since BlackRock first filed for their ETF, and the aggregate Altcoin Market Cap followed suit, rising by +68.9%,” reads the report. “However, Ethereum has seen more sluggish relative momentum, underperforming the wider altcoin space by -17%.”

Next, Glassnode has talked about the “market cap dominance” of these asset classes, which measures the percentage share they occupy in the total valuation of the cryptocurrency sector.

Ethereum Market Cap Dominance

Since the FTX collapse in November 2022, Bitcoin’s market cap dominance has notably risen. However, BTC hasn’t taken a share of Ethereum as the second-largest coin’s dominance has moved mostly sideways in this period. Instead, the altcoins and stablecoins are the ones who have lost dominance to Bitcoin.

The BTC spot ETFs finally gained approval earlier this month, but the event turned out to be a sell-the-news one for the asset. In this post-ETF era, though, a new narrative has appeared in the sector in the form of the ETH spot ETFs.

“Shortly after the approval of the Bitcoin ETF, several issuers have filed or suggested a willingness to advocate for a spot ETF for Ethereum,” notes Glassnode. “Although obtaining approval for an ETH-based ETF might be more challenging due to the SEC possibly considering Ether as more of an investment contract, the markets appeared to express optimism.”

As the chart below shows, Ethereum’s dominance against Bitcoin has gone up.

Ethereum And Bitcoin

As the graph shows, ETH’s market cap dominance versus BTC has increased by about 2.9% since the latter’s spot ETFs gained approval from the US SEC.

The altcoin side of the sector has seen a net rise in this period as well, but the alts haven’t been able to keep up with ETH, as the latter has generally outperformed them.

Ethereum And Altcoins

In total, Ethereum has earned 4.2% in global dominance. “This makes ETH the biggest winner in the post-ETF approval market movements,” explains the analytics firm.

ETH Price

At the time of writing, Ethereum is trading at around $2,230, up 1% in the last 24 hours.

Ethereum Price Chart

Ethereum Price To Reach $5,000, BitMex Founder Predicts

BitMex founder Arthur Hayes has revealed that he is diverting his interest toward Ethereum (ETH) while disclosing a bold prediction for the crypto asset.

Arthur Hayes Doubling Down On Ethereum

Arthur Hayes recently took to X (formerly Twitter) to share his optimism and prediction about the future of Ethereum, and the post has since caused quite a stir in the entire cryptocurrency community.

Renowned for his perceptive market analysis, Hayes claimed to have had a revelation on ETH during one of his meditations, and this prompted him to significantly alter his cryptocurrency holdings. He sarcastically asserted in the X post to have gotten the direction from the Lord. 

Following this supposed heavenly direction, Hayes allegedly sold his Solana holdings and increased his stake in Ethereum. In addition, he has predicted a spike that would take the price of the cryptocurrency asset to an astounding $5,000.

He further conveyed his love and appreciation for Vitalik Buterin, the co-founder of Ethereum. Hayes called Vitalik an Archangel while doing so.

Hayes’ evaluation of the market dynamics might have played a role in his choice to divert from Solana to Ethereum. In another X post, Arthur Hayes shared a chart of Ethereum to back up his predictions. The crypto exchange founder has urged the crypto community to “get down” on the digital asset.

The BitMex founder’s projections come after his previous call, in which he predicted that Solana’s price would hit $100. Hayes’ prediction has appeared to be almost accurate, as the digital asset’s price has recently reached a peak of $99.

Since mid-December SOL has been demonstrating a rally, increasing by an astounding 350%. Despite the fact that Solana is displaying an upward trajectory, Hayes seems to think that Ethereum still has the potential to outperform SOL.

Glassnode Co-Founders Give Next Target For The Crypto Asset

Jan Happel and Yann Allemann, cofounders of Glassnode and collectively known on X as Negentropic, have highlighted the next target for Ethereum. According to the cofounders, the next target for ETH is $2,500 and has urged the community to keep an eye on this level.

Negentropic asserted that the asset reaching the $2,500 target will be triggered by market enthusiasm. Another target identified by the founders is $2,700, which ETH will attain by continuous ambitious push.

Ethereum

The co-founders also highlighted a support level at $2,100, which was once a resistance level but now a key zone. However, Negentropic pointed out that the level has now turned out to be critical for short-term rebounds. In addition, they asserted that if ETH ends up breaching the support level, it might activate the 50-Day EMA.

As of the time of writing, Ethereum is trading at $2,307, indicating a 1.30% increase in the past 24 hours. Its trading volume has increased by 19% to $16,690,793,321, its market capitalization has increased by 1.31% to $277,454,559,883.

Ethereum

Bitcoin Price Gain Slows Down: Glassnode’s Fair Value Models Puts The Crypto At $36,000

Bitcoin seems to be undergoing a period of consolidation and profit-taking after eight weeks of phenomenal price growth. The world’s largest crypto has had incredible growth this year, with a special surge starting in the middle of October. 

However, after hitting a yearly high of $44,500 on December 8, the price of Bitcoin has pulled back about 6% as some investors look to be taking profits. According to on-chain data provider Glassnode, several of its on-chain pricing models suggest Bitcoin’s fair value is currently between $30,000 and $36,000.

Bitcoin’s Price Rally Pauses As After A Resistance At $44,500

Bitcoin’s price appreciation this year led to a 150% gain which pushed it above $44,500, but on-chain data shows the hot streak has cooled off a bit after forming a resistance at this price level. 

This has led to many short-term investors taking profit from their holdings. According to data from Whale Alerts, there have also been various instances of large BTC transactions into crypto exchanges in the past few days, suggesting some whale addresses might also be participating in the selloff.

A short-term correction was inevitable, according to crypto data firm Glassnode’s fair value models. Their analysis based on the investor cost basis and network throughput suggests the fair price is lagging behind the current market spike.

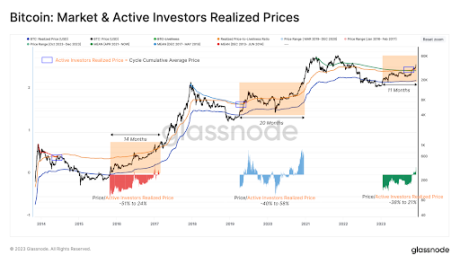
A metric cited was the Active Investor Realized Price, which monitors the degree of HODLing across the network. According to this model, Bitcoin’s spot prices are currently trading above its realized price (fair value). 

Taking a look at historical trends shows it has taken between 14 to 20 months between the realized price and the creation of an all-time high. The path to the creation of a new ATH has also always involved major spot price fluctuations of ±50% around the Active Investors Realized Price.

Bitcoin

The crypto asset is now 11 months into the break, with spot prices fluctuating between -38% and 21% of the realized price. If history repeats itself, we could see another few months of movements around the current fair value of $36,000. 

This price point correlates with a social media post by crypto analyst Ali Martinez. While noting IntoTheBlock data, the analyst noted strong support between $37,150 and $38,360, backed by 1.52 million addresses holding 534,000 BTC.

Bitcoin price chart from Tradingview.com

Another technical pricing model cited by Glassnode was the Mayer Multiple. The Mayer Multiple indicator is now at a value of 1.47, close to the 1.5 level which often forms a level of resistance in prior bull cycles. 

Glassnode’s report also looked at various other pricing models, including the NVT Premium indicator which evaluates the utility of the network throughput in terms of a USD value. According to the NVT Premium, the recent rally is one of the biggest spikes since Bitcoin’s all-time high in November 2021, suggesting an overvaluation in relation to the network throughput.

What’s Next For Bitcoin?

Bitcoin is trading at $40,963 at the time of writing. Although the crypto is now down by 6% in a 7-day timeframe, it is still monitoring gains of 8.5% from its December open of $37,731. The $44,500 level is now a crucial level for the asset, as the industry continues to wait for a bullish run after the approval of spot Bitcoin ETFs in the US. 

The crypto market is still in bullish sentiment, with Coinmarket’s Fear & Greed Index pointing to a 73 greed. A power through $44,500 would signal the resumption of the bullish trend for Bitcoin. Another resistance level to watch after the break would be the $46,400 level.

Bitcoin Spot ETF Will Bring $70 Billion In New Money To Trigger Price Rally – Glassnode

Blockchain analytics firm Glassnode has estimated a substantial influx of investor demand following the approval of Bitcoin Spot ETF. The analysis indicates around $70 billion in new money flowing into Bitcoin, potentially setting the stage for a BTC price rally. 

Bitcoin Spot ETF Set To Ignite New Inflows

Blockchain data and intelligence provider, Glassnode has recently published research insights on the potential impacts of Bitcoin Spot ETF approvals on the price of Bitcoin and the broader crypto market. The on-chain analytics company has predicted about $70.5 billion flowing into Bitcoin from increased demand from institutional investors. 

Glassnode bases its analysis on the assumption that substantial portions of capital invested in the stocks, bonds, and gold market might shift toward Bitcoin investments. The blockchain analytics firm has stated that this influx of new capital could have a huge effect on the Bitcoin market, potentially driving its price to greater levels. 

“Based on these assumptions, we estimate approximately $60.6 billion could flow into Bitcoin from the combined stock and bond ETFs, and about $9.9 billion from the gold market, totaling around $70.5 billion in potential new capital influx,” Glassnode stated. 

It added:

“This significant infusion of new capital could have a considerable impact on Bitcoin’s market, potentially driving up its price as it gains broader acceptance and becomes integrated into more traditional investment portfolios.”

Bitcoin Futures And Altcoins Soar On BTC ETF Hype 

Glassnode has extended its analysis to examine how Spot Bitcoin ETF applications are influencing Chicago Mercantile Exchange (CME) Bitcoin futures and various altcoins. 

The blockchain analytics firm has stated that the recent crypto market recovery has been driven by the surrounding anticipation of Spot Bitcoin ETF potential approval by the United States Securities and Exchange Commission (SEC). 

“The market’s upward trajectory was largely driven by the anticipation of Spot BTC ETF approvals, with market movements significantly influenced by updates on filings from major financial entities like Invesco and BlackRock,” Glassnode stated. 

The on-chain analysis firm revealed that the growing optimism in Spot Bitcoin ETFs has caused a notable increase in Bitcoin futures on CME. According to the blockchain intelligence provider, CME Bitcoin futures rose to an all-time high of 27.8%, exceeding Binance for the first time since the start of the crypto bear market. 

Various other altcoins like Ethereum and Solana also experienced staggering price increases. Solana surged by 79.05%, and Ethereum’s price is presently above the $2000 mark. 

The most notable increase caused by the ongoing hype on Spot Bitcoin ETFs was seen in Bitcoin. BTC surged above $37,000 as the optimism of regulator approvals for the first Spot Bitcoin ETF spread. 

Additionally, institutional engagement in open interest in Bitcoin call options also rose by $4.3 billion, marking an 80% increase to surpass $9.7 billion. These recent spikes in investor demand and crypto prices have signaled a potential bullish trajectory for the maturing crypto market. 

Featured image from Pexels

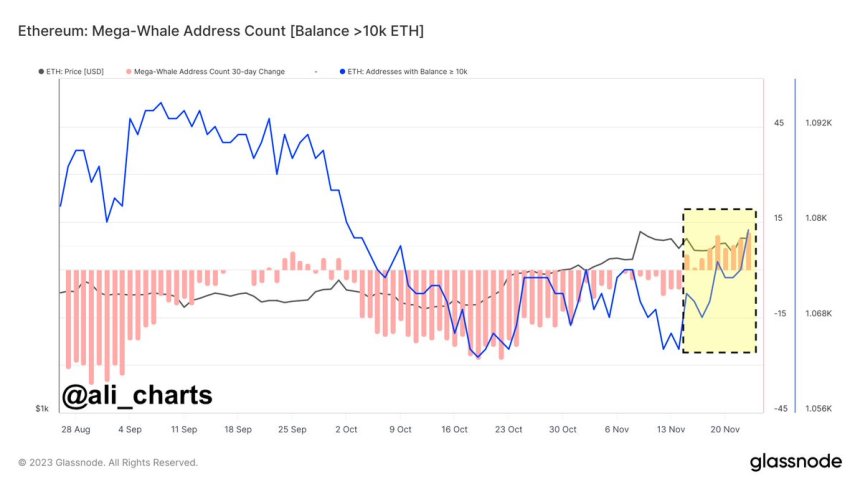
Ethereum Whales Go On 9-Day Accumulation Spree: ETH Price Rally Incoming?

The price of Ethereum has been on a steady and monumental rise in the past few weeks, and the last seven days have not been much different. The altcoin breached the $2,100 mark on Friday, November 24, with its sights now set on new yearly highs.

Interestingly, a recent on-chain revelation has shown what could be behind the latest ETH price surge while offering insights into the future prospects of the cryptocurrency.

On-Chain Data Shows Whales Continue To Buy ETH

Renowned crypto analyst Ali Martinez, in a post on X, revealed that Ethereum whales have been active in the crypto market over the past few days. According to on-chain data from Glassnode, ETH whales have been accumulating the altcoin for nine consecutive days.

Ethereum

Notably, Martinez highlighted that this is the first 9-day accumulation spree in over nine months. Furthermore, the crypto analyst noted that “the increasing buying pressure could be a strong signal for ETH bullish price action.”

Changes in whale accumulation are often closely monitored in the cryptocurrency space because of how large crypto holders can influence the market dynamics. The steady buying pressure displayed by Ethereum whales over the past nine days suggests a growing optimism amongst this class of investors.

Another analyst offered a similar on-chain perspective to the growing accumulation by Ethereum whales. The crypto pundit revealed – via a post on X – that the 200 largest Ethereum wallets now hold a collective 62.76 million ETH (worth about $132.1 billion).

According to data provided by Santiment, this whale class has accumulated 30.3% more coins since November 21, 2022. Additionally, these 200 largest Ethereum addresses hold about 52% of Ether’s circulating supply. 

Ethereum Price – Where Next?

While Ethereum’s price broke above the $2,100 mark on Friday, it has since retraced below the price level. However, there is much optimism around a continuous upward movement for ETH, especially as it still trades above the significant $2,044 resistance zone.

Many investors might want to keep an eye on the cryptocurrency’s price action by the end of the week, though. According to an analyst, a close above $2,130 on the weekly timeframe will be pivotal for Ethereum’s price trajectory.

As of this writing, ETH is currently valued at $2,086, reflecting a negligible 0.2% in the past 24 hours. Nevertheless, the cryptocurrency has managed to maintain most of its gain on the weekly timeframe, having swelled by more than 8% in the last seven days.