Bitcoin experienced a tumultuous day yesterday, with its price briefly touching $53,000 before plummeting to a low of $50,820. Amid this price volatility, an unexpected phenomenon caught the eye of market analysts: a dramatic surge in trading volumes for certain Bitcoin ETFs.
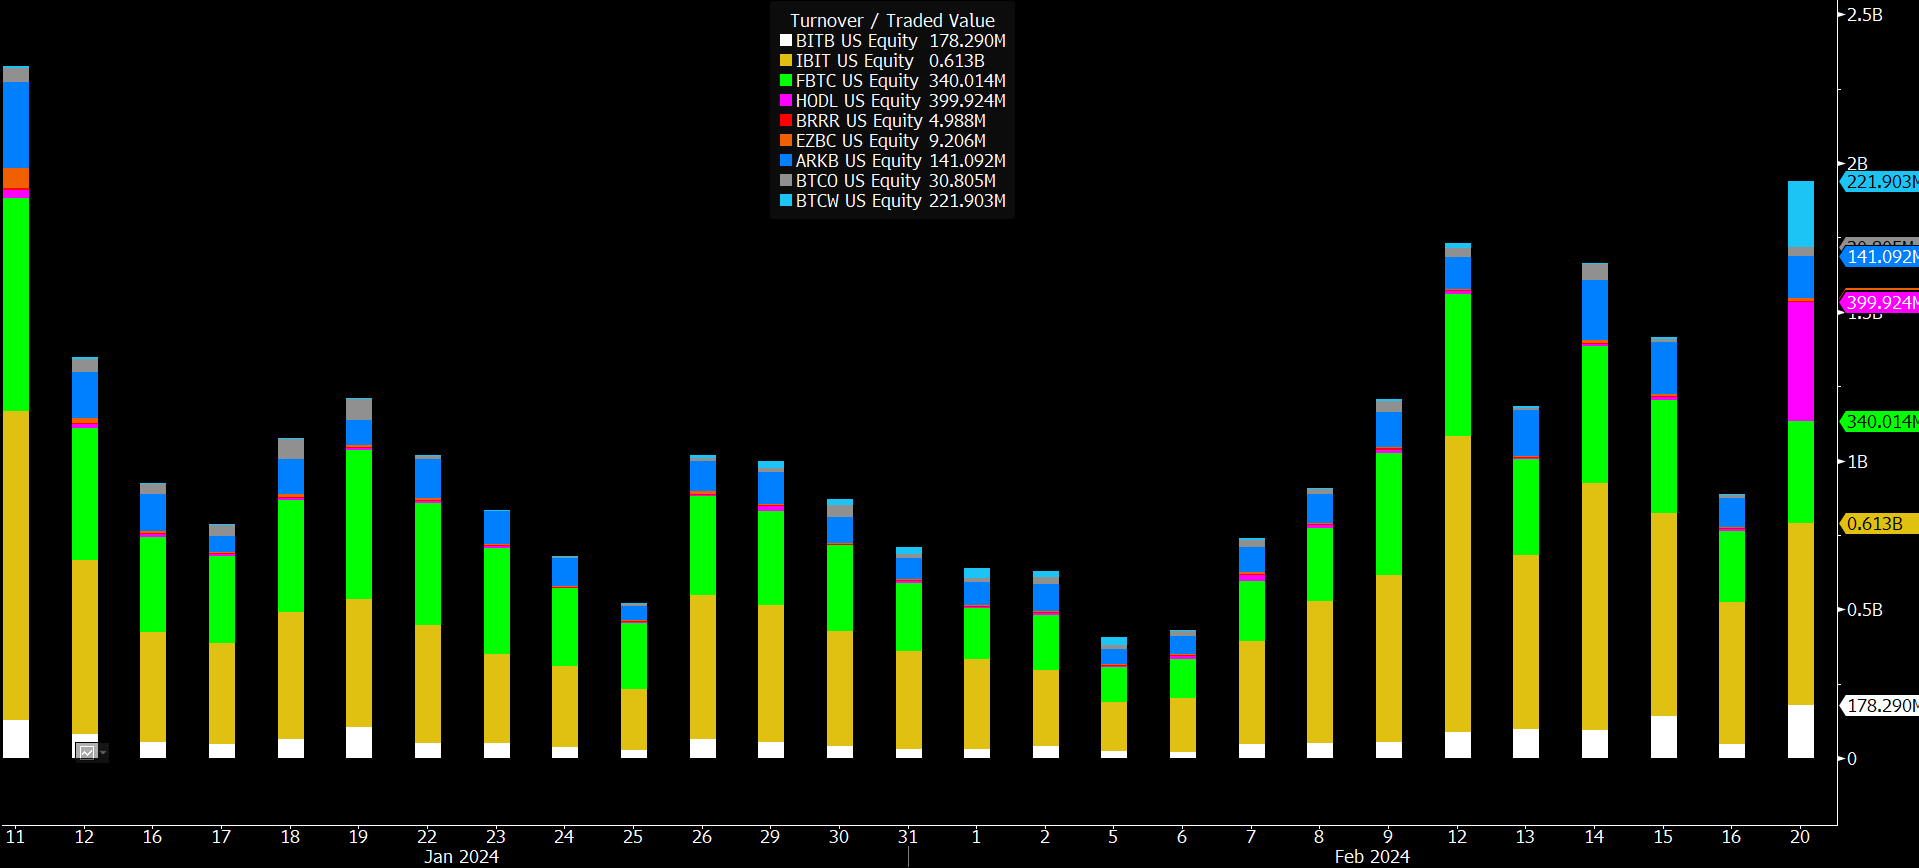
Bloomberg’s Eric Balchunas provided a detailed account of this anomaly on X, particularly focusing on the VanEck Bitcoin ETF (HODL) and its astonishing increase in trading volume. He remarked, “HODL is going wild today with $258m in volume already, a 14x jump over its daily average, and it’s not one big investor… but rather 32,000 individual trades, which is 60x its avg.”
This level of activity was not only unexpected but also unprecedented, sparking widespread speculation and analysis within the financial community. The unusual trading volume wasn’t isolated to HODL alone. Wisdom Tree’s Bitcoin ETF (BTCW) and BlackRock’s Bitcoin ETF (IBIT) also saw significant upticks in trading activity, albeit to varying degrees.
Balchunas pointed out, “BTCW also popping off, $154m trades, 12x its avg and 25x its assets via 23,000 indiv trades.” However, he noted that the volume increase in IBIT, while elevated, did not reach the “extraordinary levels” observed in HODL and BTCW.
What’s Behind The Sudden Spike In Bitcoin ETF Volumes?
Addressing theories that the ETF volume surge was driving Bitcoin’s price drop, Balchunas offered a rebuttal, “To the ‘bruh volume must be selling bc btc is dumping’ crowd: a) that makes no sense given how little these ETFs had in existing aum/shareholders b) plus you never see ton of outflows in brand new ETF that is in rally mode c) there are so many other holders of btc besides ETFs! d) how can you call it ‘dumping’ when it is down 1% after 20% rally in two weeks?”
However, the source of this sudden and explosive increase in trading volume remains a mystery, with Balchunas speculating, “Still haven’t figured out what happened. No one knows. Given how sudden and explosive the increase in number of trades was… I’m wondering if some Reddit or TikTok influencer type recommended them to their followers. Feels retail army-ish.”
He also considered the possibility of market makers trading among each other but found it an unlikely explanation given the liquidity of other Bitcoin ETFs like IBIT and BITO.
The trading day concluded with “The Nine” achieving a record-breaking volume day, thanks to significant contributions from HODL, BTCW, and BITB, which all shattered their previous records. Balchunas highlighted the significance of this trading volume, stating, “For context $2b in trading would put them in Top 10ish among ETFs and Top 20ish among stocks. It’s a lot.”
As the dust settles on this unprecedented day of trading, the Bitcoin community continues to grapple with the implications of this volume surge on Bitcoin ETFs and its potential impact on the market. The exact catalyst behind this phenomenon remains elusive, with analysts and investors alike keenly awaiting further developments.
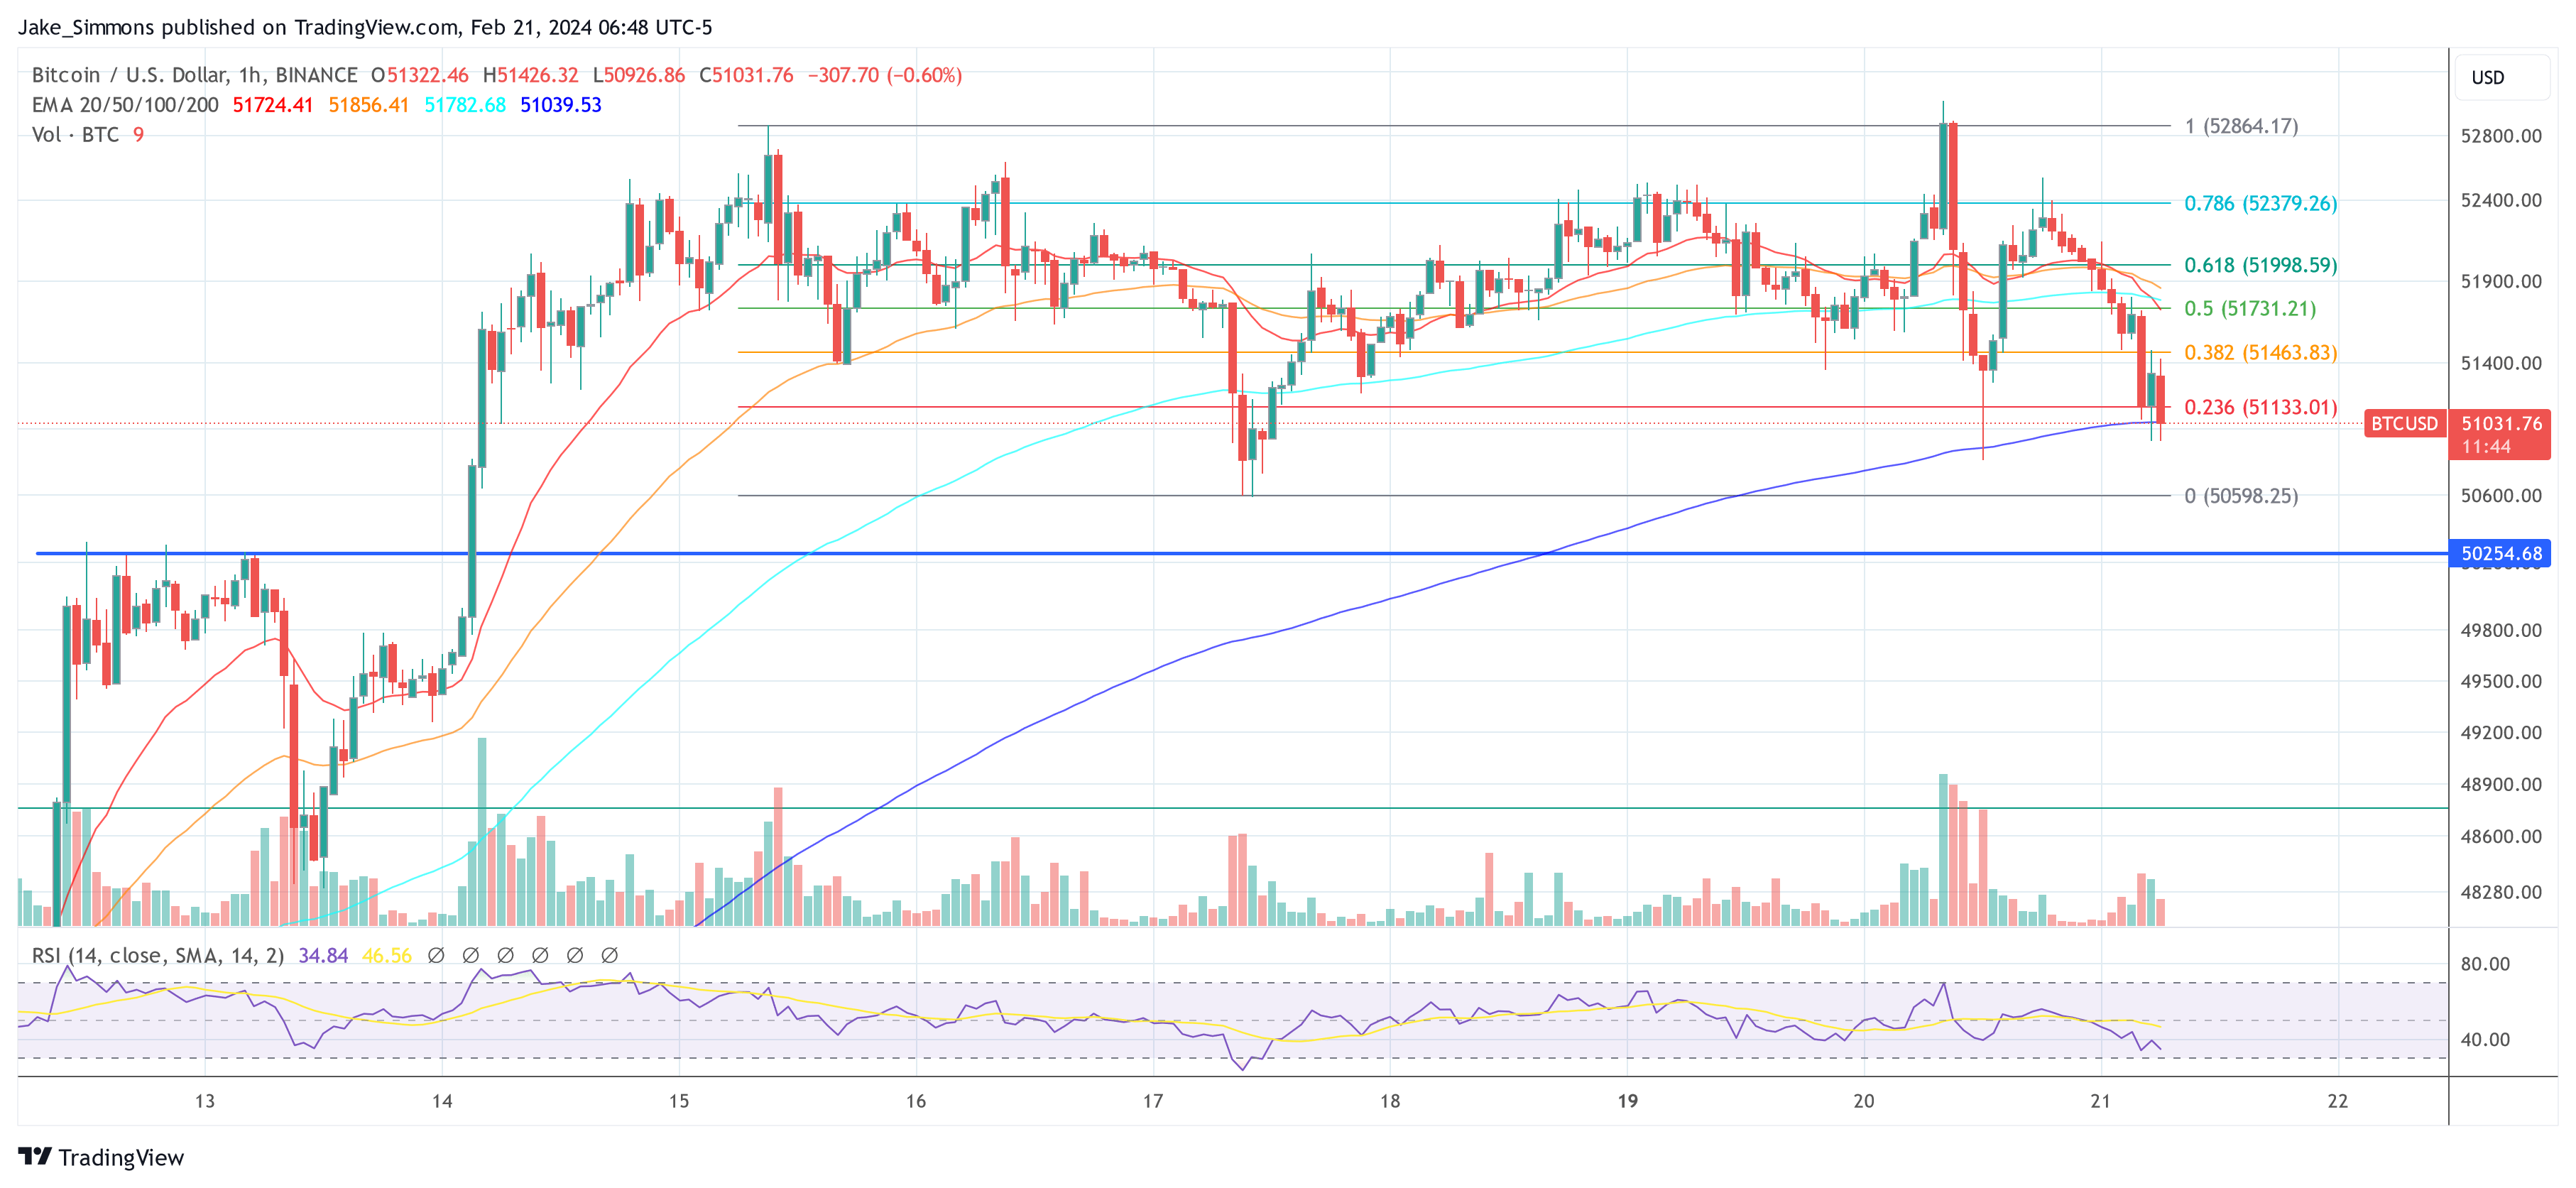
At the time of going to press, BTC fell below the $51,000 mark again and initially found support at the EMA100 on the 1-hour chart.