Avalanche (AVAX) Downtrend Persists Amid Market Uncertainty

Generally, the cryptocurrency market is bearish at the moment, with coins like Avalanche (AVAX), Ethereum, Litecoin, XRP, Solana, and others all caught in this trend. Currently, the price of AVAX is on a strong bearish move below the 100-day Moving Average (MA) and could continue in that direction for a while before retracing.

Technical Indicators Suggest A Bearish Trend For Avalanche

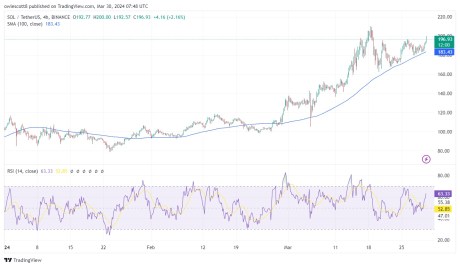
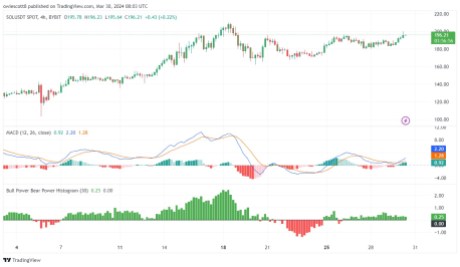
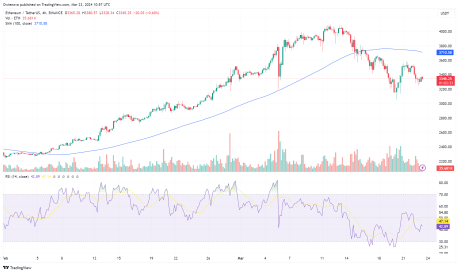
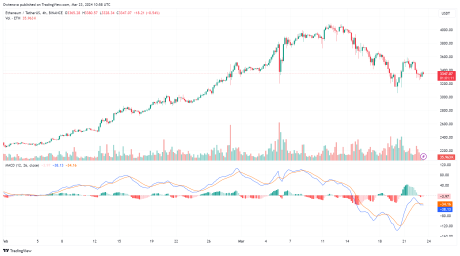
Observing the chart from the 4-hour timeframe, AVAX has crossed below both the 100-day moving average and the trend line. This could mean that the price is on a downward trend. The MACD indicator on the 4-hour timeframe suggests a very strong bearish movement as the MACD histograms are trending below the MACD zero line.

Avalanche

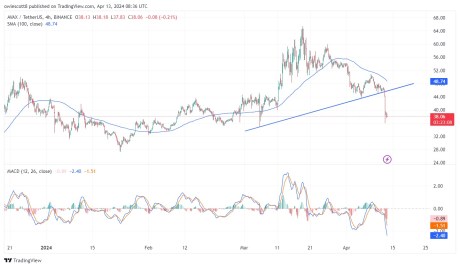
Also, both the MACD line and MACD signal line are trending below the zero line. Given the formation of the MACD indicator, it shows that there is a possibility that the price will still move further downward.

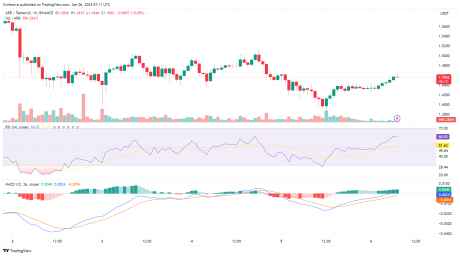
Furthermore, the Relative Strength Index (RSI) also on the 4-hour timeframe suggests a bearish trend as the RSI signal line is trending around the oversold zone. Despite the potential of a retracement at this point, the price will drop more following this.

Avalanche

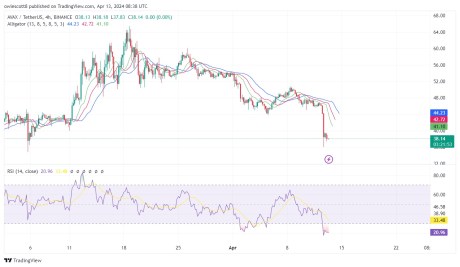
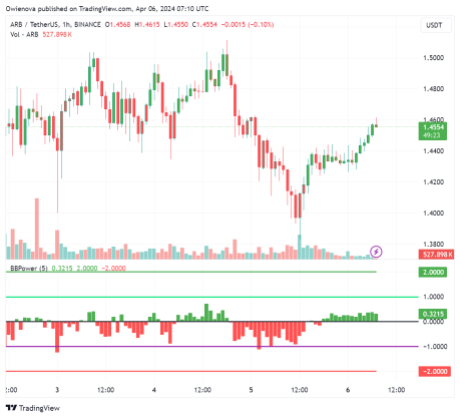
The alligator indicator is another powerful tool used to determine the trend of an asset. A look at the above image shows that both the alligator’s lip and teeth have crossed over the alligator’s jaw facing the downward direction. This formation suggests that the trend is bearish and that the price could witness a deeper decline.

What Could Happen Next

Based on the price’s previous movement, there are two major resistance levels of $50 and $59.99 and a support level of $39.95. As Avalanche is on a negative trajectory, if prices manage to break below the support level of $39.95, it could trigger a move further toward the next low of $27.53.

On the other hand, if the price fails to break below its previous low, it might start an upward correction movement toward the resistance level of $50.80. However, if it manages to break past this level, AVAX might move even further toward the $59.99 resistance level.

As of the time of writing, the Avalanche was trading around $38, indicating a decline of 1.75% in the last 24 hours. Its market cap is down by over 16%, while its trading volume has increased significantly by nearly 250% in the past day.

Avalanche

Arbitrum (ARB) Poised For Resurgence: Downtrend Reaching Climax?

Generally, the crypto market has been experiencing a pullback after Bitcoin and many other coins like Ethereum have recorded a new all-time high of which Arbitrum (ARB) was not left behind.

Arbitrum, which has a lot of potential with a market cap of over $3.8 billion and a circulating supply of 2,653,939,384 ARB has been trading below the 100-day Moving Average (MA) for some time now. However, recently the price of ARB has been showing some signs of reversing.

As of the time of writing, Arbitrum was trading around $1.45, indicating an increase of 1% in the last 24 hours. There are currently two major resistance levels of $1.799 and $2.278 ahead of the price.

Technical Indicators Show Signs Of Upward Movement In Arbitrum Price

4-hour RSI Indicator: Looking at the Relative Strength Index (RSI) indicator from the 4-hour timeframe, we can see that the RSI line is rising above the oversold zone and is heading toward the 50 level. This indicates a rise in the price, and if the RSI line rises above the 50 level, it might trigger the start of a new trend. 

The image below reveals more:

Arbitrum

4-hour MACD: looking at the formation of the MACD indicator from the 4-hour timeframe in the above image, we can also see that both the MACD line and the signal line having trended for a while below the MACD zero line have both crossed and are heading towards the MACD zero line. 

On the other hand, the MACD histogram is already trending above the MACD zero line. This suggests that a change in direction might soon happen from its downward movement to an upward movement.

1-hour bull power vs bear power histogram indicator: lastly, taking a good look at the chart from the 1-hour time frame with the help of the bull power vs bear power indicator, it shows that the histograms are already trending above the zero level. This suggests that buyers are gradually taking over the market from sellers as seen in the image below.

Arbitrum

In conclusion, if the price of Arbitrum manages to change its direction from downward to upward direction, it is possible that ARB could retest its previous major resistance levels of  $1.799 and $2.278 and even move further to create a new peak. Nonetheless, if Arbitrum fails to move upward, the crypto asset’s price might move further downward to create a new low.

Arbitrum

Solana (SOL) Continues To Soar – How High Can It Go?

The Solana network’s native cryptocurrency, SOL, has been on an upward surge in the past three days, climbing from around $180 to over $210.

Having failed to break its previous low of $162.74, the coin, which is currently ranked 5th in the crypto market with a total supply of 441 million and a market capitalization of over $88 billion, SOL is showing no signs of stopping.

Will Solana Continue To Surge Upward?

At the time of writing, Solana has been up by 6.25% trading around $198 in the past 24 hours, and has broken above the previous resistance level of $195. The price is also trading above the 100-day moving average on the 4-hour chart of the SOL/USD pair. If the price continues to move upward, it might break above its major resistance level of $210 and move even higher to create a new high for the year. 

All these can be seen in the image below:

Solana

Looking at the chart with the help of the RSI (Relative Strength Index) indicator in the image above, we can see that the RSI line is trending above the 50 level. This is an indication that the price of SOL is still in a bullish zone and could even surge further upward. 

A further look at the 4-hour timeframe chart with the help of the MACD indicator, we can see that the MACD is on the bullish side as the MACD line, the signal line, and the MACD histogram are all trending above the zero line.

Finally, using the bull vs bear power histogram indicator, it appears buyers have taken over the market with powerful momentum and are ready to push the price even higher. 

We can confirm this in the image below:

Solana
With the momentum that Solana is moving with, there is a possibility that it could break above its previous resistance level of $210.27. If this manages to happen we could see prices soaring higher especially with the level of demand momentum in the market

Could SOL Dip?

If the price of Solana fails to break above the resistance level of $210, it could start a downside correction to its initial support level of 162. If the price closes below this support level, it could decline even further and probably start a downward trend.

Solana

Ethereum Drops Below The 100-Day Moving Average – What’s Next?

The crypto market is experiencing a pullback after Bitcoin, the leading cryptocurrency, reached a new all-time high. However, Ethereum (ETH) is not left out in this downward move.

After setting a new yearly high of $4,094, the price of Ethereum has been moving downward and this has led to the price trading below the 100-day Moving Average (MA) both in the 1-hour and 4-hour timeframes, but this is not so in the daily timeframe. 

Will the price continue downward or will it change direction and start moving upward? At the time of writing, Ethereum’s price was trading around $3,360 and was up by 0.64% in the last 24 hours.

Ethereum Indicators And What They Suggest

Looking at the chart, technically we can see that a support level of $3,067 and a resistance level of $3,681 and $3,591 have been formed respectively. Nonetheless, there could be more support and resistance created if the price continues to move downward.

4-Hour Moving Average: A technical observation of the chart from the 4-hour timeframe as seen in the image below reveals that the price is trending below the 100-day moving average. This suggests that the price is on a downtrend and could potentially move further downward.

Ethereum

 4-Hour RSI indicator: With the help of the Relative Strength Index indicator (RSI) we can see the RSI signal line is trending below the 50 line. This is a strong indication that the price of Ethereum is in a downward trend as observed in the image above.

MACD Indicator: Taking a close look at the MACD indicator in the 4-hour timeframe, it appears that the MACD histogram has dropped below the zero line. In addition, both the MACD line and the signal line have crossed below the zero line. 

This setup indicates that the price is still bearish and there are possibilities that it could still move downward. The image below provides more details:

Ethereum

Possible Outcome

If the price of Ethereum continues downward and breaks below the support level of $3,067, it could move further downward to create a new support level. However, if the price fails to break below this support level, we could see a price reversal and may start a fresh trend upward. Thus there could be a possibility that the price could break above the resistance levels of $3,681 and $3,591 respectively, and continue its bullish run.

XRP Poised for Growth: Analyst Forecast Bullish Movement Ahead

XRP witnessed an uptick this week moving closer to its 2024 high, but several trends have been cited by crypto analysts that could drive the token even higher in the coming months.

XRP Poised For A Positive Upward Trajectory

Crypto Egrag, a well-known cryptocurrency expert and trader, has shared his latest insights on the price action of XRP with the community on the social media platform X (formerly Twitter).

His analysis came in light of the general correction witnessed in the crypto market a few days back. Egrag’s latest predictions delve into XRP’s potential to reach a new all-time high in the upcoming months or bull cycle.

According to the analyst, XRP is presently demonstrating momentum to surpass a bullish cross in the short term. He anticipates this to happen within the year, putting his target around April and August.

Crypto Egrag has pointed out two historical instances which he dubbed Cycle 1 and 2 that suggest XRP could reach an unprecedented within the aforementioned timeframe.

XRP

While drawing parallels to these historical trends, Egrag noted that the first cycle, which sent XRP to its peak, took around 280 days to reach the level after making a bullish cross. Meanwhile, the second cycle took XRP about 140 days to reach the same price level after forming the cross.

Consequently, the expert is extending his analysis to a comparable timeframe and duration from these data points. Thus, he has identified precisely the dates between April 8 and August 26 in which his forecast could be realized.

Hitherto, Egrag has urged the crypto community to remain unwavering and keep a watchful eye on these two dates, marking a significant day for the crypto asset.

Egrag’s X post was part of a previous analysis he made in August last year. In the post, the expert noted that the asset has formed a bullish cross, which usually ignites its price.

However, Egrag believes that one does not have to be a Technical Analyst (TA) to identify this action. Specifically, the bullish cross was formed by the “constant struggle” of the 21 weekly Exponential Moving Average (EMA) and the 100 Moving Average (MA).

Projected Time For The Token To Reach The $0.9 Threshold

Dark Defender, another crypto analyst, has pinpointed a timeframe for XRP to reach the $0.9 price mark. According to Dark Defender, the token arrived at several support levels and began to form a third (3rd) wave.

The wave was formed as a result of the altcoin reaching the mid-level Orange Resistance. Defender anticipates the coin to range between $0.7707 and $0.9191 between March 10 and 13 this year. 

Furthermore, he has predicted a price target of $0.6462 by March 1. Nonetheless, taking into account XRP’s wary advances in recent times, Defender’s forecast seems to be very lofty. 

XRP

XRP Price’s 7,000% Pump: Analyst Foresees Massive Move If This Happens

XRP may not have had the best start to 2024, but several cryptocurrency analysts and enthusiasts are still bullish about the crypto asset, predicting a possible price surge to new highs heights.

Popular cryptocurrency analyst Egrag Crypto has made a daring prediction for XRP, suggesting a rise to a new peak. Egrag Crypto’s forecast delves into the token’s potential to reach the $2 price mark and way beyond.

XRP Poised To Skyrocket To A New All-Time High

In his projections shared on the X platform, the analyst noted that XRP is presently caught between the two moving average indicators, the 21-exponential Moving Average (EMA) and the 55-moving Average (MA).

As a result, Egrag crypto has predicted a potential 7000% price rally if XRP breaks out of the moving averages. However, the expert believes the rally will occur when XRP’s price reaches $2.2.

XRP

If such a rise occurs during the aforementioned price level, it will increase to about $139, according to Egrag. His forecasts are supported by historical data, which he uses to highlight a similar trend in the 2017 bull run.

It is noteworthy that before the 2017 bull run, XRP was similarly hedged between the 21 EMA and the 55 MA. On the other hand, XRP initially saw a price spike to $0.0302 following a breakout, and then it soared by 7,000% to the $2 mark. 

The analyst has underscored that about 99% of people might not comprehend his projections now. Nonetheless, when utility starts to take off, it might just be the start of a multi-decade trend.

Even though a breakout from the 21 EMA and 55 MA presents a possible rally, there is also a risk for a potential decline. According to Egrag Crypto, this position could lead to a decline to around $0.45.

He further claimed that XRP closing above $0.60 would be crucial, pushing the asset above the 21 EMA. Additionally, it will rise above the level of local resistance in a “candle style.”

Several Factors Of The Mega Move 

Following the prediction, Egrag has pointed out multiple aspects that set his predictions aside. “This could be the prelude to a mega move, a breakout that occurs once in a lifetime,” he stated.

The first aspect highlighted by the analyst is that if the rally takes place, XRP would conclude “the W Formation.” After that, it could “finalize the ascending triangle formation.”

Meanwhile, for the last aspect, he noted that “it could trigger a 500% rise” from the current price of XRP. This might potentially start a big price surge from higher levels. So far, Egrag has urged the crypto community not to be misled by his chart, as his forecast could be a life-changing opportunity.

XRP