Brandt’s latest view is based on a statistics concept called “exponential decay.”
Is Bitcoin Headed For A Crash? Analysts Cite Possible Downtrend
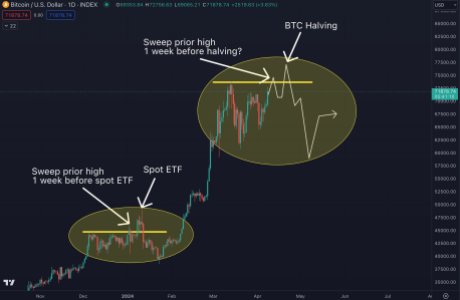
Investors in the cryptocurrency space are eagerly awaiting the halving of Bitcoin in order to fuel future market growth. However, top cryptocurrency expert and trader Benjamin Cowen cautions that if the price of BTC follows a previous pattern, there may be a correction.
Bitcoin Halving Could Impact Price Negatively
Cowen has highlighted a trend that could potentially lead to a significant decline in the crypto asset’s price when the Bitcoin halving event commences, which suggests that BTC could be poised for a decline in the coming days.
According to Cowen, should Bitcoin continue to follow the same trajectory as it entered the spot ETF during the halving, BTC may witness a trend toward the downside. The crypto expert advocates that these patterns typically do not repeat precisely. However, he believes putting the idea out there is crucial in case it happens again in a similar manner.
In response, a pseudonymous user commented on Cowen’s post and reminded the expert that he forgot the arrow backup. Responding to the user, Cowen stated that he believes the outcome of the next phase will depend on whether or not ALT/BTC pairs have collapsed by then.
Furthermore, he affirms there could be a move on the upside if they have not broken down. Meanwhile, in the event that they have broken down, the pattern can transit to something new.
It is worth noting that the Bitcoin halving event is forecasted to take place within the next 11 days. Given Bitcoin’s halving previous significant impact on price, BTC could be positioned for a notable price surge in the coming days. However, if Cowen’s recent prediction manifests, it could paint a different picture for the crypto asset during the halving event.
The expert’s prediction has sent quite a frenzy in the crypto community, with analysts like Peter Brandt supporting his insights. Peter Brandt acknowledged Cowen’s projections noting that previous Bitcoin bull markets have exhibited a similar fundamental trend.
What To Expect During The Halving Event
As the halving event approaches, the cryptocurrency data analytics platform Kaiko has laid out a perspective to watch out for. Kaiko’s perspective delves into the impact the halving has had on BTC’s price in the short term over the years.
According to the platform, in the past, the short-term price effect of Bitcoin halvings has been inconsistent. Nonetheless, historical data reveals that the coin tends to rise 9-12 months after halving, making it a generally bullish development.
At the time of writing, Bitcoin’s price was up by 8% in the past 7 days, valued at $70,770. Its overall market cap is down by over 2%, however, while its trading volume is up by over 8% in the past day.
Bitcoin Price Soars: Analyst Sets 2025 Price Target At $200,000
Bitcoin, the largest cryptocurrency asset by market cap, suddenly took off on Monday, reaching the $57,000 price mark for the first time in the last 26 months, prompting several predictions of a new all-time high before the end of 2025.
Bitcoin Could Hit $200,000 Before 2025 Closes
Amid the recent market surge, cryptocurrency analyst and Chief Executive Officer(CEO) of Factor LLC, Peter Brandt, has expressed his optimism towards Bitcoin, while sharing an intriguing prediction with the crypto community on the social media platform X (formerly Twitter).
Peter Brandt’s analysis delves into Bitcoin’s recent price action and how high the crypto asset could go before 2025 closes. With BTC’s current bull market cycle, Brandt has set an ambitious goal of $200,000 next year.
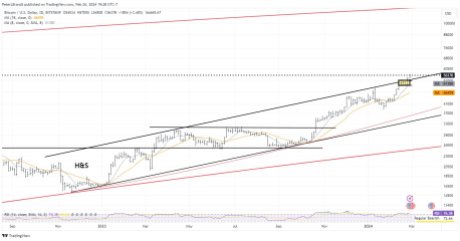
Brandt’s initial Bitcoin price target for 2025 was $120,000, but with the recent rally, he has placed his mark at the aforementioned price. His modifications came in light of BTC exhibiting a bullish trend, surpassing the “upper boundary of the 15-month channel.”
Furthermore, he highlighted that the current market bull cycle might “end in August or September 2025” if this bullish trend continues. However, according to him, this interpretation will be void if there is a Bitcoin “close below last week’s low.”
The post read:
With the thrust above the upper boundary of the 15-month channel, the target for the current bull market cycle scheduled to end in August or September 2025 is being raised from $120,000 to $200,000. A close below last week’s low will nullify this interpretation.
The analyst’s daring predictions have since caused quite a stir within the crypto space. Several community members have expressed their pleasure in the crypto expert’s analysis.
A pseudonymous X user commented on Brandt’s forecast, saying his overview shares “fascinating insights into Bitcoin’s market projection.” They asserted that “the upward momentum breaking through barriers is indeed intriguing.”
Additionally, they also believe that a close below last week’s low would change Brandt’s narrative, which will highlight the fragile balance in the cryptocurrency space.
Factors That Could Be Responsible For BTC’s Rally
BTC’s current rally is believed to be buttressed by several developments that have garnered attention in the crypto market today. These include increased demand from investors through Exchange-Traded Funds (ETFs) and additional BTC purchases by Microstrategy.
It is noteworthy that since the start of the year, investors’ demands through ETFs have served as a major support for BTC. On January 11, the United States Securities and Exchange Commission (SEC) approved 11 Bitcoin spot ETFs, which has triggered confidence ever since.
Meanwhile, Michael Saylor’s Microstrategy made an additional 3,000 BTC purchase, valued at $155 million before the uptick. This development suggests institutional interest in BTC, indicating confidence in its long-term potential.
Over the past day, the price of Bitcoin has increased by more than 9%, and it is presently trading at $56,321. Its market cap is up by 9% and its trading volume is up by over 235% in the last 24 hours.
Chart Expert Peter Brandt Raises Bitcoin’s 2025 Target to $200K on Channel Breakout
Brandt expects bitcoin’s ongoing bull market to peak at $200,000, a significant upward revision from the previous estimate of $120,000.
Brace For Impact: This Expert Trader Says Cardano (ADA) Will See A 50% Decline

Cardano (ADA) has seen its price decline significantly over the last year after hitting a new all-time high above $3. The digital asset is down more than 86% from this all-time high value to be sitting just above $0.4 at the time of this writing in what looks like the digital asset has found its bottom. However, expert trader Peter Brandt says that the worse is not yet over for the digital asset, and more decline in price should be expected.
ADA Will Decline by 50%
In true chartist fashion, analyst Peter Brandt took to Twitter to post a chart that outlined important technical levels for the digital asset. He points out that the digital asset was forming what is known as a “classic descending triangle.” Brandt outlines that this point to a possible decline for the digital asset going forward.
According to analysts, this could see the price of Cardano (ADA) actually fall below $0.25. Now, given the current price of ADA, it would mean that the digital asset’s price would have to mark another 50% decline from this point. Furthermore, it would put ADA’s price at more than 90% below its all-time high price. Not a surprising figure, as cryptocurrencies have been known to lose more value in a bear market.
The $ADAUSD chart is a classic descending triangle per Schabacker, Edwards and Magee and suggests a possible decline to sub .25. Do charts always work? — not really, but when they do it is a thing of beauty. Note — I do NOT short #8hitcoins pic.twitter.com/HP6mEbChJq
— Peter Brandt (@PeterLBrandt) October 5, 2022
Interestingly, though, Brandt added that he did not plan to short the altcoin despite this price prediction. His reasoning for this was that he did not short “shitcoins,” referring to the 8th largest cryptocurrency by market cap as a shitcoin.
ADA price trending at $0.43 | Source: ADAUSD on TradingView.com
Will Cardano Follow This Prediction?
In Peter Brandt’s analysis, he notes that following the charts does not always work but that they sometimes do. For investors, it would mean that they should prepare for the worst-case scenario in case the forecast does prove to be accurate. However, not everyone agreed with the analyst’s forecast for the digital asset.
Another Twitter user who goes by @eenmakkie took to the replies to combat Brands’s analysis. They explain that while ADA’s price going below $0.35 was a possibility, it would not be possible to drop below $0.25 unless the price of bitcoin were to break below $16,000.
This is not a farfetched prediction, given that altcoins tend to closely follow and mirror the price movements of bitcoin. If bitcoin were to drop another 10-20% and fall below its previous cycle bottom of $17,600, then the crypto market could be looking at more losses.
Nevertheless, ADA seems to have a strong hold above $0.4 at the moment despite technical indicators all pointing to bearish performance for the digital asset. But if it fails to hold the $0.42 support level, then sub-$0.35 becomes a stronger possibility.
Featured image from Cardano Feed, chart from TradingView.com
Follow Best Owie on Twitter for market insights, updates, and the occasional funny tweet…
Baby Got Back: 50-Year Veteran Trader Compares Bitcoin Bottoms
Whether it is Bitcoin or another asset, bottoms can be hard to spot until much later in hindsight. That is unless you are Peter Brandt, career commodities trader with nearly 50 years of market experience.
In a new comparison, Brandt compares the crypto bear market bottom he predicted a year in advance, with the current pattern that recently pushed Bitcoin beyond $45,000. Here is the full comparison along with why it might be worth listening to Brandt’s words of wisdom.
50-Year Trading Veteran Hints At Possible Bitcoin Bottom
In a new tweet, founder of The Factor Report Peter Brandt compares the late 2018, early 2019 bear market bottom, with the current Bitcoin price action.
Brandt specifically calls attention to the ascending triangle pattern that Bitcoin price appears to have broken out of, and its resemblance to what turned out to be the ultimate price floor.
Related Reading | This Bitcoin “Heatmap” Suggests A Blazing Cycle Peak Is Still Ahead
The classical chartist cites reference to what is considered “the real bible of technical analysis” – the book Technical Analysis and Stock Market Profits: A Course in Forecasting by Richard W. Schabacker. The expert technician even references the exact page number where more details on the pattern can be found.
In a recreation of Brandt’s chart below, the two potential Bitcoin bottoms are compared directly. In addition to the ascending triangle, there is also an Adam and Eve-like double bottom formation, and each bottom occurred along a similar trend line dating back almost a decade.
A recreation of Brandt’s comparison with another look for good measure | Source: BTCUSD on TradingView.com
Why Peter Brandt’s Crypto Comparison Holds Weight
Because of Brandt’s sometimes bold calls that go against the hive mind of crypto Twitter, the trader often gets labeled a “hater.” In reality, he regularly says Bitcoin is among the most remarkable markets he’s ever traded and was among the first to call attention to the parabola building in 2016 and 2017.
When that parabolic advance was violated in late December 2017 and early 2018, he was also the first to suggest the way down was a lot further than most were ready to accept. Brandt called for a full 80% or more retrace in the price per coin of the top cryptocurrency almost a full year before it landed at his target.
Related Reading | Peter Brandt Calls For 80%+ Bitcoin Price Decline With Chilling Accuracy
Unlike what is commonly seen throughout the crypto world, Brandt doesn’t rely on complex technical indicators, buy or sell signals, or on-chain metrics. All he uses are straight or curved lines, which often accurately represent a contained trend. When such lines are violated, a trend change often follows.
With Bitcoin breaking above the top of an ascending triangle trend line, is Brandt specifically calling attention to a trend change ahead? If so, paying closer attention to the comparison between each major crypto bottom could be critical.
Follow @TonySpilotroBTC on Twitter or join the TonyTradesBTC Telegram for exclusive daily market insights and technical analysis education. Please note: Content is educational and should not be considered investment advice.
Featured image from iStockPhoto, Charts from TradingView.com
Bitcoin to $58K next? A 2019-like ‘reversal ascending triangle’ hints at more upside for BTC

BTC price charts suggest that $52,500 should be a very challenging resistance level to flip.
Bitcoin Discount? Peter Brandt On Why You Shouldn’t Buy The Dip
Bitcoin has been dropping consistently for the past week and the crypto market has lost over $500 billion following this dip. Like with any crash, there have been the expected calls of ‘buy the dip’ from investors who believe that the dips are only temporary and that the digital asset will soon recover all of its lost value.
While this advice is sometimes sound, there is no doubt that there are some drawbacks with it, which could range from adding to a losing position that ends up losing more, to sinking more money in projects that may already be doomed to fail. Veteran trader Peter Brandt has addressed these calls of ‘buy the dip’, explaining why investors should not follow it.
Related Reading | Melania Trump Congratulates Bitcoin On 13th Anniversary Of Bitcoin Genesis Block
You Could Lose More Money
Famed trader Peter Brandt responded to a tweet from CEO of Vailshire Capital, Jeff Ross, saying that the price dips that are being experienced by bitcoin presented an opportunity for long-term traders to increase their holdings. Brandt’s tweet was vehemently against this school of thought, proposing instead “a sacred trading rule” for investors during times like these.
The veteran trader compared the current movement of bitcoin to the Silver $SI_F of 1980, which had grown to its $50 top after a massive run. It had subsequently sunk to $3.65, leading people to purchase it in the hopes of catching the dip, but the asset ended staying low for more than two decades.
I remember in 1980 people saying the same thing about Silver $SI_F after it topped at $50
It then sank to a low of $3.65 and did not start back up for 24 years
Not saying $BTC is the same, but a sacred trading rule I have used is never add to a losing trade
— Peter Brandt (@PeterLBrandt) January 7, 2022
Basically, the investor urged investors to not rush to purchase bitcoin because it is low and they think it will not go lower.
BTC continues downward trend | Source: BTCUSD on TradingView.com
Comparing Gold And Bitcoin
In a subsequent tweet, Brandt did a similar comparison to the price of bitcoin. This time around, he focused his attention on gold, calling out the fact that just like silver in the 1980s, gold experienced a similar trend.
He explained that gold had first hit its all-time high of $873 in 1980, followed by a drop in price to $255. The asset which had been the inflation hedge of choice for many decades had remained in this territory for almost three decades following this and would only beat this previous all-time high 27 years later.
Related Reading | TA: Bitcoin Key Indicators Suggest A Strengthening Case For More Downsides
Brandt admonished the author of the previous tweet by asking, “Is this your definition of a ‘long-term’ investor?”
Naturally, Brandt’s comment regarding bitcoin had drawn the ire of bitcoin maximalists who flocked to explain to the older trader why the digital asset would not follow the footsteps of gold and silver.
One user tweeted that “Difference is btc is technology, not a rock”, while another pointed out that bitcoin had more utility, saying, “Gold has been a disastrous investment. Not much utility in it. Hard to carry your gold with you in the event of political system or economic collapse. Hence #Bitcoin.”
Featured image from Blogtienao, chart from TradingView.com
Don’t expect retail sell-off to crash Bitcoin price — analyst

High-volume candles associated with Bitcoin price dips already occurred on derivatives exchanges this time round, Willy Woo notes.
Don’t get bearish Bitcoin just yet, says veteran trader who called 2018 crash

Bitcoin faces trying times, but the outcome of this week’s BTC price action could be bullish or “exhaustingly” sideways, says Peter Brandt.
Peter Brandt Says Tether Is One Big Mind Fart, Here’s Why
With over half a million followers on Twitter, Peter Brandt is a well known career trader who often tweets valuable insights about the markets. In a recent tweet, Peter took a stance on Tether calling it a useless mind fart.
Choice Words From Iconic Trader Peter Brandt
According to Peter, the concept of converting a traditional fiat currency such as the dollar or the euro into a digital fiat unit such as Tether, just in order to protect its store of wealth against inflation, is a meaningless process as it serves no purpose.
Circular reasoning – TETHER
The idea that we convert one fiat currency unit (USD, EUR, et al) into another fiat currency unit (tether) so as to protect the store of wealth of the first fiat currency unit is nothing but a gigantic mind fart.
— Peter Brandt (@PeterLBrandt) August 16, 2021
Though there are many who agree with Peter’s tweet, a few have valid arguments against it. One user argues that stable crypto assets exist to allow people to take their local currency digital in a somewhat trustless way. The trust is at the issuer level instead of having to worry about that risk at every digital platform one might use.
Related Reading | Peter Brandt: 99% of Altcoins Will Be Forgotten in Five Years
Another Twitter user argues that no one really converts traditional fiat into stablecoin to protect their store of wealth, that Tether and other stables are just a nonvolatile bridge asset between trades of more volatile ones, without having to leave the crypto realm.
Meanwhile, Tether continues to dominate the crypto market as its leading stablecoin. Just yesterday the market cap of Tether has grown to $64B marking a new milestone and another indication of the market’s continued trust and confidence in Tether.
With ever-increasing adoption of crypto, the demand for stablecoins such as Tether has been on the rise and is expected to grow further. At the time of writing, the marketcap of Tether sits at $62.6B. Source: Marketcap USDT Tradingview.com
Tether Announces Further Details Into Its Reserves
On August 9, Tether Holdings Limited, the issuer of the largest stablecoin USDT has released a new attestation report that covers useful insight on the composition of its reserves in a bid of be more transparent.
Ever since March when the company released its first attestation report vaguely revealing assets and liabilities, investors have been patiently waiting for a second report. In the latest attestation report, Tether has not only included the composition of its reserves, but also given a breakdown of the ratings and maturity of its commercial paper holdings along with the certificates of deposit.
Related Reading | Brandt: You’re Doing it Wrong if You Accumulate Dollars Over Bitcoin
As on June 30, 2021, the company holds $30.8B in CP and CDs which is about 49% of its reserves. Around 93% of this is rated A-2 and above and 1.5% iis rated below A-3. Among other reserves, the company holds around $6.28B in cash and bank deposits, $1B in reverse repo notes and $15.28B in U.S Treasury bills.
Featured image from iStockPhoto, Charts from TradingView.com
Cardano price is hot, but data shows pro investors haven’t warmed up yet

ADA has gained 57% in the past 3 weeks but derivatives data shows pro investors aren’t bullish yet.
Cardano risks 60%-90% drop, warns trader with ADA painting a classic bearish pattern

Spotted by veteran analyst Peter Brandt, the classic technical pattern can result in ADA price losing almost 90%.
XRP price will fall to new lows vs. Bitcoin if this famous chart pattern plays out

XRP price bulls watch out! The popular Head and Shoulder pattern is statistically among the most accurate trend indicators.
Veteran trader Peter Brandt sees Bitcoin crashing further after May’s 50% drop

Peter Brandt, a veteran financial analyst and trader, is questioning whether Bitcoin has more upside in the near term.
Powerful Bottom Signal Spotted In XRP, But There’s A Catch
XRP price is back trading at right around a dollar per token, but according to a rare bottoming pattern spotted by a legendary technical trader on the Bitcoin trading pair, the surge is only just getting started.
However, there’s a catch. When it comes to this particular chart pattern and crypto – the same trader has gotten it very wrong before. Is this time different, or will this “powerful” bottom signal confirm?
XRP Begins Long Painful Road To Recovery After SEC Storm
Ripple and company executives are still locked in a legal battle with the SEC, but just this week had a major victory in the court requiring the release of documents that offer insight into the entity’s findings on other cryptocurrencies: Bitcoin and Ethereum.
Related Reading | XRP Targets New All-Time Highs After Surviving SEC Slaughter
Before the news even broke, XRP pumped to more than $1 per token for the first time since 2018 on the USD trading pair. On the Bitcoin trading pair, however, things have only just started to turn around from extreme bear market lows.

According to the iconic trader, there's a compound fulcrum bottom forming against Bitcoin | Source: XRPBTC on TradingView.com
A bottoming pattern taking place across the entire first quartern of 2021, according to iconic career trader Peter Brandt, is “called a compound fulcrum and can be quite a powerful buy signal.”
If he’s right, XRP will soon outperform Bitcoin by a sizable margin. But he’s been wrong before about such a pattern.
Beware: Brandt Has Been Both Wrong And Right About Bitcoin
Brandt, who is a classical chartist with decades of real world market experience, has seen several rare patterns to both confirm and fail. He’s among the few traders to have discovered the rare pattern, and he’s also among the first to identify each Bitcoin parabola forming. In the past, he’s even accurately called the bottom range on Bitcoin’s bear market, a whole year in advance.
But for all his correct calls, Brandt is still human, and gets things wrong. The last time he made the call for a compound fulcrum was back in 2018.

But the last time he spotted such a signal, it was dead wrong | Source: BTCUSD on TradingView.com
Back then, Bitcoin was trying to hold onto support around $6,000, before taking the ultimate plunge to the bear market bottom – a zone which Brandt himself also ironically called for.
Related Reading | Peter Brandt Calls For 80%+ Bitcoin Price Decline Over A Year Ago With Chilling Accuracy
Whether Brandt was trolling the last time around, or simply incorrect, is not clear. He’s the first to admit that patterns do indeed fail, but when they don’t and behave as they’re expected to, “it’s a thing of beauty.”
Whether or not Brandt will be wrong again, and XRP drops even further against BTC on the ratio remains to be seen.
Featured image from Deposit Photos, Charts from TradingView.com
Career Commodities Trader Warns Bitcoin Community Over Coinbase Concerns
Peter Brandt is an iconic trader who in the past called the dramatic fall to the Bitcoin bear market bottom, nearly a year ahead of time. Could the commodities trader with decades of experience in all things markets – who has for sure seen a thing or two in his career – now be forewarning of an alleged collapse of the popular cryptocurrency exchange Coinbase?
His tweets appear to imply so, calling into question several mounting concerns related to the company. Here’s what’s going on regarding the bold claims made by Brandt, and what Coinbase could allegedly be hiding.
Career Trader Makes Bold Calls, Accurately Predicts Bitcoin Bottom One Year Out
Words can carry a lot of weight. They come with even more significance depending on the mouth they’ve come from, and depending on that person’s experience or clout.
When it comes to pure classical technical analysis, few would argue that Peter Brandt is among the best of the best living today. He’s got nearly 50 years trading and speculating under his belt, and he’s charted everything from corn to manure, to of course, Bitcoin.
Related Reading | Peter Brandt Calls For 80%+ Bitcoin Price Decline Over A Year Ago With Chilling Accuracy
Brandt has been a public supporter of the leading cryptocurrency by market cap, but has also been labeled a “hater” due to his sometimes painful calls that bring exuberant investors back to reality – something they tend not to like.
Brandt was labeled as such after calling for a drop to under $4,000 in January 2018, nearly a full year before the cryptocurrency reached such a bottom of the bear market.
His experience allows him to see things that others cannot, but are his latest claims over Coinbase issues accurate?

Brandt's calls have had wizard level accuracy in the past due to his experience | Source: BTCUSD on TradingView.com
Peter Brandt Slams Crypto Exchange Coinbase Over Concerns, “Signs Of Trouble Ahead”
Peter Brandt went on a tirade on Twitter recently, blasting popular cryptocurrency exchange Coinbase and its CEO Brian Armstrong with a string of currently unsubstantiated claims.
Brandt warns that during his time in markets, he’s witnessed three major brokers go under, and that each presented the same clues ahead of time that Coinbase currently is.
After listing several “signs of trouble ahead” Brandt tagged the SEC and FINRA Twitter handles asking for a deeper dive into the company ahead of any IPO.
Related Reading | Massive Coinbase Outflows Suggest Bitcoin Price Is Ready To Bounce
Brandt’s lash out was eventually tempered, instead leaving behind tweets with a more “wait and see” tone. He admits he’s got no insider knowledge of such a situation existing – just a strong opinion he says gets even stronger when his experience with past brokers provides all the conviction needed.
Coinbase has only had a clear track record thus far, and while it has been subject to controversy surrounding fees or even unscheduled downtime, there’s never been any evidence of any wrongdoing. Brandt’s foresight has been accurate in the past – is he once again seeing something the rest of the market can’t?
Featured image from Deposit Photos, Charts from TradingView.com


