Bullish On Polkadot: Analyst Sees DOT Hitting $15 Soon

Polkadot (DOT), the interoperable blockchain platform designed for connecting different blockchains, is currently caught in a tug-of-war between technical indicators suggesting a potential price dip and bullish predictions from some analysts.

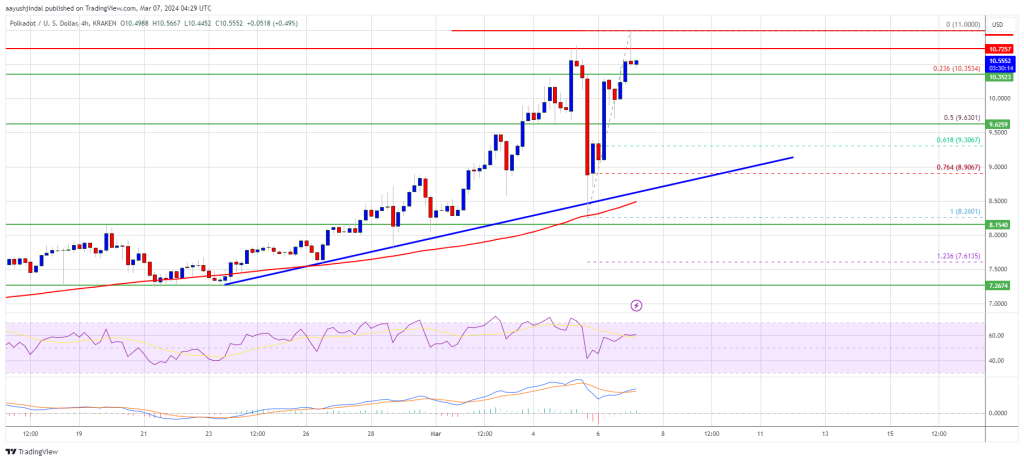
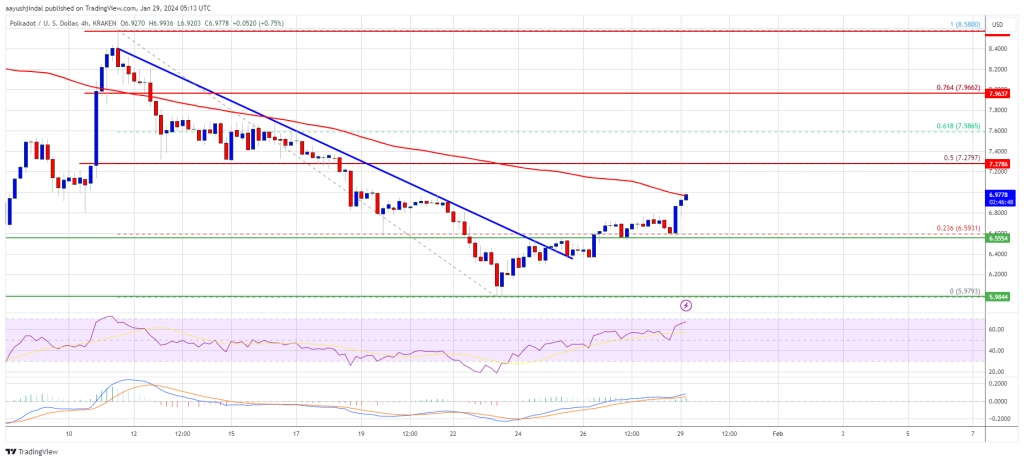
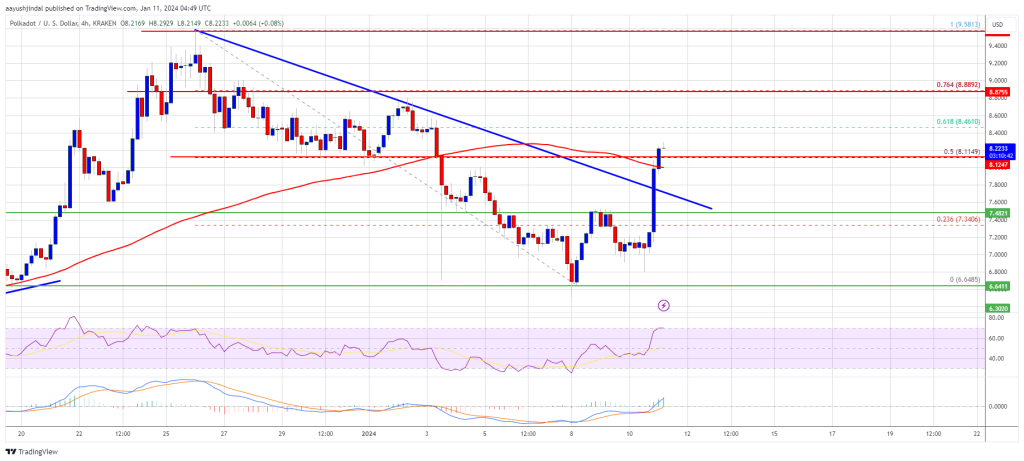
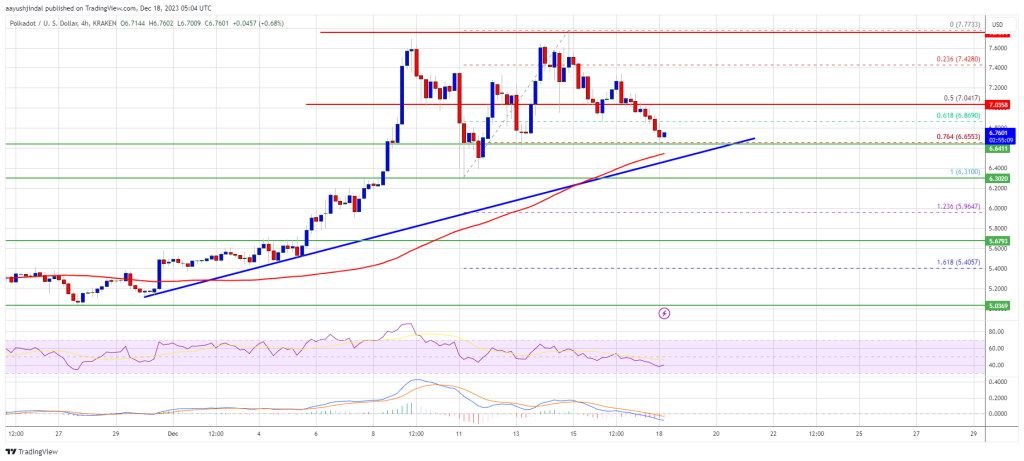
Recent price movements paint a somewhat gloomy picture. DOT breached the lower boundary of its ascending trend channel, a technical indicator often interpreted as a sign of weakening momentum.

Trading volume also leans bearish, with sellers dominating the market and putting downward pressure on the price. Support seems to be holding around $6.30, but resistance sits stubbornly at $9.40, hindering any upward movement.

Polkadot Consolidation Or Correction?

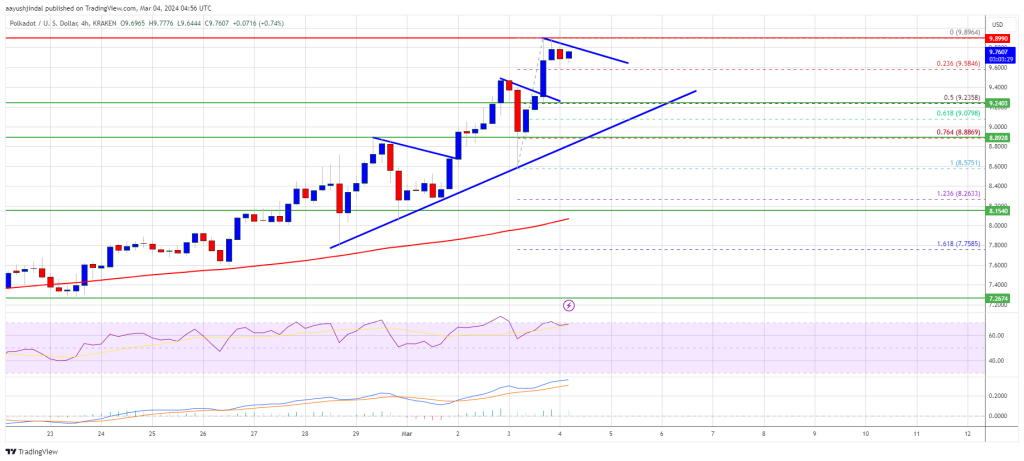
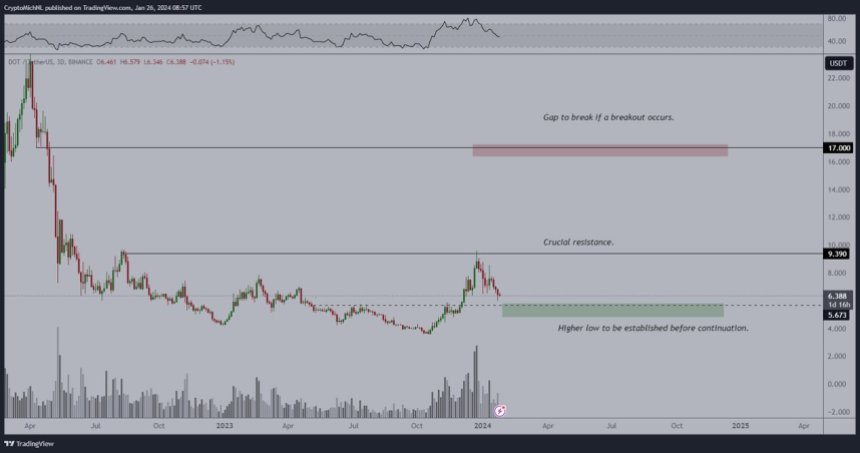
However, not everyone is ready to count DOT out. Proponents point to a bullish flag pattern, suggesting a consolidation phase. This consolidation, they argue, is a healthy pause after recent fluctuations and allows for accumulation before the next significant price move.

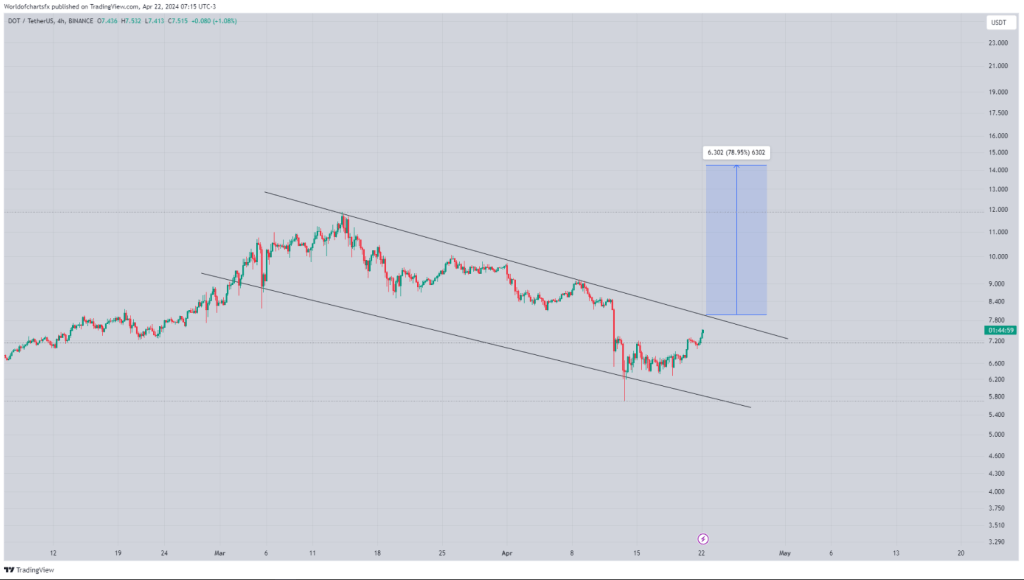
This interpretation finds support from prominent crypto analysts like World of Charts. They believe the current price action is a bullish flag, a technical pattern often seen as a precursor to a breakout. Should this breakout occur, they predict a surge in value, with DOT potentially reaching $15 in the coming weeks.

Uncertain Future For Polkadot?

The conflicting technical signals make Polkadot’s future trajectory difficult to predict. The short-term outlook appears shaky, with potential for a price dip in the coming days or weeks.

However, the long-term picture remains more optimistic. Polkadot’s core technology offers a compelling solution for blockchain interoperability, a major hurdle in the crypto industry. If the project continues to develop and gain traction, a significant price increase in the future remains a possibility.

While the potential for a $15 price tag in the coming weeks is enticing, the current technical indicators suggest caution. Ultimately, the price of Polkadot, like all cryptocurrencies, remains highly volatile and susceptible to unforeseen events. The coming weeks will be crucial in determining whether the bulls or the bears will prevail in this ongoing battle.

Polkadot JAM Protocol: Integrating Ethereum Smart Contracts, Boosting DOT’s Potential

In another development, Polkadot has been at the forefront of blockchain innovation, drawing significant attention from industry stakeholders with recent developments and promising future prospects. A notable milestone is the unveiling of the Join-Accumulate Machine (JAM) Gray Paper, representing a fusion of Polkadot and Ethereum protocols.

This protocol, as explained by the team, aims to establish a global singleton permissionless object environment akin to Ethereum’s smart-contract ecosystem, while also integrating secure sideband computation parallelized across a scalable node network, a concept pioneered by Polkadot.

Moreover, the JAM protocol introduces a crucial service supporting existing parachains, allowing developers to continue utilizing Substrate for blockchain deployment.

This integration of Polkadot’s infrastructure with Ethereum’s smart contract capabilities and its commitment to DOT underscores a strategic alignment towards interoperability and scalability, potentially reshaping the landscape of decentralized applications and blockchain development.

Featured image from Pexels, chart from TradingView

Polkadot Unveils Major Upgrade Plan: Relay Chain Replacement And 10M DOT Prize Incentive

Gavin Wood, the founder of the Polkadot protocol, has unveiled a new Gray Paper outlining the forthcoming Join-Accumulate Machine (JAM) upgrade for the network. This announcement occurred during Wood’s presentation on Polkadot’s future at the Token2049 crypto conference in Dubai. 

Wood introduced the JAM Implementer’s Prize, a 10 Million DOT prize pool, to encourage diverse development of the JAM protocol. 

Polkadot Unveils JAM Upgrade

According to the announcement, the JAM upgrade aims to replace the relay chain, which acts as the central data chain in the Polkadot network, with a “more modular and minimalist design” that will allow Polkadot to run generic services and increase network stability. 

The parachains service within JAM will support existing Substrate-based parachains, enabling developers to continue using Substrate to develop and deploy their blockchains. 

Notably, these services will have no predefined limits on code, data, or state capacity and can accommodate additional DOT deposits for increased capacity.

JAM’s design includes several technical improvements. It replaces WebAssembly with the Polkadot Virtual Machine based on the RISC-V ISA, an open-source instruction set architecture (ISA) used to develop custom processors.

It also introduces SAFROLE, a SNARK-based block production algorithm. These upgrades are reportedly designed to optimize performance and scalability within the Polkadot network.

On The Path To Decentralization?

To realize the vision of “a truly decentralized protocol,” Polkadot aims to support multiple client implementations. Furthermore, the JAM Implementer’s prize has been established to incentivize and fund projects contributing to the development of JAM implementations. The announcement further reads on the matter:

We believe that supporting a range of implementations in various programming languages will strengthen the ecosystem’s foundation. It distributes the power of protocol implementers more widely and reduces the risk of a bug in one implementation taking down the entire network.

The JAM Implementer’s Prize will collaborate with existing and future funding initiatives that support Polkadot’s ecosystem and technology stack. These initiatives include Decentralized Futures, Grants, and Polkadot’s on-chain treasury. 

The prize will be activated when JAM is ratified as a Polkadot technology through the network’s on-chain governance mechanism.

Overall, Gavin Wood’s introduction of the JAM upgrade and the associated 10 Million DOT prize reflects Polkadot’s intention to increase the protocol’s use and adoption. JAM’s modular design and incentives for multi-client implementations are also expected to contribute to ongoing efforts to decentralize the Polkadot network. 

As JAM development continues, the Polkadot ecosystem welcomes proposals from teams interested in implementing it in various programming environments.

Polkadot

Despite the recent announcement, the network’s native token, DOT, has been unable to break the downtrend witnessed over the past month. Currently trading at $6.75, it reflects a significant 24% decline in price over the last 30 days.

Featured image from Shutterstock, chart from TradingView.com 

Polkadot Shines – Is Now The Time To Buy DOT Before $10?

Polkadot, a blockchain platform designed for interoperability between different blockchains, is experiencing a surge in new users, but a disconnect between user growth and network activity is raising questions about its long-term viability.

Based on the latest figures, DOT tallied an all-time high in active wallets and unique accounts in March, surpassing 600,000 and 5.59 million, respectively. This suggests a growing interest in the platform, potentially driven by the thriving developer ecosystem on Polkadot’s parachains, specialized blockchains that connect to the main Polkadot chain. Moonbeam, a prominent parachain, played a particularly significant role, contributing the highest number of active addresses with nearly 250,000.

Polkadot Transactions Dip Despite Active User Growth

However, despite the influx of new users, the number of transactions on the Polkadot network hasn’t kept pace. While there was a modest increase in transactions compared to February, the current volume remains significantly lower than the peak recorded in December.

This inconsistency raises concerns about how actively users are engaging with the network. The possibility exists that users are holding or staking their DOT tokens instead of utilizing them for transactions on the platform.

Polkadot Price Seeks Stability After Recent Decline

The price of Polkadot’s native token, DOT, seems to be finding support around $9. This could indicate a period of consolidation after a decline from its previous highs above $11. While a price increase is typically seen as a positive sign, it’s important to consider it alongside actual network usage.

Is Polkadot Building Without Using?

The current situation with Polkadot presents a paradox. The platform is attracting new users, but they aren’t necessarily translating into active network participants. This could be due to several factors. Perhaps users are waiting for a specific application or service to be built on Polkadot before actively engaging. It’s also possible that technical limitations are hindering user activity.

Further analysis is needed to understand the reasons behind the lagging transactions. Examining the types of transactions occurring on the network could provide valuable insights. For instance, an increase in governance-related transactions might suggest a more engaged user base, even if overall transaction volume remains low.

Polkadot’s Future Hinges On Active Network Use

While the growth in active wallets and accounts is a positive sign for Polkadot, it’s crucial to convert this interest into actual network usage. The success of Moonbeam demonstrates the potential for a vibrant developer ecosystem on Polkadot. However, broader adoption across various use cases is necessary for the platform to reach its full potential.

Featured image from Pexels, chart from TradingView

Analyst Bullish On Polkadot (DOT), Predicts $17 Price Target Before April

Polkadot (DOT) is gaining positive momentum and could be poised for a significant price surge, according to crypto analysts.

Michaël van de Poppe, an expert in the field, has identified encouraging market dynamics for Polkadot, suggesting a potential upward trajectory in the next few days or weeks.

Polkadot Analyst Insights: Promising Momentum

Polkadot on the USDT pair showed a regular pattern of higher highs and lower lows, according to Van de Poppe, suggesting an increase in bullish momentum. He also pointed out that Polkadot’s Bitcoin pair is still around a cycle low, indicating a possible trend reversal. Van de Poppe theorised that Polkadot might be returning to its peak in the upcoming months based on these facts.

At the time of writing, Polkadot’s price stands at $9.26, with a 24-hour trading volume of $1.24 billion and a market capitalization of a little over $9 billion.

DOT price up in the last 24 hours. Source: Coingecko

Cryptocurrency experts have been closely monitoring Polkadot’s price fluctuations since the beginning of 2023. Drawing insights from historical data and market trends, these analysts anticipate an average DOT rate of $13.70 by March 2024.

However, they acknowledge a range of potential outcomes, with minimum and maximum price estimates standing at $10 and $17, respectively.

Blockchain Data Accessibility Revolutionized

Meanwhile, in a move that promises to revolutionize crypto data analysis for Polkadot and Kusama, Dune Analytics has announced a groundbreaking partnership with Colorful Notion. This collaboration marks a significant leap forward in accessibility, bringing a wealth of on-chain data from these blockchains to the fingertips of Dune users for the very first time.

Previously, analyzing on-chain activity within the Polkadot and Kusama ecosystems presented a challenge. However, this partnership empowers users with the ability to examine a rich pool of data, including decoded Substrate block data tables, extrinsics, calls, events, and transfers.

This integration signifies a crucial step towards demystifying the complexities of blockchain data within the Polkadot ecosystem. By making this information readily accessible and fostering user-friendly analysis tools, the partnership between Dune Analytics and Colorful Notion holds immense potential for developers, researchers, and anyone with a vested interest in understanding the health and activity of the Polkadot network.

Featured image from Pexels, chart from TradingView

DOT Price (Polkadot) Jumps 10%, Why Bulls Can Pump It To $12

Polkadot (DOT) is gaining pace above the $10.00 resistance against the US Dollar. The price could extend its rally toward the $12.00 level in the near term.

  • DOT is gaining pace above the $9.80 and $10.00 levels against the US Dollar.
  • The price is trading above the $10.00 zone and the 100 simple moving average (4 hours).
  • There is a key bullish trend line forming with support at $9.10 on the 4-hour chart of the DOT/USD pair (data source from Kraken).
  • The pair could continue to rise toward the $12 resistance zone.

Polkadot Price Resumes Rally

After forming a base above the $8.00 level, DOT price started a fresh rally. It gained over 20% in a few days and even outperformed Ethereum and Bitcoin at times.

There was a clear move above the $9.50 and $10.00 resistance levels. The price traded to a new multi-month high at $11.00 and is currently consolidating gains. There was a minor pullback below the $10.75 level. The price is still above the 23.6% Fib retracement level of the upward move from the $8.26 swing low to the $11.00 high.

DOT is now trading well above the $10.00 zone and the 100 simple moving average (4 hours). There is also a key bullish trend line forming with support at $9.10 on the 4-hour chart of the DOT/USD pair. The trend line is close to the 61.8% Fib retracement level of the upward move from the $8.26 swing low to the $11.00 high.

DOT Price (Polkadot)

Source: DOTUSD on TradingView.com

Immediate resistance is near the $10.75 level. The next major resistance is near $11.00. A successful break above $11.00 could start another strong rally. In the stated case, the price could easily rally toward $12.00 in the near term. The next major resistance is seen near the $13.50 zone.

Are Dips Supported in DOT?

If DOT price fails to start a fresh increase above $11.00, it could start a downside correction. The first key support is near the $10.35 level.

The next major support is near the $10.00 level, below which the price might decline to $9.50. Any more losses may perhaps open the doors for a move toward the $9.20 support zone or the trend line.

Technical Indicators

4-Hours MACD – The MACD for DOT/USD is now gaining momentum in the bullish zone.

4-Hours RSI (Relative Strength Index) – The RSI for DOT/USD is now above the 50 level.

Major Support Levels – $10.35, $10.00 and $9.50.

Major Resistance Levels – $10.75, $11.00, and $12.00.

DOT Price (Polkadot) Looks Set To Crush $10 And Rally Further

Polkadot (DOT) is gaining pace above the $8.80 resistance against the US Dollar. The price could extend its rally once it settles above the $10 barrier.

  • DOT is gaining pace above the $8.50 and $8.80 levels against the US Dollar.
  • The price is trading above the $9.00 zone and the 100 simple moving average (4 hours).
  • There is a key bullish trend line forming with support at $9.20 on the 4-hour chart of the DOT/USD pair (data source from Kraken).
  • The pair could continue to rise unless the bears are able to defend the $10 resistance zone.

Polkadot Price Restarts Rally

After forming a base above the $7.50 level, DOT price started a steady increase. It gained over 25% in a few days and even outperformed Ethereum and Bitcoin at times.

There was a clear move above the $8.50 and $8.80 resistance levels. The price even traded close to the $10.00 level. A new multi-week high is formed near $9.89 and the price is now consolidating gains. It is holding gains above the 23.6% Fib retracement level of the upward move from the $8.57 swing low to the $9.89 high.

DOT is now trading above the $9.00 zone and the 100 simple moving average (4 hours). There is also a key bullish trend line forming with support at $9.20 on the 4-hour chart of the DOT/USD pair. The trend line is close to the 50% Fib retracement level of the upward move from the $8.57 swing low to the $9.89 high.

DOT Price (Polkadot)

Source: DOTUSD on TradingView.com

Immediate resistance is near the $9.85 level. The next major resistance is near $10.00. A successful break above $10.00 could start another strong rally. In the stated case, the price could easily rally toward $12.00 in the near term. The next major resistance is seen near the $13.50 zone.

Are Dips Supported in DOT?

If DOT price fails to start a fresh increase above $10.00, it could start a downside correction. The first key support is near the $9.50 level.

The next major support is near the $9.20 level, below which the price might decline to $8.80. Any more losses may perhaps open the doors for a move toward the $8.50 support zone.

Technical Indicators

4-Hours MACD – The MACD for DOT/USD is now gaining momentum in the bullish zone.

4-Hours RSI (Relative Strength Index) – The RSI for DOT/USD is now above the 50 level.

Major Support Levels – $9.50, $9.20 and $8.50.

Major Resistance Levels – $9.85, $10.00, and $12.00.

Polkadot (DOT) Circulating Market Cap Rockets To $8.3 Billion, Registers Massive 111% Growth

Polkadot, the computing platform known for its interoperability and scalability, has shown remarkable growth in key metrics during the latter part of 2023, as outlined in a recent report by Messari. 

Outpacing Crypto Market Growth

According to Messari’s findings, Polkadot’s circulating market cap experienced a remarkable 111% quarter-on-quarter (QoQ) growth, reaching an impressive $8.38 billion. 

This growth outpaced the overall crypto market’s growth of 54% during the same period. Furthermore, Polkadot’s year-on-year (YoY) change reached 94%, solidifying its position among the top 15 crypto projects by market capitalization.

Polkadot

In terms of revenue, Polkadot witnessed a substantial surge of 2,880% QoQ, generating $2.8 million in Q4 2023. This surge was primarily attributed to the significant rise in extrinsic, driven by the introduction of Polkadot Inscriptions

Messari suggests that even excluding the four-day spike from the Inscriptions, Polkadot’s revenue would have doubled from the previous quarter. It is worth noting that Polkadot’s revenue tends to be relatively lower compared to its competitors due to the structural design of its network.

Polkadot Witnesses Significant Increase In Active Addresses

Following the launch of OpenGov – the governance module and framework within the network – in June, the Polkadot Relay Chain experienced a surge in account activity, largely due to increased governance participation. 

Because the Relay Chain is critical in facilitating governance processes, it experienced a spike in active addresses on October 24, when users claimed their locked DOT tokens from the first batch of parachain auctions held two years earlier.

Polkadot

Throughout Q4, the Polkadot Relay Chain averaged over 10,000 daily active addresses, representing a substantial 90% QoQ increase. Excluding the October 24th activity related to DOT token claiming, the average number of active addresses still saw a significant 70% rise in QoQ, reaching 9,000. 

Additionally, Cross-Chain Message (XCM) transfers on the platform increased by 150% QoQ, reaching an all-time high of 133,000. The total number of active XCM channels nearly tripled in 2023, reaching 203 by the end of the year.

According to Electric Capital’s rankings, Polkadot has 800 full-time and 2,100 total developers, making it one of the largest crypto ecosystems in developer participation.

DOT Price Shows Mixed Performance

Despite notable growth in key metrics demonstrating the network’s expansion, the price of Polkadot’s native token, DOT, has not followed suit and has even experienced declines over longer time frames despite positive developments.

Currently, DOT is trading at $6.7420, representing a slight 0.3% price increase in the past twenty-four hours, coupled with a 9% year-to-date gain.

However, over the past fourteen and thirty days, the token has recorded a 6% and 22% price drop, highlighting the absence of bullish momentum and catalysts that could propel DOT to higher levels.

Polkadot

Although it reached a 19-month high of $9.5711 on December 26, the subsequent price drop has led DOT to a critical juncture, potentially erasing its gains over the past year.

If the current level and its nearest support at $6.3229 fail to halt further price declines, DOT could potentially drop to the $5.4830 level, which serves as the next major support in the token’s 1-day chart.

Conversely, if DOT surpasses its upper resistance at $7.0392, the next objective would be to break the short-term downtrend structure, facing the $7.5332 resistance and another resistance at $8.1631. This would pave the way for another consolidation phase at its 19-month high.

Featured image from Shutterstock, chart from TradingView.com 

Renowned Crypto Expert Reveals Top 3 Altcoins Ready To Breakout In February 2024

A prominent crypto analyst and Bitcoin enthusiast, Michael Van de Poppe, has shared insights on the future trajectory of several altcoins in the space. The crypto analyst’s predictions highlight crucial moments for investors as they watch out for opportune times to buy and sell cryptocurrencies in this dynamic market. 

Altcoins Set To Rise In 2024

Following the approval of Spot Bitcoin ETFs, Bitcoin experienced a substantial surge, rallying to overcome the $45,000 price mark. During this bullish momentum, the prices of several altcoins, including Ethereum (ETH) and Solana (SOL), also witnessed significant increases. 

In a recent X (formerly Twitter) post, Poppe revealed major altcoins to buy or sell in 2024. The crypto analyst shared a chart illustrating the historical price movements and corrections of Solana, Polygon (MATIC) and Chainlink (LINK). 

Poppe revealed that Solana’s consolidation phase appears to have ended after it experienced a major decline from its 2023 peak of over $123 to $95.81 at the time of writing. His analysis suggests that Solana is poised for a higher time frame support test at $80 and is anticipated to surge to new highs, potentially reaching $140. 

Subsequently, the crypto analyst presented a historical performance chart of MATIC, the native token of Polygon. Noting that the cryptocurrency has maintained higher time frame support levels with established liquidity, Poppe predicts an upcoming upward movement despite MATIC’s recent underperformance. 

He forecasts that MATIC’s next rally could propel its price to a range between $1.25 and $1.50. As of now, the price of MATIC is trading at $0.789, reflecting a 2.39% decline in the past 24 hours, according to CoinMarketCap. 

The Bitcoin enthusiast also anticipates a substantial price increase for Chainlink’s native token, LINK. The crypto analyst revealed that the cryptocurrency has consistently held crucial price levels and is positioned for an upward momentum towards $25. At the time of writing, the price of LINK stands at $14.65, representing a 0.12% increase in the last 24 hours. 

Underperforming Crypto In 2024

In his X post, Poppe unveiled a roster of altcoins that has been struggling to surge and maintain crucial resistance levels. The crypto analyst pointed out that Ethereum’s recent slow growth has adversely impacted many altcoins, causing them to experience further declines. 

He mentioned Synthetix (SNX), which is currently depreciating primarily due to Ethereum’s lagging performance. Additionally, there is Arbitrum (ARB) and Polkadot (DOT), which Poppe predicts would have a significant price increase in the future. 

The Bitcoin enthusiast stated that if ARB can return to a price level of around $1.40 and $1.60, it could open up new entries into a more sustainable position. Subsequently, Poppe predicts a rise in the price of Polkadot to $15 despite its current price trading at $6.80. 

The crypto analyst revealed that DOT is currently showcasing a “great weekly candle”, and its previous price corrections present a great opportunity for investors in the ongoing bull market. 

Crypto Total Market Cap on Tradingview.com (Altcoins Analyst)

DOT Price (Polkadot) Uptrend To Continue? These Could Be The Factors To Watch

Polkadot (DOT) is gaining pace above the $6.80 resistance against the US Dollar. The price could gain bullish momentum if it clears the $7.28 resistance.

  • DOT is trading in a positive zone from the $6.00 support against the US Dollar.
  • The price is trading near the $7.00 zone and the 100 simple moving average (4 hours).
  • There was a break above a key bearish trend line with resistance near $6.50 on the 4-hour chart of the DOT/USD pair (data source from Kraken).
  • The pair could continue to rise unless the bears are able to defend the $7.28 resistance zone.

Polkadot Price Restarts Increase

After a steady decline, DOT price found support near the $6.00 zone. A low was formed at $5.97 and Polkadot recently started a fresh increase. The price was able to clear the $6.20 and $6.50 resistance levels to move into a positive zone, like Bitcoin and Ethereum.

There was a break above a key bearish trend line with resistance near $6.50 on the 4-hour chart of the DOT/USD pair. The pair even surpassed the 23.6% Fib retracement level of the downward move from the $8.58 swing high to the $5.97 low.

DOT is now trading near the $7.00 zone and the 100 simple moving average (4 hours). Immediate resistance is near the $7.20 level. The next major resistance is near $7.28 or the 50% Fib retracement level of the downward move from the $8.58 swing high to the $5.97 low.

DOT Price (Polkadot)

Source: DOTUSD on TradingView.com

A successful break above $7.28 could start another strong rally. In the stated case, the price could easily rally toward $8.00 in the near term. The next major resistance is seen near the $8.50 zone.

Are Dips Supported in DOT?

If DOT price fails to start a fresh increase above $7.28, it could start a fresh decline. The first key support is near the $6.60 level.

The next major support is near the $6.00 level, below which the price might decline to $5.65. Any more losses may perhaps open the doors for a move toward the $5.32 support zone.

Technical Indicators

4-Hours MACD – The MACD for DOT/USD is now gaining momentum in the bullish zone.

4-Hours RSI (Relative Strength Index) – The RSI for DOT/USD is now above the 50 level.

Major Support Levels – $6.60, $6.00 and $5.65.

Major Resistance Levels – $7.28, $8.00, and $8.50.

Polkadot Rally Incoming? Crypto Analyst Predicts 150% Price Surge For DOT

The Polkadot (DOT) token has witnessed significant downward pressure over the past few weeks. This negative performance was further exacerbated by the recent downturn of Bitcoin’s value, which tumbled below $40,000 over the past week.

However, the altcoin appears to be garnering momentum in the past few days, having rebounded positively from the $6 mark. A popular analyst on the X platform has put forward an exciting projection for DOT, saying the token looks set for a substantial upward move in the coming weeks.

Can Polkadot Reach $17 In This Cycle?

In a recent post on X, prominent crypto analyst Michael van de Poppe noted that the altcoins market is on the verge of a significant surge. Specifically, the crypto pundit singled out the Polkadot token as one of the assets to look out for.

According to Poppe’s post on X, DOT is approaching a significant support level in three days. The analyst identified the support zone between $5.60 and $6 while highlighting the need for this level to hold strong.

Polkadot

If the support level holds, Michael van de Poppe believes that Polkadot’s price is primed for a substantial run to the upside in the current cycle. And the crypto analyst put forward an ultimate $17 target for the cryptocurrency if a breakout does occur.

This potential price action would represent a massive 150% upswing from the current price point. Nevertheless, this would still be a long way from the token’s all-time high of $54.98

It is worth noting that Michael van de Poppe has also identified a price zone that will be integral to DOT’s possible run to $17. According to his analysis, there is significant resistance for the altcoin to overcome at around the $9.39 level.

DOT last hit this price point on Boxing Day. Resistance caused the coin’s value to collapse; since December 26, 2023, it has dropped by almost 30%.

DOT Price Overview?

As earlier inferred, Polkadot’s price has performed poorly since the turn of the year. According to data provided by CoinGecko, the cryptocurrency’s value has dipped by almost 24% in the past month.

As of this writing, the DOT price is $6.69, reflecting a 3.8% increase in the last 24 hours. However, the coin is still red on the weekly timeframe, with a 2.3% price slump over the past seven days.

Nonetheless, Polkadot ranks as the 13th-largest cryptocurrency, with a market capitalization of roughly $8.85 billion.

Polkadot

DOT Price (Polkadot) Pumps 15% As Bulls Aim For Surge To $10

Polkadot (DOT) is gaining pace above the $7.50 resistance against the US Dollar. The price is up nearly 15% and might rise further toward $10.00.

  • DOT is showing heavy bullish signs from the $6.65 support against the US Dollar.
  • The price is trading above the $8.00 zone and the 100 simple moving average (4 hours).
  • There was a break above a key bearish trend line with resistance near $7.80 on the 4-hour chart of the DOT/USD pair (data source from Kraken).
  • The pair could continue to rally unless the bears are able to defend the $8.88 resistance zone.

Polkadot Price Restarts Rally

After a steady decline, DOT price found support near the $6.65 zone. A low was formed at $6.64 and Polkadot recently started a fresh increase. The price was able to clear the $6.85 and $7.00 resistance levels to move into a positive zone, like Bitcoin and Ethereum.

There was a break above a key bearish trend line with resistance near $7.80 on the 4-hour chart of the DOT/USD pair. The pair even surpassed the 50% Fib retracement level of the downward move from the $9.58 swing high to the $6.64 low.

DOT is now trading above the $8.00 zone and the 100 simple moving average (4 hours). Immediate resistance is near the $8.45 level. The next major resistance is near $8.88 or the 76.4% Fib retracement level of the downward move from the $9.58 swing high to the $6.64 low.

DOT Price (Polkadot)

Source: DOTUSD on TradingView.com

A successful break above $8.88 could start another strong rally. In the stated case, the price could easily rally toward $9.50 in the near term. The next major resistance is seen near the $10.00 zone.

Are Dips Supported in DOT?

If DOT price fails to start a fresh increase above $8.45, it could start a fresh decline. The first key support is near the $7.80 level and the same trend line.

The next major support is near the $7.50 level, below which the price might decline to $7.00. Any more losses may perhaps open the doors for a move toward the $6.65 support zone.

Technical Indicators

4-Hours MACD – The MACD for DOT/USD is now gaining momentum in the bullish zone.

4-Hours RSI (Relative Strength Index) – The RSI for DOT/USD is now above the 50 level.

Major Support Levels – $7.80, $7.500 and $7.00.

Major Resistance Levels – $8.45, $8.88, and $9.50.

Polkadot Shows Bearish Signal, Analyst Predicts Drawdown To This Target

A cryptocurrency analyst has explained how Polkadot could potentially see a decline to this level because of a sell signal in in its weekly price chart.

Polkadot Weekly Price Has Formed A TD Sequential Sell Setup Recently

In a new post on X, analyst Ali has pointed out that a TD Sequential sell signal has been forming for Polkadot recently. The “TD Sequential” refers to a tool in technical analysis that’s generally used for pinpointing likely points of reversal in any asset’s price.

The indicator is made up of two phases. In the first phase, called the setup, candles of the same polarity are counted up to 9. After the ninth candle, a probable reversal in the price may be assumed to have taken place.

If the setup’s completion occurred with the overall trend being towards the up (that is, the nine candles were green), the asset might have hit a top. Similarly, a bottom could be in if the price had been going down.

The second phase, known as the “countdown,” begins right after the setup’s completion and lasts for thirteen candles. At the end of these thirteen candles, another probable reversal in the asset could be assumed to have occurred.

Recently, Polkadot’s weekly price has completed a TD Sequential phase of the former type, as the chart below shared by the analyst shows.

Polkadot TD Sequential

As is apparent from the graph, the Polkadot weekly price has finished the TD Sequential setup phase with green candles recently. This could suggest that a sell signal has now formed for the cryptocurrency.

In the same chart, Ali has also displayed the data for the 100-day exponential moving average (EMA) for the asset, a level that has been a source of resistance in the past.

Interestingly, this TD Sequential setup has completed just as the weekly price of the cryptocurrency has approached the 100-day EMA. “This could lead to a spike in profit-taking, potentially driving DOT down to $7.50,” explains the analyst. From the current spot price, a drawdown to this level would mean a drop of more than 18% for Polkadot.

DOT Is Up Almost 3% During The Last 24 Hours

While these bearish developments have occurred in the weekly price of DOT, the asset has still continued to rise during the past day, as its price has now cleared the $9.2 level.

Below is a chart that shows how Polkadot has performed during the past month.

Polkadot Price Chart

The green returns during the last 24 hours are a continuation of the bullish momentum that DOT has enjoyed in the past week, a window inside which it’s now up almost 39%.

Though the asset has been able to continue this run for now, the technical obstacles it’s facing in terms of the TD Sequential and 100-day EMA could mean that the top might be near for the coin.

Will Inscriptions On Polkadot Push DOT Prices Back Above $10?

There has been a notable spike in the number of Polkadot transactions in recent days. The surge also coincides with DOT prices racing to new 2023 highs when writing on December 22.

Taking to X, asynchronous rob noted that Polkadot is currently processing around 250,000 transactions per hour or 400-450 per block. Polkadot is a modern blockchain that aims to drive blockchain interoperability.

Based on its design, relying on a Relay Chain and numerous Parachains, the network can process transactions cheaply, considering its high capacity.

Polkadot Transactions Swelling: Blame Dota and Inscriptions

The rapid expansion of transactions on Polkadot can be attributed to the recent launch of inscriptions, a new type of cross-chain asset developed by the Dota platform. Uniquely, Dota’s inscriptions aim to simplify the process of deploying and minting assets on Polkadot’s parachains. 

Though parachains operate independently as “chains” that rely on the Relay Chain for security, this design will eliminate the need for Cross-Chain Message Forma (XCM), which is needed for Polkadot parachains to communicate. 

Usually, the XCM requires complex coding and can be time-consuming. Therefore, the simplicity of DOT-20 inscriptions by Dota directly explains why there is a surge in the number of transactions.

According to Dota on X, inscriptions on Polkadot account for 98% of the recent transaction volume.

Inscriptions on Polkadot | Source: Dota

Though there has been a change in the number of transactions processed, transaction fees on Polkadot remain low. At the same time, the network hasn’t “skipped a bit,” with capacity being around 10%. 

By how Polkadot is designed, network fees will increase only once 25% of the total network capacity is changed. To reach this level, each block being confirmed on Polkadot must pack at least 1,250 transactions. 

This will require even more inscriptions to be created via Dota, meaning despite the observed spike, Polkadot is technically underutilized from a bandwidth perspective.

Will DOT Continue Rising In 2024?

While the deluge of transactions also coincides with rising DOT prices, currently at 2023 highs, there have been concerns about inscriptions causing network congestion in a network like Bitcoin facing scaling challenges.

Critics maintain that inscriptions, though defended by some, serve nothing more than spamming the network and discouraging use due to accompanying increases in transaction fees. 

Polkadot price trending upward on the daily chart | Source: DOTUSDT on Binance, TradingView

For now, it remains to be seen if inscriptions will be sustainable, helping onboard more users. So far, Polkadot, as mentioned, can handle the uptick in transactions.

Even so, if there is a 3X rise in transactions exceeding the 1,250 transactions per block threshold, the demand for DOT will rise. Subsequently, DOT will likely trend higher towards $10 and other critical resistance levels.

DOT Price (Polkadot) Holds Strong At $6.6, Signs Point To Fresh Rally Ahead

Polkadot (DOT) is correcting gains from the $7.75 against the US Dollar. The price could start a fresh increase unless there is a close below $6.30.

  • DOT is consolidating gains above the $6.60 support zone against the US Dollar.
  • The price is trading above the $6.65 zone and the 100 simple moving average (4 hours).
  • There is a key bullish trend line forming with support near $6.65 on the 4-hour chart of the DOT/USD pair (data source from Kraken).
  • The pair could start a fresh increase if the bulls protect the $6.65 and $6.30 support levels.

Polkadot Price Holds Ground

After forming a base above the $5.50 support, DOT price started a decent increase. The price was able to clear the $5.85 and $6.00 resistance levels to move into a positive zone, like Bitcoin and Ethereum.

Polkadot even surpassed the $6.65 resistance zone and settled above the 100 simple moving average (4 hours). Finally, the bears appeared near the $7.75 zone. A high was formed near $7.77 and the price is now correcting gains. There was a drop below the $7.20 and $7.00 levels.

DOT declined below the 61.8% Fib retracement level of the upward move from the $6.31 swing low to the $7.77 high. However, it is still above the $6.65 zone and the 100 simple moving average (4 hours).

There is also a key bullish trend line forming with support near $6.65 on the 4-hour chart of the DOT/USD pair. The trend line is close to the 76.4% Fib retracement level of the upward move from the $6.31 swing low to the $7.77 high.

DOT Price (Polkadot)

Source: DOTUSD on TradingView.com

Immediate resistance is near the $7.05 level. The next major resistance is near $7.20. A successful break above $7.20 could start another strong rally. In the stated case, the price could easily rally toward $7.75 in the near term. The next major resistance is seen near the $8.00 zone.

More Losses in DOT?

If DOT price fails to start a fresh increase above $7.05, it could continue to move down. The first key support is near the $6.65 level and the trend line.

The next major support is near the $6.30 level, below which the price might decline to $5.70. Any more losses may perhaps open the doors for a move toward the $5.00 support zone.

Technical Indicators

4-Hours MACD – The MACD for DOT/USD is now gaining momentum in the bearish zone.

4-Hours RSI (Relative Strength Index) – The RSI for DOT/USD is now below the 50 level.

Major Support Levels – $6.65, $6.30 and $5.70.

Major Resistance Levels – $7.05, $7.20, and $7.75.