Following a pullback, the price of Bitcoin has continued on its downward movement. The coin, after failing to break above the 100-day Simple Moving Average (SMA) and the trend line has experienced a drop of over 6% from its previous high.
Will the price of BTC continue to move in a downward direction or will it reverse and start moving in an upward direction?
As of the time of writing, the price of BTC was trading around $62,972 which is about 28% down from its all-time high and was down by 1.27% in the last 24 hours. Although the price is trading below the 100 SMA on the 4-hour chart, on the daily chart it is still trading above the 100 SMA.
Current Condition Of Indicators And What They Suggest
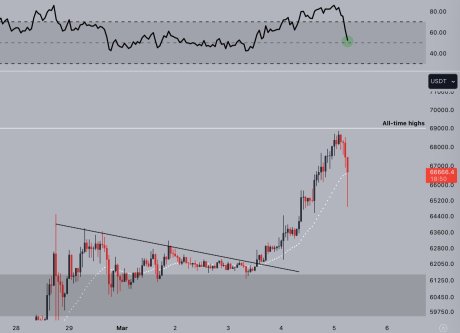
Looking at the chart, technically a support level and a resistance level of $59,653 and $67,255 were formed respectively. However, there could be more support and resistance levels created if the price continues to move downward.
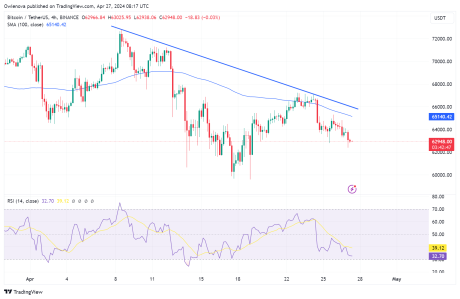
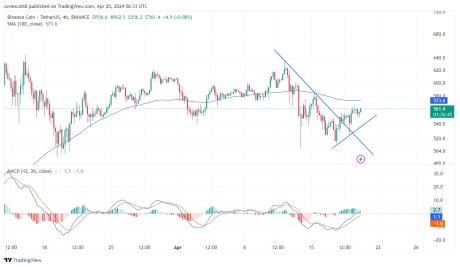
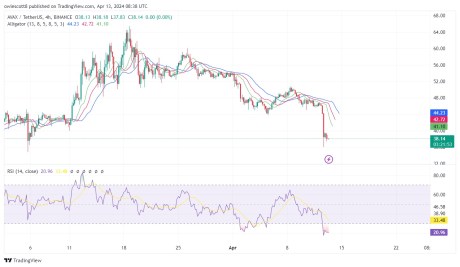
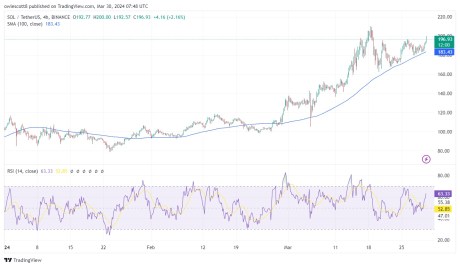
4-Hour Moving Average: A technical observation of the chart from the 4-hour timeframe as seen in the image below reveals that the price is trending below the 100-day moving average. This suggests that the price is on a downtrend and could potentially move further downward.
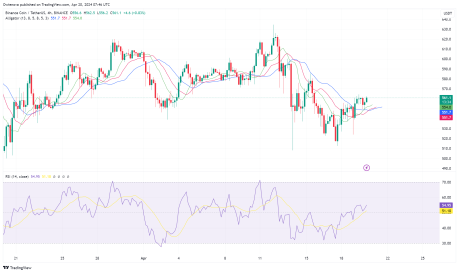
4-Hour RSI indicator: The Relative Strength Index (RSI) indicator here suggests a downward trend as the RSI signal has crossed and is trending below the 50% line as observed on the above chart.
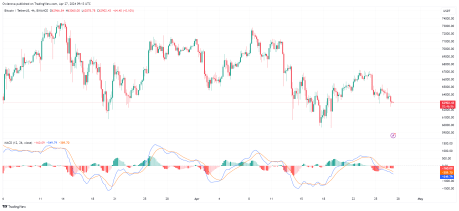
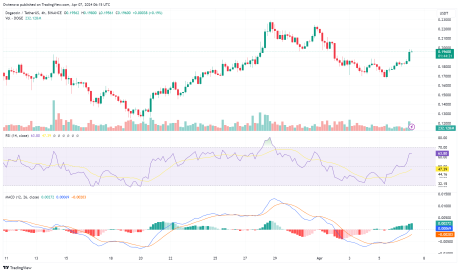
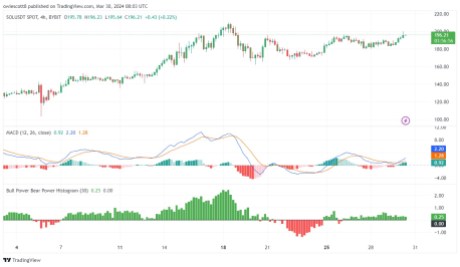
The MACD indicator from the 4-hour chart also suggests that the price might continue to move downward as the MACD histograms are trending below the zero line. Both the MACD line and the Signal line have crossed and are trending below the MACD zero line, indicating a bearish trend, as seen in the above image.
Possible Outcome
With the setup of the above indicators, it can be suggested that the price of Bitcoin is still bearish and that there are possibilities that it could still move further downward.
If Bitcoin continues downward and breaks below the support level of $59,653, it could witness a deep correction to create a new support level. However, if the price fails to break below this support level, it could start an upward correctional movement towards its previous level of $67,255 and if it manages to break above this level, the price will begin an uptrend.