Binance and Mitsubishi UFJ Trust and Banking Corporation (MUTB) are exploring the issuance of Yen and other foreign currency-denominated stablecoins in Japan.
Cryptocurrency Financial News
Binance and Mitsubishi UFJ Trust and Banking Corporation (MUTB) are exploring the issuance of Yen and other foreign currency-denominated stablecoins in Japan.
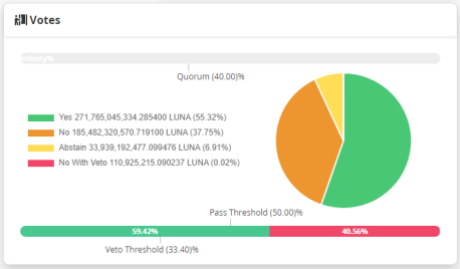
The Terra Luna Classic (LUNC) community has voted overwhelmingly, with nearly 60% in favor, to cease the minting and reminting of Terra Classic UST (USTC) tokens. The drastic decision, in a decisive move aimed at rescuing the beleaguered Terra Classic stablecoin, comes in the wake of Terra’s collapse in May 2022, which had sent shockwaves through the crypto market, leaving USTC’s value in shambles.
The proposal to halt USTC minting and reminting is part of a comprehensive plan to facilitate the re-pegging process of the stablecoin. To accelerate this process, members of the Terra Classic community are actively encouraged to participate in the burning of USTC tokens, effectively reducing the token’s circulating supply.
Before the catastrophic events of May 2022, Terra’s blockchain network allowed users to seamlessly swap between USTC and LUNA, Terra’s native cryptocurrency. However, as the network crumbled and USTC lost its peg to the US dollar, the system began minting LUNA coins in a desperate attempt to restore stability.
This emergency measure led to an oversupply of LUNA tokens and a cascading effect on its price, dragging USTC’s value far below its intended $1 mark.
The community’s primary objective with this proposal is to expedite the burning of LUNA tokens, ultimately driving up their value. The burning process, where tokens are permanently removed from circulation, has been sluggish so far, with only 75 billion LUNC tokens successfully incinerated. This leaves the circulating supply at approximately 5.9 trillion LUNC, out of a total supply of 6.84 trillion.
As more LUNA tokens were minted to restore the USTC peg, the oversupply put immense downward pressure on LUNA’s price. Consequently, USTC’s value suffered a steep decline from its initial $1 valuation.
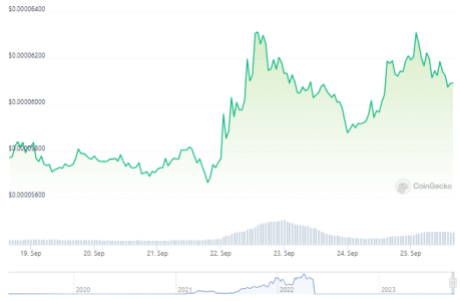
Despite the tumultuous journey thus far, there are positive indicators that offer a glimmer of hope for the Terra Luna Classic community. According to CoinGecko, the current price of LUNC stands at $0.00006150, reflecting a 2.9% increase in the past 24 hours and a promising 6.6% surge over the past seven days.
Key momentum indicators observed within a 24-hour window show signs of approaching overbought levels. LUNC’s Relative Strength Index (RSI) stands at 53, indicating moderate strength, while its Money Flow Index (MFI) is at 76, suggesting robust accumulation. This shift in sentiment indicates that the community’s efforts to restore value may be gaining traction.
The Terra Luna Classic community’s bold decision to halt USTC minting and reminting signifies a concerted effort to revitalize the ailing stablecoin. With a renewed focus on burning LUNA tokens and correcting the supply-demand imbalance, the community aims to steer USTC back on course towards its $1 peg, providing a glimmer of hope amidst a challenging journey of redemption.
(This site’s content should not be construed as investment advice. Investing involves risk. When you invest, your capital is subject to risk).
Featured image from
Bitcoin might not be able to observe any extended runs of bullish momentum until this on-chain indicator reverses its trend.
During the past few days, Bitcoin has registered some rise and has managed to breach the $27,000 level. The asset has, however, been unable to build up any sustained moves above this mark so far.
The below chart shows how the cryptocurrency’s price has changed in recent days:
While moves above the level have all failed, the asset is still more than 3% up during the past week, which is more than some of the other top coins like Ethereum (ETH), Cardano (ADA), and Dogecoin (DOGE).
Now, as for whether Bitcoin can find a proper break toward higher levels, data from the on-chain analytics firm Santiment may provide some hints. The indicator of interest here is the combined percentage of the stablecoin circulating supply that’s being held by the whales.
Here is a chart that shows the trend in this indicator over the past year:
The “whales” here refer to entities that are carrying at least $5 million in their addresses. These investors are among the largest in the market, so they can hold some notable influence.
Related Reading: Here’s Where Next Bitcoin Resistance Lies, From An On-Chain Perspective
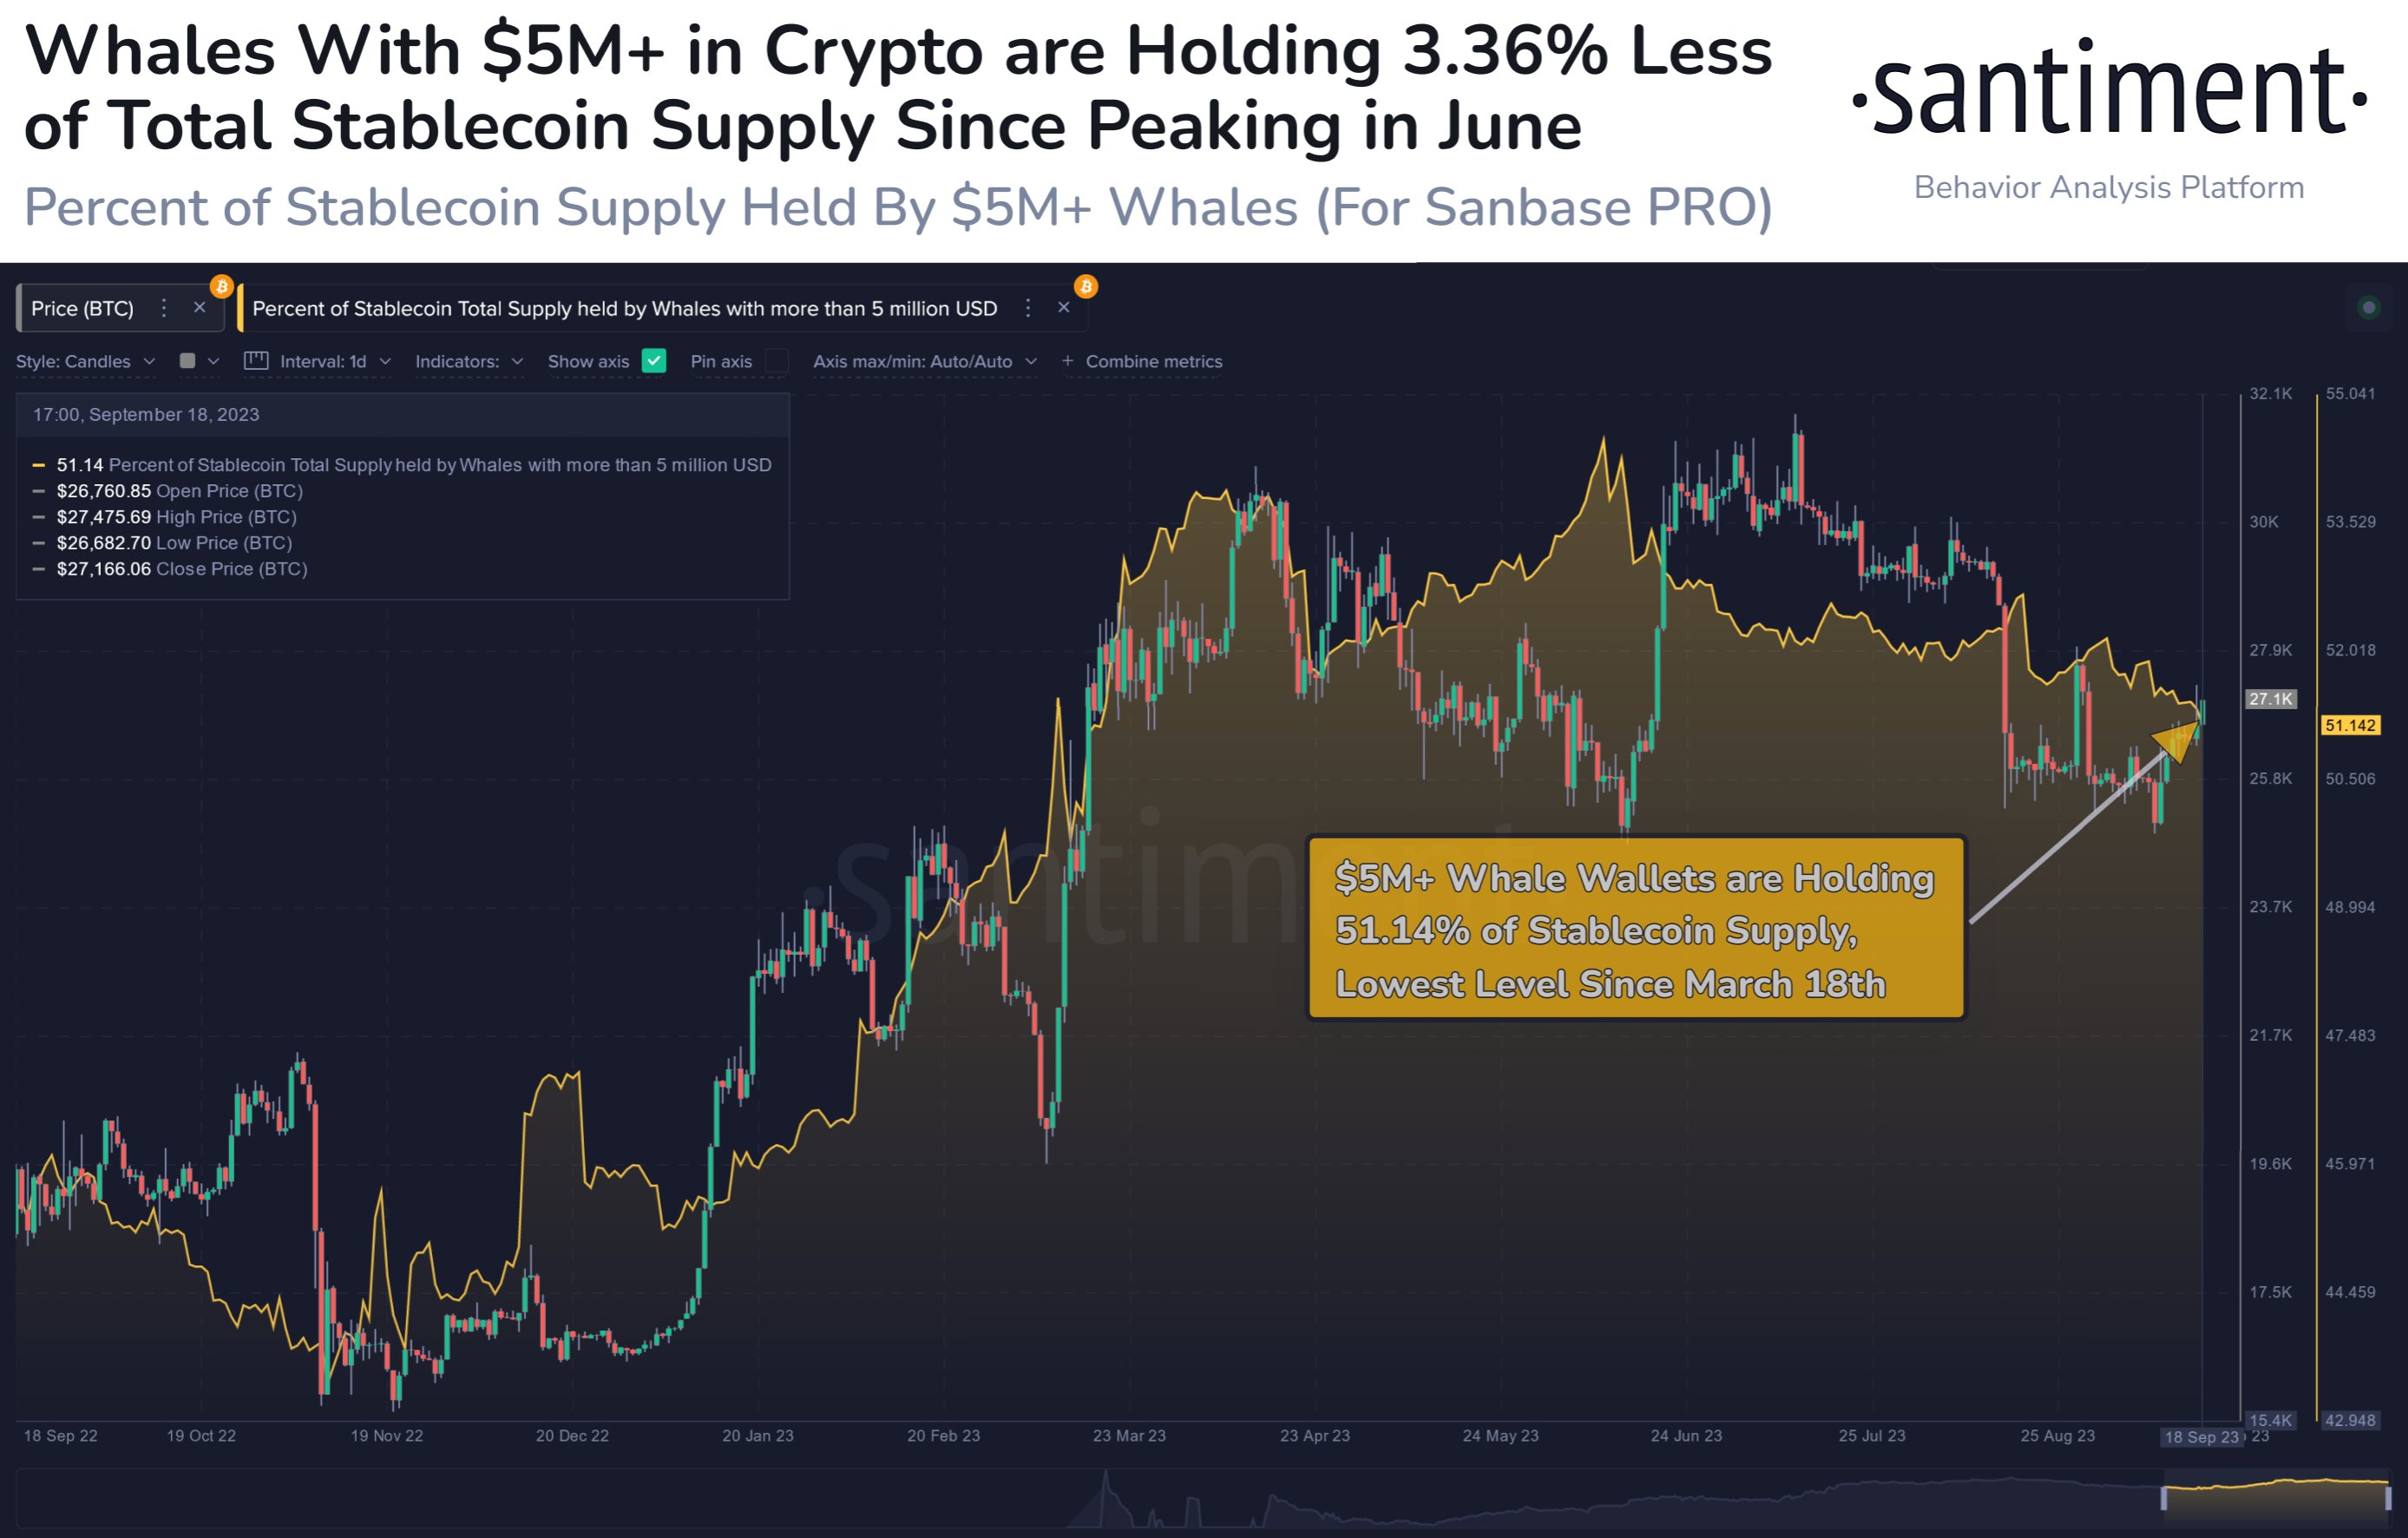
From the graph, it’s visible that the total stablecoin supply held by these humongous holders has been on a net decline during the past few months. Following the latest drawdown in the metric, its value has hit 51.14%, which is the lowest observed since March 18th, about six months ago.
Now, the main question is: what’s the relevance of this metric to Bitcoin? The answer to this question lies in the reason why these holders generally choose to hold stablecoins.
Investors may want to hold their capital in the form of these fiat-tied tokens whenever they intend to avoid the volatility associated with other assets in the sector like BTC.
Such holders are probable to return back into the market as if they were looking to completely exit the sector, they may have done so through outflows into fiat. Once these stablecoin investors find that the prices are right to jump back into the volatile side of the market, they swap their tokens for them.
This act of shifting naturally provides a buying pressure on the prices of the coins that they are moving into. Because of this reason, the stablecoin supply could serve as a measure of the potential dry powder available for Bitcoin and other cryptocurrencies.
As the whales are clearly the most significant entities in the sector, the stablecoin supply held by them is of particular importance. Generally, uptrends in BTC follow periods where the whales significantly shed their stable supplies, as it means that they are buying into the asset with them.
Examples of such a trend are visible in the chart, as this pattern formed both prior to the January rally and the rebound in June. These investors have been decreasing their supply recently as well, but as BTC has gone down in this period instead, it’s likely that this decline is coming from withdrawals into fiat.
A turnaround in this indicator may be the one to watch for, as it can be a sign of fresh capital injections into the sector. Perhaps only once the whales’ buying power would return to the same levels as it was earlier in the year when Bitcoin breached $30,000, the asset would be able to find a sustained upward move.
A new report has shown that the adoption of PayPal’s PYUSD stablecoin has seen less than favorable adoption rates since its inception. The crypto community remains skeptical about employing the new stablecoin for daily crypto payments and has opted for top competitor stablecoins like USDT and USDC.
Global payments giant PayPal released its transparency report for its stablecoin, PYUSD, and the analysis of the report reveals that the PYUSD stablecoin may not be seeing as much adoption as PayPal and PYUSD stablecoin issuer, Paxos hoped for.
Paypal launched the US dollar-backed stablecoin on August 7 which was designed to increase stablecoin offerings and facilitate the adoption of crypto payments to crypto users as well as consumers and merchants actively utilizing PayPal’s financial platform globally.
However, despite coming from one of the largest players in the payments space, the PYUSD stablecoin remains a relatively small player in the cryptocurrency market, especially when compared to industry heavyweights like Tether (USDT) and USD Coin (USDC).
A Kaiko analyst, Desislava Aubert stated to Decrypt that despite being listed on prominent exchange platforms like Coinbase and Huobi Global, the PYUSD stablecoin’s adoption rate has been progressing slowly, and its daily trade volumes have been fairly low.
“PYUSD was listed on some centralized exchanges in late August, notably Coinbase and Kraken, but its daily trading volume has been volatile and significantly lower than other stablecoins. Overall, this points to sluggish demand,” Aubert stated.
The PayPal USD stablecoin was issued by Paxos Trust Company, a technology company specializing in blockchain in August. Paxos has reported that it holds $45.3 million in assets supporting the PYUSD stablecoin.
The stablecoin is also reportedly backed with over $1.5 million in cash deposits. The majority of the coin’s reserves, approximately $43.8 million have been collateralized with the US Treasuries as reverse purchase agreements.
Currently, PYUSD has a market capitalization of $44 million, suggesting that the stablecoin’s adoption rate has been subpar due to its failure to catch and retain the attention of the crypto community.
The decline in acceptance and adoption of the PYUSD may be attributed to the unfamiliarity of the cryptocurrency as a new stablecoin. The stablecoin market is also heavily saturated with well-established cryptocurrencies like USDT, USDC, and others.
Given this, a large number of crypto investors are presently opting for these top stablecoins to facilitate their cryptocurrency transactions. This is further propelled by the fact that these stablecoins have created a considerable reputation for themselves over the years due to their reliability and sustainability.
Presently, USDT has a market capitalization of over $83 billion and USDC has a market cap of $26 billion. At the time of writing, USDT stablecoin’s 24-hour trading volume is over $22 billion as compared to PYUSD stablecoin’s 24-hour trading volume of only $3.2 million.
Despite PYUSD’s sluggish adoption rate, PayPal remains committed to its cryptocurrency ventures. The payment giant has expanded into different regions globally using its brand name and reliable reputation as an international financial service provider to facilitate crypto adoption and awareness among users in different countries.

MakerDAO’s Rune Christensen says appropriate regulation will see stablecoins become mainstream, but the real opportunity is in decentralized stablecoins.
Trading volume has climbed to around $50 million since the service was introduced last month.
Amidst the constant price swings and uncertainties that plague the crypto market, stablecoins have become an invaluable asset for investors and traders. However, analysts have revealed several stablecoins that have been struggling to maintain the esteemed stability reserved for these types of assets.
The inherent volatility of the crypto market and the persistent price fluctuations of cryptocurrencies are a constant experience in the crypto industry. Due to this, stablecoins like USDT, USDC, and DAI have long been revered as a reliable bridge between the volatility and instability of cryptocurrencies.
However, a recent report has raised concerns about the stability of some of the most popular stablecoins. The report saw analysts from S&P Global explore the top five stablecoins including Tether (USDT), Dai (DAI) Binance USD (BUSD), USD Coin (USDC), and Paxos (USDP).
The research paper from Dr. Cristina Polizy, Anoop Garg, and Miguel de la Mata revealed that USDC and DAI have failed to maintain their dollar peg multiple times in the last two years, as compared to other stablecoins like USDT and BUSD.
The analysis revealed that the de-pegging events for USDC and DAI have taken place more often than those of USDT and BUSD. Circle’s USDC was named as the stablecoin with the most prolonged de-pegging event, dropping to $0.90 for 23 minutes while DAI de-pegged for 20 minutes.
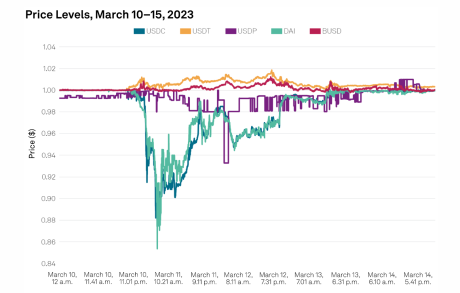
In contrast, USDT dropped below the one-dollar peg for just one minute, while BUSD has not experienced any de-pegging event since June 2021 and June 2023.
March 2023 saw the fall of three prominent banks in the United States, including Silicon Valley Bank (SVB), Silvergate Bank, and Signature Bank. Due to the affiliations of these banks with the crypto industry, their collapse had a significant impact on the prices of digital assets in the space.
Circle’s USDC experienced a decline of 13% below the one-dollar mark after reports revealed that a significant portion of Circle’s cash reserves, adding up to $3.3 billion, were kept in Silicon Valley Bank (SVB). However, the stablecoin has since recovered and maintained its peg following an announcement that confirmed that the Federal Reserve would endorse the banks’ creditors.
Subsequently, Michael Barr, a high-ranking official at the United States Federal Reserve raised concerns about the adoption rate of unregulated stablecoins like USDT and USDC, which are currently the top stablecoins by market capitalization.
As the broader crypto market watches closely for more discrepancies in the stablecoin dollar peg, financial firms like PayPal, have launched their own stablecoins.
Prominent platforms like Binance, and Huobi are already incorporating the new PYUSD into their crypto portfolio. In addition, monetary institutions like Visa are taking advantage of stablecoins like USDC to propel expansion into new markets.

Stablecoins from Circle and MakerDAO have been more unstable than those from Tether and Binance over the past couple of years, according to a new report from S&P Global.
The U.S. is far from making any decision on a central bank digital currency (CBDC), said Federal Reserve Vice Chairman Michael Barr, who described the Fed as still being in the “basic research” phase.

The policy paper includes recommendations for regulating activities related to stablecoins and decentralized finance (DeFi).
On-chain data from Santiment suggests that the stablecoin whale supply could be the metric to watch for the likelihood of a Bitcoin bounce.
In a recent post on X, the on-chain analytics firm Santiment discussed the percentage of the total stablecoin supply that the whales in the sector are holding right now.
The “whales” here refer to entities that are carrying at least $5 million worth of stablecoins in their addresses. Naturally, all stablecoins that are in circulation are included in this metric, regardless of their market caps.
“A tried and true method for predicting where crypto heads next is analyzing big wallets to see the ratio of stablecoins they hold,” explains the analytics firm.
Here is a chart that displays the data for the holdings of these humongous investors:
The reason that the stablecoin supply of this cohort may be relevant for the rest of the cryptocurrency sector is that it provides a look into the buying power available to these whales.
Generally, these holders use stables to store their capital away from the volatility of coins like Bitcoin, but once they feel that the time is right to jump back in, they deploy these fiat-tied tokens back into the other coins, providing a bullish boost to their prices.
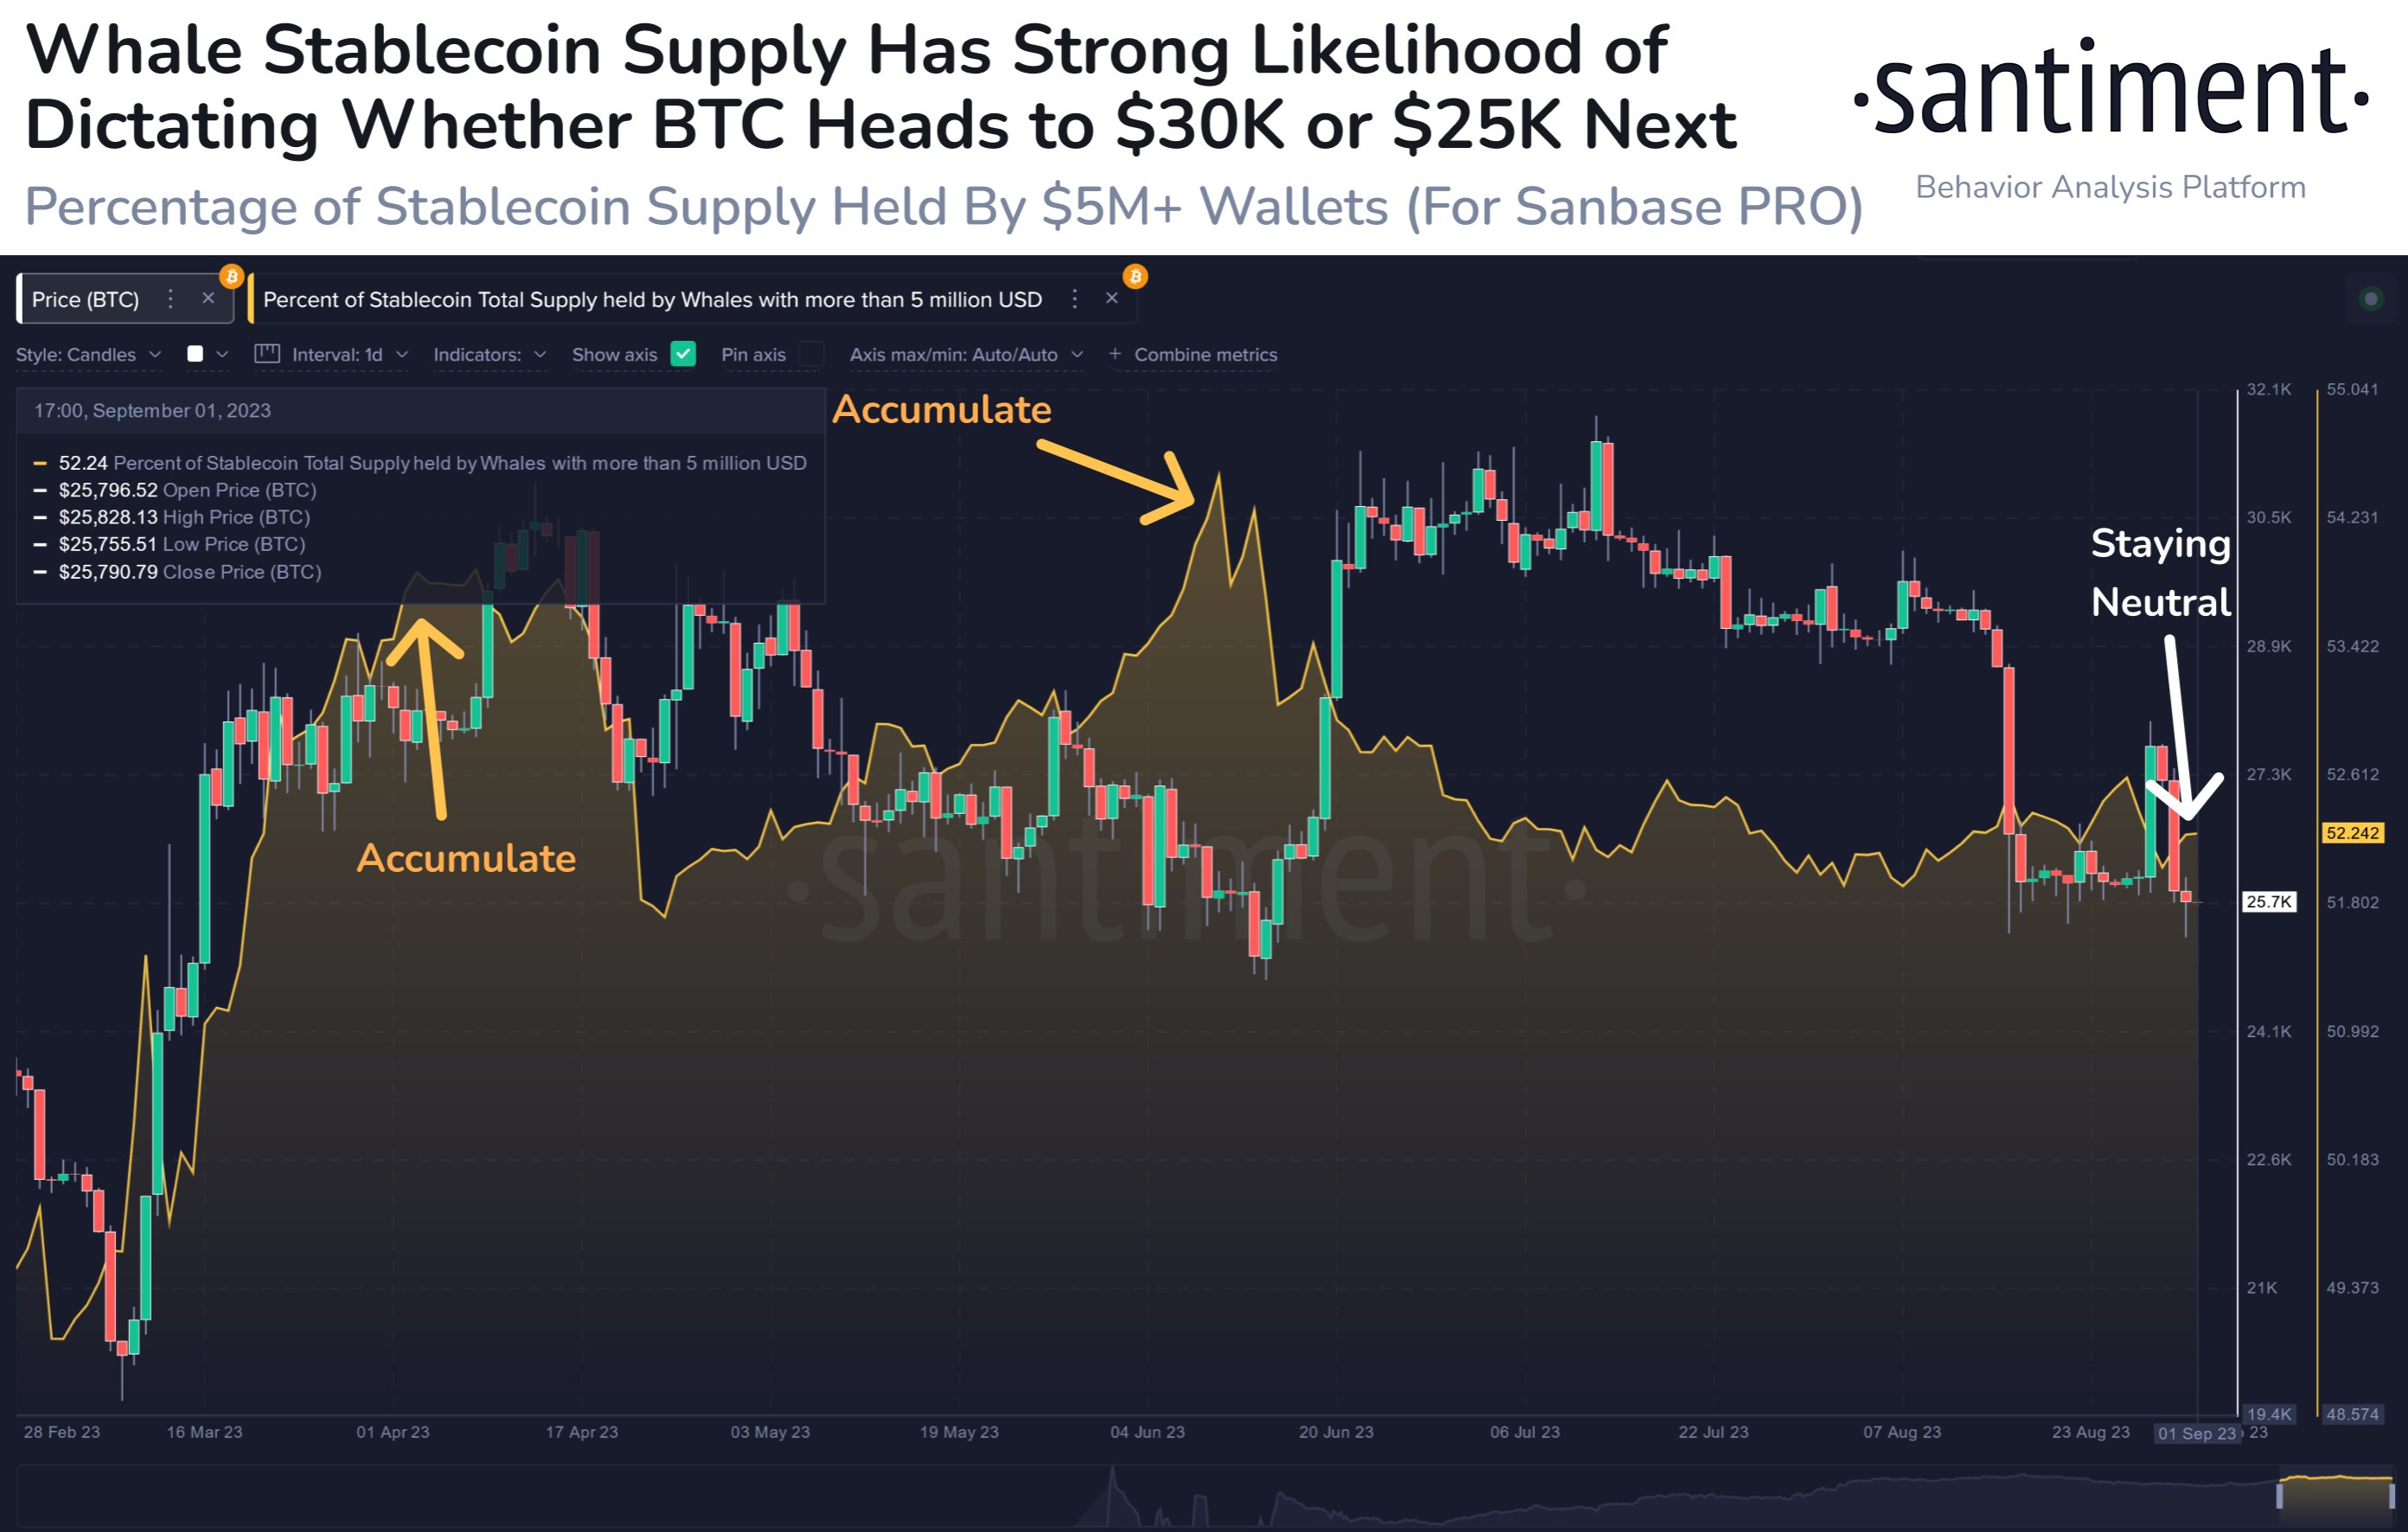
This can be seen working in action in the chart as well. Back in May-June, these investors had been accumulating, and once their supply had hit a peak and they had started distributing instead, the Bitcoin price had observed a rally.
Given the close timing, it would seem likely that the whales had been shedding their stablecoin holdings in order to buy assets like BTC, thus acting as fuel for the uplift.
As displayed in the graph, the stablecoin holdings of the whales haven’t changed much recently, suggesting that these investors haven’t been taking part in either accumulation or distribution.
This could indicate that the whales don’t have any extraordinary buying capacity currently. An uplift in this indicator, however, would imply that the purchasing power of this cohort is going up, which could then lead towards a rebound for the rest of the market.
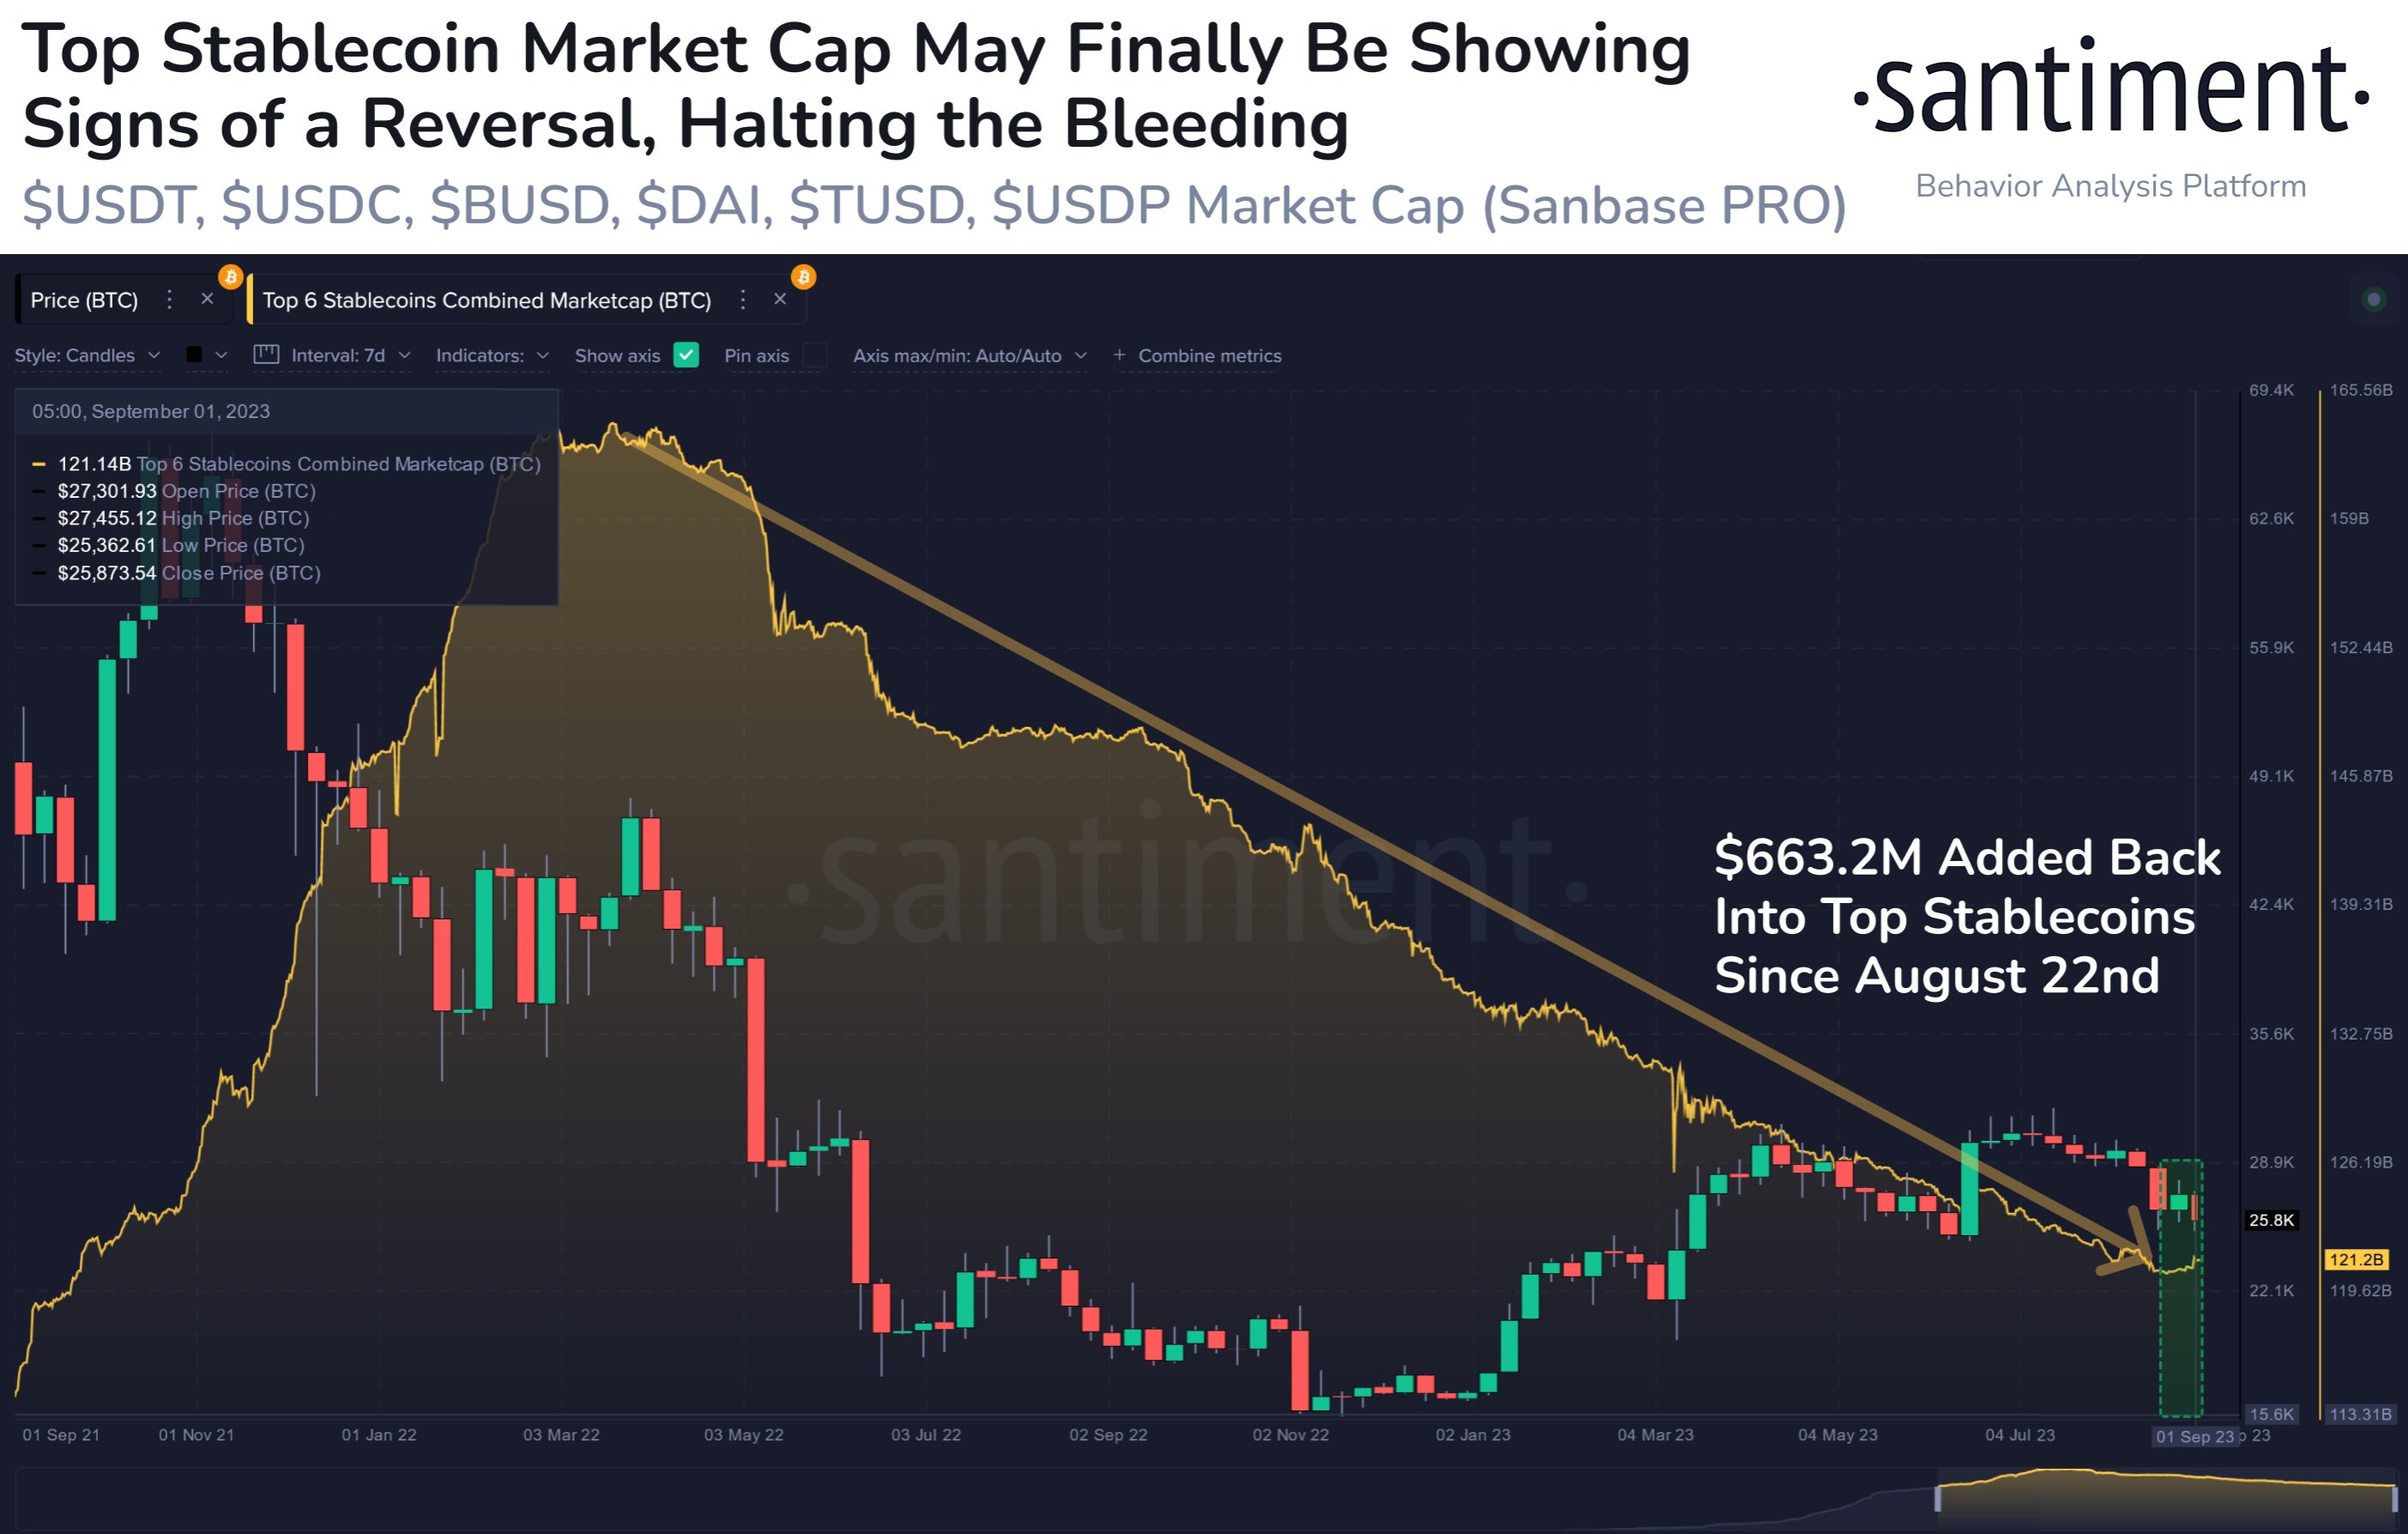
One positive sign forming in the market may be the fact that the market cap of the six largest stablecoins is slowly starting to turn around.
The combined market cap of these large stablecoins has been in a perpetual downtrend since early 2022, suggesting a constant drainage of capital from the sector. In the past couple of weeks, though, these fiat-tied assets have seen a combined growth of $663.2 million, which may be one of the early signs that a rebound could finally be taking place.
Such small rises in the metric have already been seen a few times during this downtrend, though, so this latest one might as well turn out to be a temporary deviation like those previous ones. If, however, this recent increase is indeed a sign that things are finally changing, then it would mean that the cryptocurrency sector is seeing some constructive growth at last.
Bitcoin hasn’t moved an inch in the last few days as the asset continues to move around the $25,900 level.
The trend in the total supply of the stablecoins may have hinted in advance that the Bitcoin rally wouldn’t last too long.
An analyst in a CryptoQuant Quicktake post explained that the latest news has been unable to make the stablecoins supply budge. The “stablecoins supply” here refers to the total circulating supply of all stablecoins in the sector.
Generally, investors use stables to escape the volatility associated with most coins in the rest of the cryptocurrency sector. Thus, whenever this metric rises, new tokens of the stablecoins are being minted because there is a demand for converting to them from the other assets or fresh demand is coming into the market.
Such investors who seek safety in these fiat-tied tokens usually do so because they don’t want to exit the cryptocurrency sector completely; they only require a temporary place to station their capital.
When these holders eventually find that the prices are right to jump back into the volatile coins like Bitcoin, they swap their stablecoins into them, thus putting buying pressure on their prices.
Now, here is a chart that shows the trend in the stablecoins supply over the past year:

In the graph, the quant has marked a specific correlation between the Bitcoin spot price and the stablecoin supply. It would appear that all the major increases in the former during the past year have come following rises in the latter metric.
There are three instances of this trend in this period: the first formed before the January rally, the second before the March rebound, and the third before the June surge.
From the chart, it’s apparent that the price increase in the asset wasn’t caused by the increases in the supply of the stables but rather the decline in them that followed afterward.
The increases in the supply of the stablecoins likely occurred because of fresh capital injections. When this new capital was deployed into Bitcoin and the others (when the indicator declined), the assets obtained the fuel for their rallies.
With the most recent rally in the asset instigated by the news of Grayscale’s victory against the US SEC, there was no such pattern in the supply of these fiat-tied assets.
This may have been one of the early signs that the rally wasn’t backed by constructive market growth, as the stablecoins supply has only been moving sideways. The Bitcoin retrace below the $26,000 level may have only been a natural consequence of this weak structure.
Bitcoin had earlier fully retraced the gains of the Grayscale rally, but it would appear that the decline isn’t over just yet, as the asset has now gone below the $26,000 level it had been at before the surge.
Usage has shown a low correlation with crypto exchange volumes, which suggests that significant stablecoin transaction volumes are likely being used for non-speculative purposes, the report said.
The market cap of BiLira’s TRYB token has increased more than 300% to $136.10 million, the second-highest among non-U.S. dollar-pegged stablecoins.
Num Finance already issues stablecoins pegged to the Argentine and Peruvian local currencies.
Terra Luna Classic (LUNC) has embarked on a six-month journey marked by a consistent downtrend, largely influenced by the gravitational pull of a so-called descending channel pattern. This pattern, characterized by successive lower highs and lows, mirrors an active market sentiment favoring sales during attempts at bullish rebounds.
Mid-August proved to be a pivotal juncture for LUNC as aggressive selling surged, triggering a precipitous plunge from $0.0000658 to $0.0000523. This swift and significant 34% drop led to a critical retest of the support trendline intrinsic to the falling channel pattern.
Interestingly, the coin’s value exhibited resilience through multiple instances of dynamic rebounds, translating to intermittent bullish bounces in its ongoing recovery phase.
Delving into the price analysis, the daily chart unfolded a compelling narrative with a long-tailed rejection manifesting at the lower boundary of the channel pattern, commencing on August 17. This occurrence effectively signaled an undercurrent of demand pressure. Capitalizing on this support, the price rebounded vigorously, propelling it upwards by 22%, currently resting at $0.0000638.
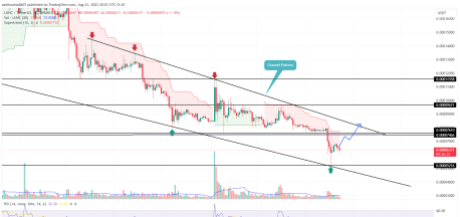
Should LUNC’s price sustain its position above $0.6 in the coming days, a beacon of hope emerges for buyers to potentially spearhead a rally of up to 25%, culminating in a rendezvous with the overhead trendline of the channel. Yet, the market’s true affirmation of a trend reversal hinges upon a more decisive signal: a bullish breakout from the resistance trendline.
In a parallel development, Terra Luna Classic’s validator, Nova, has unveiled a strategic initiative in response to a proposal that floundered amidst some challenges. The proposal, aimed at funding the Quant USTC repeg team, faced rejection within the Terra Luna Classic community.
As a result of the refusal of #LUNC validators to pay the $USTC Team for work that they delivered successfully, we will now be funding the USTC Team directly with our commissions in response to this breach of contract by validators.
If you want to fix the chain, please delegate.
— Nova (@NovaValidator) August 23, 2023
Despite a promising trajectory for Proposal 11716, which sought to financially support the Quant team for the month, some validators’ eleventh-hour “No” votes led to its downfall.
Consequently, Nova has stepped forward to finance the USTC repeg team, fostering a collaborative spirit. With an appeal for the community to align their interests and redelegate with Nova, a concerted effort seeks to bolster the USTC repeg mission and breathe renewed life into the Terra Luna Classic ecosystem.
The LUNC price on CoinGecko currently stands at $0.00006448, reflecting a 0.5% increase in the past 24 hours. Additionally, over the course of the past seven days, the LUNC price has experienced a decline of 4.8%.

As the Terra Luna Classic journey unfolds, the interplay of technical trends and community dynamics sets the stage for another chapter in the cryptocurrency narrative.
(This site’s content should not be construed as investment advice. Investing involves risk. When you invest, your capital is subject to risk).
Featured image from The Blade
Solana Pay, the payment protocol built on the Solana blockchain, is now plugged into e-commerce giant Shopify, allowing users to pay in USD Coin (USDC), the companies announced Wednesday.
The Centre Consortium, jointly managed by Circle and Coinbase, is being shut down and Circle is bringing issuance and governance of the USDC stablecoin in-house.
The exchange expanded its services in Canada earlier this week.