Cryptocurrency giants, bitcoin and ether, meanwhile, lost ground during the month.
The Agenda podcast chats with Energy Web on how to fight climate change with help of blockchain

Energy Web CEO Jesse Morris explains why blockchain can make “going green” more efficient, how fighting climate change is easier and why they are building on Polkadot.
Stellar, Ripple and Solana-Based Investment Funds See AUM Spike in July
The large gains began following Ripple’s partial court victory over the SEC in the middle of the month.
Ripple effect? Stellar (XLM) is catching up to XRP price gains

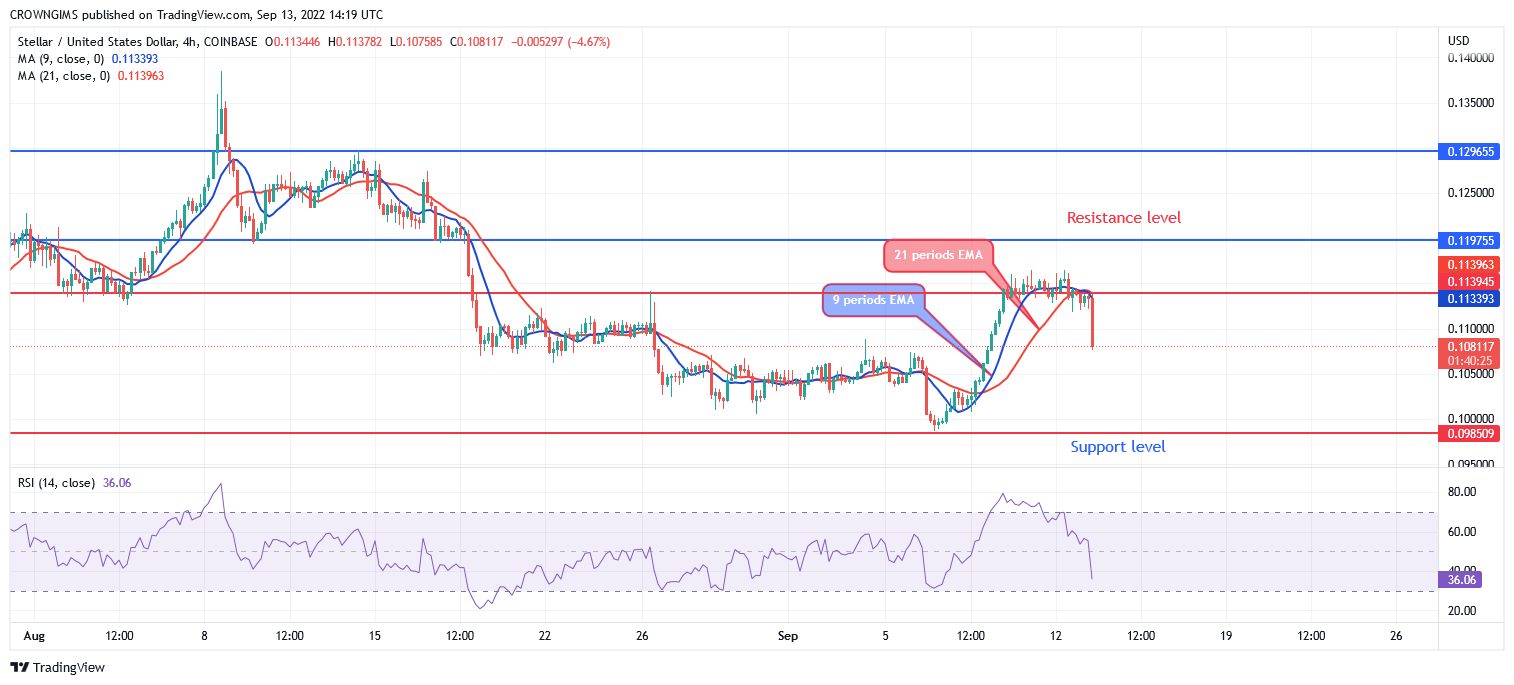
XLM has turned most overbought since April 2021, boosting risks of a 30% price decline by September.
Latin American Crypto Firm Bitso Joins Stellar Network to Boost International USDC Payments
Companies from all over the world will be able to make transactions to Argentina, Colombia and Mexico.
SOL, MATIC, ADA Tokens Surge Following XRP Ruling
A $1.4T Financial Giant Expands Its Money Market Fund on Polygon
Franklin Templeton claims that the fund will be the first U.S. registered mutual fund run on blockchain technology.
Bitcoin price holding $27K could open buying opportunities in BNB, ADA, XMR and TON

Altcoin prices have crumbled since BTC’s sharp pullback, but BNB, ADA, XMR and TON could be the first to bottom.
Bitcoin price sets up for an explosive move as ADA, XLM, AAVE and CFX turn bullish

BTC’s tight trading range hints at an eventual breakout, and ADA, XLM, AAVE and CFX could follow.
Stellar’s XLM bounces 15% two days after hitting record low versus XRP

XLM price is playing catchup to XRP’s March gains, quickly rising 25% versus the U.S. dollar while the XLM/XRP pair bounces from record lows.
Crypto Payments Specialist Stellar Bridges Fiat and Stablecoins to Polkadot

Stellar (XLM) Poised To Rally? Ukrainian Bank Reveals Successful E-Money Pilot
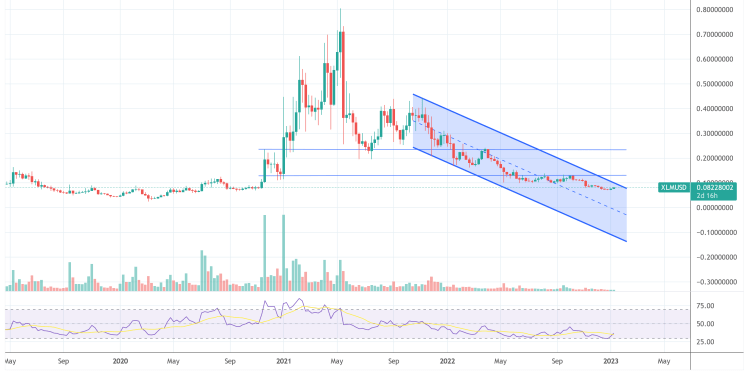
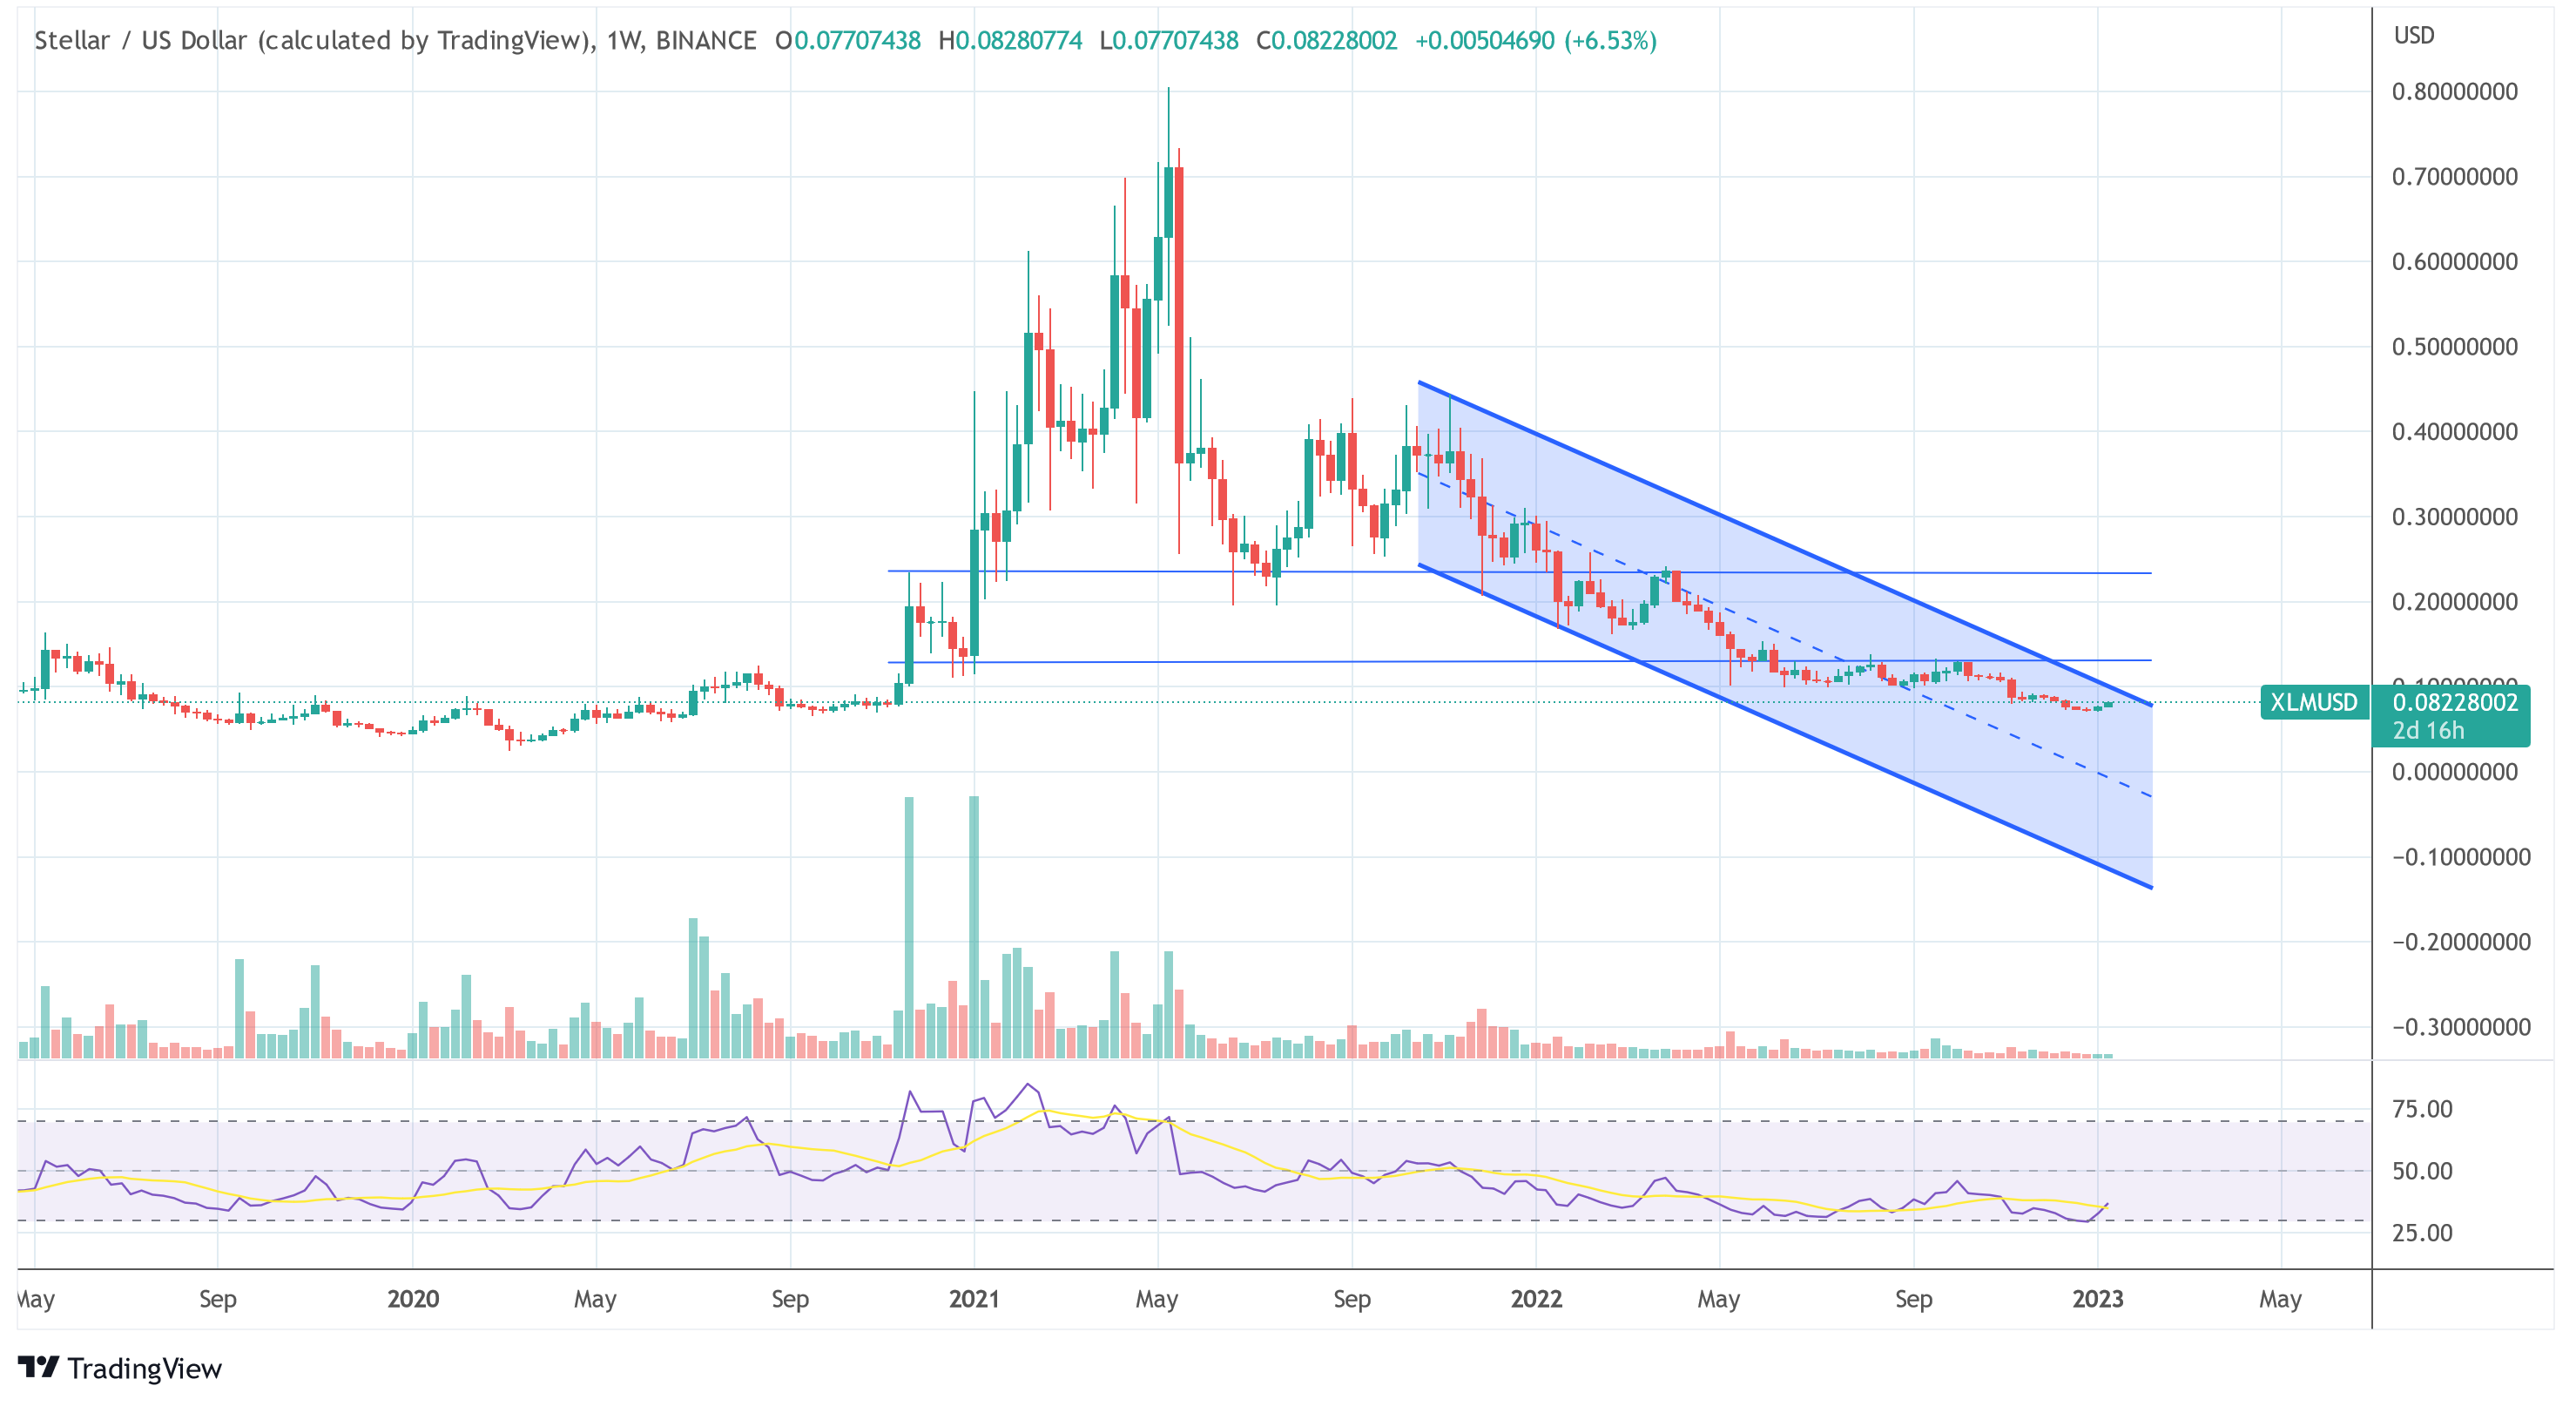
The Stellar (XLM) price remains in a long-term downtrend. After seeing an all-time high of nearly $0.81 on May 10, 2021, XLM’s price has fallen massively. Currently, XLM is 90.6% down from its ATH. Since October 2021, Stellar has also been in a descending trend channel.
At press time, XLM was trading at $0.0822. Thus, the price is showing initial signs of strength and could make a first attempt to break through the upper line of the trend channel at $0.10. What would probably be needed is a clear move that catapults the XLM price toward the next important resistance level at around $0.13.
Should this succeed, the XLM bulls could target the next resistance zone around $0.23.
Bullish News Pushing Stellar Out Of The Bearish Trend?
A potential catalyst for a breakout out of the bearish trend was provided yesterday by the Stellar Foundation. It shared in a tweet that TASCOMBANK, one of Ukraine’s oldest commercial banks, published the results of its e-money pilot project on the Stellar network.
Remarkably, TASCOMBANK is one of the leading Ukrainian commercial banks, which is regarded as a system bank. It operates in many areas of banking, including consumer and corporate lending, factoring, e-commerce, and trade finance.
The report on the project, which was launched in December 2021, informs the National Bank of Ukraine and the Ministry of Digital Transformation about the benefits of issuing e-money on the Stellar blockchain, highlighting the advantages.
Transparency, accountability, and low transaction costs were among the many cited benefits of blockchain in a report by @tascombank.
During their Pilot, one of Ukraine's oldest banks cited the future of e-currency on Stellar as "promising"https://t.co/SSGkUdONNi
— Stellar (@StellarOrg) January 12, 2023
As stated in a Stellar Foundation blog post, TASCOMBANK praises the blockchain’s transparency, security, and confidentiality of customer data, low transaction costs, instant payment functionality, and high throughput “at each stage of development, from conducting operations to testing”
The goal of the project was to test the issuance of e-money, focusing on peer-to-peer and merchant payments, as well as payroll. Sergii Kholod, First Deputy Chairman of the Board of TASCOMBANK, commented:
As part of a pilot project we explored a new way of issuing and managing electronic money which could be a new generation means of payment for the citizens and organizations of Ukraine, their employees and clients, government institutions, and international organizations.
Speaking about the pilot project, Oleksii Shaban, Deputy Governor of the National Bank of Ukraine, said that there are “still many hypotheses” that need to be investigated in the pilot project. However, he expressed that the pilot results are an important basis for use at commercial and central banks.
Oleksandr Bornyakov, the Deputy Minister of Digital Transformation of Ukraine, also revealed that his ministry and TASCOMBANK are currently examining “the approaches to further rollout of blockchain-based payment instruments.”
Stellar partners with UNHCR to give Ukrainian refugees cash via USDC

One new project attempts to help bankless Ukrainian refugees, while another hopes to streamline international Red Cross projects.
Stellar (XLM) Could Grow Dim This Week, But Buyers Don’t Need To Back Down

Stellar (XLM), the 27th ranked cryptocurrency in terms of market capitalization, managed to pump its spot trading price by 2.1% over the last 24 hours.
At press time, according to tracking from Coingecko, the asset is changing hands at $0.112 and has been down by 3.3% and 4.4% on is biweekly and monthly charts, respectively.
Here’s a quick look at XLM’s performance:
- Stellar has once again fallen into a bearish price pattern
- XLM needs to sustain and surpass its current trading price of $0.112 to break from its downward trend
- Stellar forecasted to drop to $0.085 over the next 30 days
The altcoin suffered when it failed to move past the $0.13 resistance marker and fell into a pattern that indicates further downward trend.
XLM’s technical indicators and analysis hint at a continued exposure to negative factors that will prevent it from climbing to higher levels over the next few days.
Repetitive Rejection On Crucial Levels Cripples Stellar
Since the middle part of June, the altcoin was trading at a narrow range of $0.10 and $0.13. XLM tried to test and surpass the aforementioned resistance level but was unsuccessful.
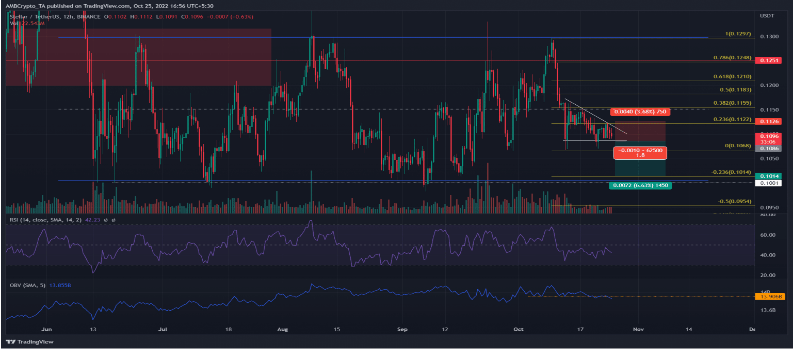 Source: TradingView
Not only that, it also failed to sustain the crucial support marker of $0.125. As a result, in just two days, the asset declined by 12%. That, however, was erased by its recent price pump.
Stellar’s Relative Strength Index (RSI) is below the 50-neutral zone but it hasn’t reached the point of being overbrought or oversold.
While buyers might seem to be discouraged by these bearish signals, there is a possibility that the downtrend thesis will be invalidated.
This will happen if XLM manages to surpass the $0.112 range. Failure to do so, however, might result to a steep fall all the way down to $0.101.
XLM Price Forecast
According to Coincodex, Stellar has 17 technical indicators that are sending bearish signals while 15 were leaning towards bullish signs.
With this, the crypto is forecasted to slightly increase its trading price to $0.113 over the next five days. The next 30 days, however, will be painful for holders as the altcoin is seen to plummet all the way down to $0.085.
There is also significant level of fear towards the asset as it scored 33 on the Fear and Greed Index. XLM is also facing a high yearly inflation rate of 5.44%.
It has been trading below the 200-day simple moving average and has not shown any signs of performing better anytime soon.
Still, just like with any other cryptocurrency, it is not immune to the volatility of the crypto space so its price can also go high as fast as it goes down, and vice versa.
XLM total market cap at $2.8 billion on the daily chart | Featured image from National Review, Chart: TradingView.com
Disclaimer: The analysis is based on the author’s personal knowledge and should not be construed as investment advice.
Stellar (XLM) Buyers Must Check Out These Data Before Going Long

Stellar is one of the cryptocurrencies that had an interesting and fruitful 2021, perhaps why the altcoin is making positive noise these days for being a viable asset for long trading.
- Stellar could enter a dull phase on the coming sessions
- XLM is -10.1% over the past week
- Stellar is on an extended bearish momentum
In crypto space, long trading involves buying an asset and making profit as its price increase. On the other hand, short trading happens when one sells a borrowed security and buys it back at a lower price, making income from the decreased value.
Stellar is hot in the eyes of investors looking to earn from long trading as the digital currency’s current price is significantly lower than its 2021 levels.
Given the virtual coin’s ability to increase its price tremendously, its easy to understand why investors might pick Stellar for their long trading scheme.
But, as with other ventures, it would be wise to pay close attention to XLM’s price movement first, before putting sizable investment on it and deciding to play the long game.
Stellar Price Analysis and Trajectory
After a spectacular showing in May 2021 when it attained multiple yearly highs, Stellar has fallen into a gradual bearish rally and is positioned in trendline resistance for over 17 months now.
Source: TradingView
At press time, data from Coingecko shows the crypto is trading at $0.113 and is down by 10.1% over the past week. On a year-to-date comparison, Stellar is – 68.8%.
The bearish momentum of the crypto market hit XLM very hard as its price fluctuates between $0.09 and $0.1 which has been its support range for the past 22 months.
As different metrics such as 20 and 50 EMA and Relative Strength Index indicating the asset could be looking at a dull phase in the coming sessions, investors looking for long trading might have problem gaining the kind of profit they expect.
Stellar’s Superb 2021 Showing
As mentioned earlier, XLM had an impressive run in 2021, ending up as one of the most watched out digital assets of the year.
After starting 2021 with a price of $0.133, the crypto wasted no time as it increased its value by 224% during the first week of January to trade at $0.432.
The following month, Stellar successfully completed a bullish rally as it hit $0.6. But the asset wasn’t immune to the volatility of its space, as it experienced price dump before bouncing back on April 14 when it changed hands at $0.689.
The month of May proved to be even better for the crypto, as it notched a higher trading price of $0.791 on the 17th.
But Stellar suddenly appeared to have used up all its momentum as its price declined over the months that followed.
XLM total market cap at $2.9 billion on the daily chart | Featured image from CoinLive, Chart: TradingView.com
Disclaimer: The analysis represents the author’s personal views and should not be construed as investment advice.
Crypto Biz: $470B bank enters crypto — Probably nothing, right?


Another major financial institution has signaled its intent to offer Bitcoin and Ether services to its clients.
Stellar Soars 6% In Last 30 Days – Can XLM Keep On Shining This Week?

Since the beginning of this month, Stellar (XLM) has increased by 6%, continuing its remarkable monthly performance. Coingecko reports a 4-day performance for XLM of 5.3%, while charts show an impressive 31.50% rise over the previous 30 days.
This price change is even more unexpected when considered in light of this. Santiment recently took to Twitter to reveal a rather unsettling image for the cryptocurrency community.
“There has been quite a lot of #bloodinthestreets. Unless your portfolio mainly consists of $BNB, $XLM, $QNT, $MKR, $HT, or other scarce positive #altcoins the past 30 days, you’re down. This reflects in the shrinking group of individuals still interested in #cryptocurrency,” Santiment tweeted.
There has been quite a lot of #bloodinthestreets. Unless your portfolio mainly consists of $BNB, $XLM, $QNT, $MKR, $HT, or other scarce positive #altcoins the past 30 days, you’re down. This reflects in the shrinking group of individuals still interested in #cryptocurrency. pic.twitter.com/4t0GQXj9oG
— Santiment (@santimentfeed) October 10, 2022
The question of whether or not XLM can sustain its recent gains is intriguing. In spite of this, a rise of this magnitude is usually followed by a severe reversal as investors’ fears replace their excitement.
Stellar: What The Indicators Suggest
There are a number of signs to keep an eye on. And by “indicators,” it means the CMF, momentum, and bull-bear power. These metrics reveal the direction of the market, and the recent price surge has not yet altered investor opinion about the token.
Chart: TradingView
The money flow index of Chaikin is still heavily bearish, although bulls are testing a breach towards the positive top half. According to the bull-bear power indicator, bears have lost considerable impetus. This is related to the price increase during the past month.
The momentum indicator revealed a modest increase in bullish momentum followed by a slight decline. We may infer that buying enthusiasm for the cryptocurrency is currently high, but purchasers should be warned that a drop may occur in the coming days or weeks.
Slowing Down The Decline
The current rise is supported by the $0.0996 support line, which has halted the crypto market decline from May to June. This has served as the base from which the bulls have leveraged the current rally. Currently, the market is still being supported by the bulls.
As evidenced by the persisting pullbacks in XLM’s price, the current price action indicates that the correction phase is still in its infancy and that bulls continue to rule the market.
As of the time of writing, the token is trading in the green and may rise again following earlier pullbacks and a minor price decline.
XLM market cap at $2.9 billion on the daily chart | Featured image from Steemit, Source: TradingView.com
Stellar Development Foundation launches $100M fund to support native smart contract adoption


The Soroban Adoption Fund incentivizes developers to begin building products and tools on the new smart contract platform.
UFC fighter El Ninja to become first argentinian athlete paid in crypto


Beyond the Octagon, Guido Cannetti fights Argentina’s 78% inflation rate with USDC stablecoin.
Stellar Price Moves To A Lower Level, Can The Bulls Defeat This Resistance Mark?
Stellar price has continued to travel south over the last 24 hours. On the last day, XLM lost more than 6% of its market value.
Stellar has recorded positive price sentiment recently, owing to an update that spread optimism across the XLM community.
In the latest update, Stellar users can now transfer USDC and Stellar Lumens via email. Despite the update, technical indicators have sided with the bears on the one-day chart.
The buying power has fallen considerably, even though the number of buyers is greater compared to the number of sellers.
In the last week, Stellar price went up close to 7%. However, at press time, the bulls look exhausted. The present support zone for XLM stands between $0.111 and $0.106, respectively.
A fall from the $0.106 mark will lead the Stellar price to touch the $0.99 price mark.
Broader market support will be necessary for most altcoins to recover. If buyers don’t pick up momentum and XLM doesn’t topple above the 20-SMA, then the altcoin is in for a further drop in price.
Stellar Price Analysis: One Day Chart
Stellar was priced at $0.112 on the one-day chart | Source: XLMUSD on TradingView
XLM was trading at $0.112 at the time of writing. The coin could not hold onto its weekly gains and fell on its chart as a result of declining buying strength.
It is important for the bulls to defend Stellar at the $0.111 level, else Stellar price could drop down to $0.106. Once the coin touches the $0.106 mark, it could also fall near the $0.99 level.
Overhead resistance for the coin stood at $ 0.116. A move above that level could push the coin to $0.119. The amount of Stellar traded in the past trading session declined, indicating a fall in buying strength.
Technical Analysis
Stellar registered a decline in buying power on the one-day chart | Source: XLMUSD on TradingView
XLM was still not in the excess selling territory, but if buyers continue to decline, sellers will soon take over.
Stellar has had a good past week, but the bulls failed to move past the $0.116 resistance mark, causing the coin to depreciate in price.
The Relative Strength Index was right on the half-line, and that is an indication of an even number of buyers and sellers.
A fall in demand will immediately push the price of Stellar below the 20-SMA line. This would mean that the sellers were driving the price momentum in the market.
Stellar indicated buy signal on the one-day chart | Source: XLMUSD on TradingView
There could be a chance for Stellar to redeem its price given that XLM continued to display a buy signal on the one-day chart.
The Moving Average Convergence Divergence measures the price momentum and the overall price direction of the altcoin.
The MACD continued to form green signal bars that correlate with the buy signal for the coin. Although the green histograms were declining on the chart as a sign of increased selling strength, sellers had not taken over yet.
The Parabolic SAR displays the price action of the altcoin. The dotted lines below the price candlestick mean that XLM could rise on its chart again with sustained demand.
Featured image from Personal Financial, Chart: TradingView.com


