The brokerage firm lifted its rating on the crypto exchange’s shares to market perform from underperform.
Bitcoin On The Brink: Is A “Big Move” Imminent?
The state of Bitcoin (BTC) price action across multiple time frames has analysts at the edge of their seats. As of February 7, various technical formations suggest that the leading crypto appears poised for a critical breakout from the current consolidation.
Is Bitcoin Preparing For A Big Move?
Taking to X, Mags thinks Bitcoin is in for a “big move,” considering the candlestick arrangement in the weekly chart. The analyst notes that prices have been moving horizontally in the past nine weeks, falling within the expected range.
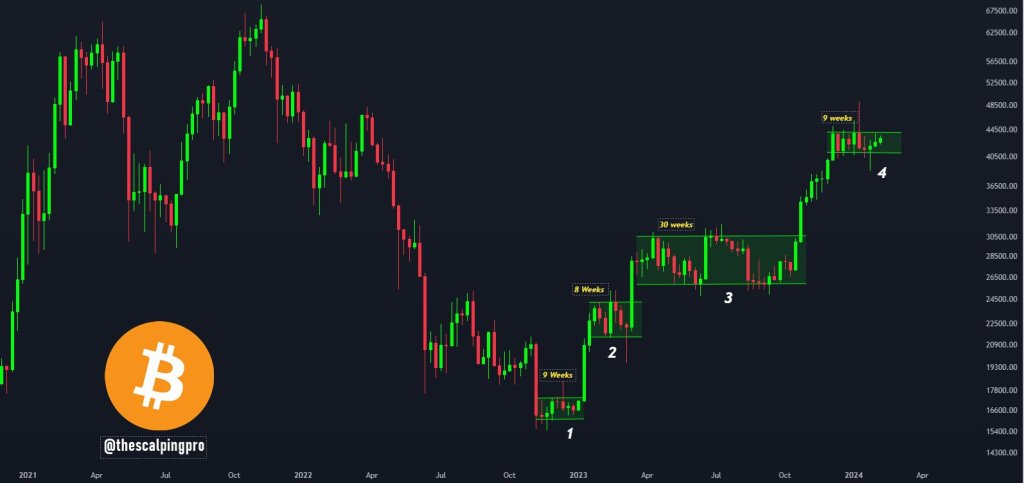
The Bitcoin market has ranged between 8 and 30 weeks in the past. So far, the current consolidation has lasted for nine weeks. Amid this, Bitcoin prices have tested both sides of the range with notable “fake-outs.”
In light of the current state of affairs in the Bitcoin market, Mags is confident that the prolonged consolidation suggests that the coin, guided by history, could edge higher.
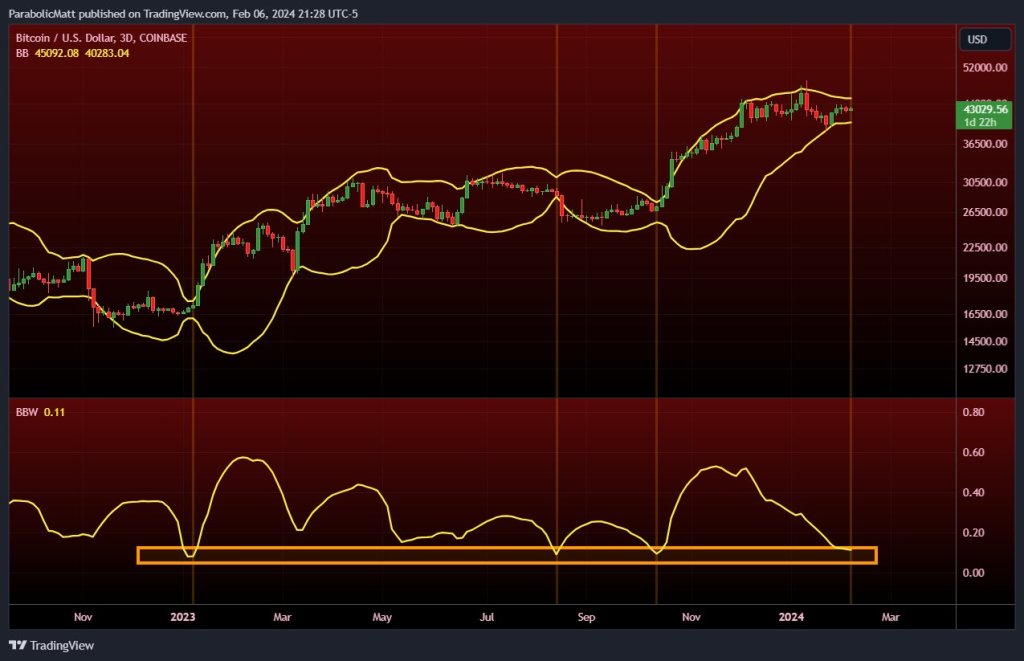
Beyond the ranging market, another analyst notes that the Bitcoin 3-day Bollinger Bands, a technical indicator that measures volatility, is narrowing. The squeeze, the trader notes, is at historical levels, often followed by a breakout. However, as it is, how prices will evolve in the weeks and months ahead remains uncertain.
Adding to the intrigue, Jason Goepfert on X points out that the S&P 500, a stock market index, is currently within 0.35% of its 3-year high. The uptrend is clear even though less than half of all stocks constituting the index are trading above their 10-day moving average.
At the same time, less than 60% are above their 50-day moving average, and fewer than 70% are above their 200-day moving average. This rare confluence suggests that the financial market could be at a critical turning point, possibly impacting crypto.
Eyes On Spot ETF Issuers And United States Federal Reserve
Only time will tell whether Bitcoin will rally or tank from spot rates. However, what’s evident is that the Bitcoin uptrend remains clear, with fundamentals aligning to support optimistic bulls. To illustrate, spot Bitcoin ETF issuers are buying more coins from the market. At the same time, the excitement around the upcoming Bitcoin halving event is adding fuel to the optimism.
The broader market is also watching the United States Federal Reserve. Market consensus is that the central bank will slash interest rates in March 2024 and embark on quantitative easing. With more money circulating, some will find their way to Bitcoin, driving prices to record highs of $69,000 or beyond in the coming months.
Bitcoin Correlation To Nasdaq Continues To Be Negative: What It Means
Data shows the Bitcoin correlation to the Nasdaq has continued to be negative since December. Here’s what this means for the cryptocurrency.
Bitcoin 60-Day Correlation To Nasdaq 100 Is Negative Right Now
In a new post on X, the analytics firm Kaiko has discussed what the trend in the correlation between BTC and Nasdaq has looked like recently. The “correlation” here refers to a metric that keeps track of how tied together the prices of two commodities have been over a given period.
This period can naturally be of any length, but in the context of the current topic, the 60-day correlation is of interest. This indicator version measures the prices’ dependence on each other during the past two months.
When the value of this metric is greater than zero, it means that the price of one asset has been reacting to the other by moving in the same direction. The closer the indicator is to one, the stronger this relationship.
On the other hand, values under zero suggest some correlation between the two assets, but it has been a negative one. This means that the assets have reacted to each other by moving in the opposite direction. In this case, the extreme point is -1, so the closer the indicator is to this mark, the stronger the correlation between the prices.
Lastly, the correlation being exactly zero implies that there is no correlation whatsoever between the two assets. In mathematics, such a condition occurs when two variables are independent.
Now, here is a chart that shows the trend in the 60-day correlation between Bitcoin and Nasdaq 100 over the past year:
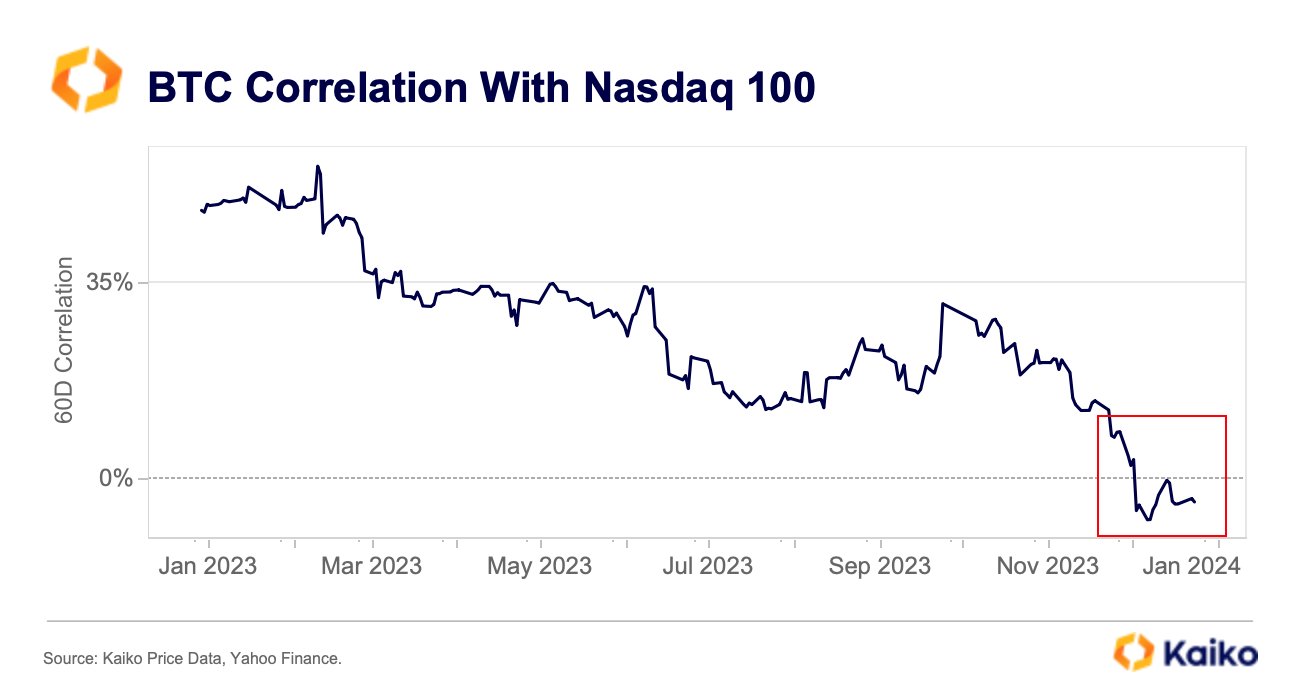
As the above graph shows, the 60-day correlation between Bitcoin and Nasdaq is shown in percentage here, with 100% corresponding to a value of 1.
From the chart, it’s apparent that the metric’s value was in a state of overall gradual decline during 2023, up until the final couple of months of the year, when the metric took an especially sharp dive.
Some amount of positive correlation had existed between the two assets before this plummet, but following it, the 60-day correlation took to negative values. However, the indicator remained close to the 0% mark, implying that the two only had a slight negative relationship.
The correlation had started surging and reached almost exactly 0% for a brief period just earlier, but the metric has since again come down and assumed slight negative values.
It would appear that BTC has kicked off 2024 slightly, moving against the traditional markets, which could set the stage for the cryptocurrency to go on and explore its territories this year.
BTC Price
At the time of writing, Bitcoin is trading around the $44,800 mark, up over 5% over the past week.
Coinbase, Marathon stocks surge as Bitcoin lights ‘fire in the cauldron’

The anticipated Bitcoin halving and potential ETF approvals have lit “some serious fire in the cauldron” for crypto, said Zerocap investment chief Jon de Wet.
Coinbase, Marathon stocks surge as Bitcoin lights ‘fire in the cauldron’
The anticipated Bitcoin halving and potential ETF approvals have lit “some serious fire in the cauldron” for crypto, said Zerocap investment chief Jon de Wet.
Robinhood (HOOD) Extends Trading Services To The UK
Robinhood, a major player in the United States financial technology industry is set to stretch out its trading services in the United Kingdom for the purpose of growing its business globally.
Robinhood To Offer US Stock Trading In the UK
Co-founder and Chief Executive Officer (CEO) of Robinhood Vladimir Tenev confirmed the expansion toward the UK sector in an interview with Bloomberg. According to the CEO, the expansion aims to bring the US stocks into the UK market.
The CEO stated:
The intention is, for the U.K. market, Robinhood to be the best place to invest U.S. stocks, U.S. dollars, and we believe we can fill that need better than anyone else.
Tenev noted that the company plans to gradually extend its platform to all users in the United Kingdom in early 2024. With the launch, consumers in the UK market will be able to trade 6,000 equities in the US market.
The CEO further asserted that a waitlist has been made available to people who wish to gain early assess to the app. Furthermore, the platform’s launch in the UK is under the Financial Conduct Authority (FCA) regulation.
Additionally, the platform offers users features like a five percent interest, and can change their uninvested funds from pounds to dollars. These offers aim to attract a larger range of investors, particularly those with little financial resources.
Robinhood’s expansion sparks wider growth for its business globally. The CEO explained, “I aspire for Robinhood to be a global company. That’s been the plan from the very beginning. Baiju and I started this company as immigrants and children of immigrants, and so, the idea of making our services […] available to anyone in the world is just the vision that I had in mind from the very beginning.”
The company’s entry into the UK market also puts it in direct competition with national and international companies. These include companies like Public.com, based in New York, Revolut, and Freetrade, among others.
Zero – Fee Trading Initiative
The CEO also underscored the platform’s commitment to offering Zero-Fee trading and accessible trading alternatives for UK users. This initiative is similar to the effective charge reduction strategy that was put in place in the US before the epidemic.
Notably, Robinhood does not demand any commission fee for buying and selling stocks on the platform. Due to this, individuals can start creating their investment portfolios with a minimum of one US dollar (79p).
Tenev explained:
So we are launching imminently to the initial set of customers in the UK, and what we are launching is a commission-free share trading of US stocks.
With its zero-fee trading strategy, the platform’s introduction into the UK market will completely change how average investors interact with the stock market.
Also, with its focus on technology and user-centric features, the platform is poised to impact the current market. It will also bring fresh energy to the UK investment landscape.
Warren Buffett’s ‘crypto stock’ beats Apple and Amazon — but not Bitcoin

Buffett’s bet on crypto-friendly Nubank has put Berkshire Hathaway $130 million in profit already this year.
Warren Buffett dumps $13.3B in stocks — A warning sign for Bitcoin and risk-assets?

The “Oracle of Omaha” has increased Berkshire Hathaway’s cash holdings by $2 billion in Q1, signaling his decreasing confidence in risk-assets.
Bitcoin Up After Fed Rate Reveal, Correlation With Stocks Over?
Bitcoin has surged above the $29,000 mark following the Fed rate hike of 25 bps, a sign that the asset may be decoupling from the stocks.
Bitcoin Has Jumped Despite Fed Interest Rate Hike Announcement
According to the on-chain analytics firm Santiment, the cryptocurrency market has shown some promising rise potential since the rate hike announcement has gone live.
In the past year, the US Federal Reserve System (“Fed”) interest rate hikes have generally been met with panic in the market, as coins like Bitcoin and Ethereum have suffered significant hits to their prices following them.
This has been because the sector has experienced a high correlation with the US stocks during this period, meaning that the prices of the assets in the two sectors have been moving in a similar fashion.
Recently, however, things have been changing for the better, as the cryptocurrency and stock markets have become increasingly separated. The initial reaction in the prices of assets like Bitcoin and Ethereum to the latest announcement has also been a positive indication of this.
Here is the comparison between BTC, ETH, and S&P 500 that Santiment posted one hour after the FOMC meeting:
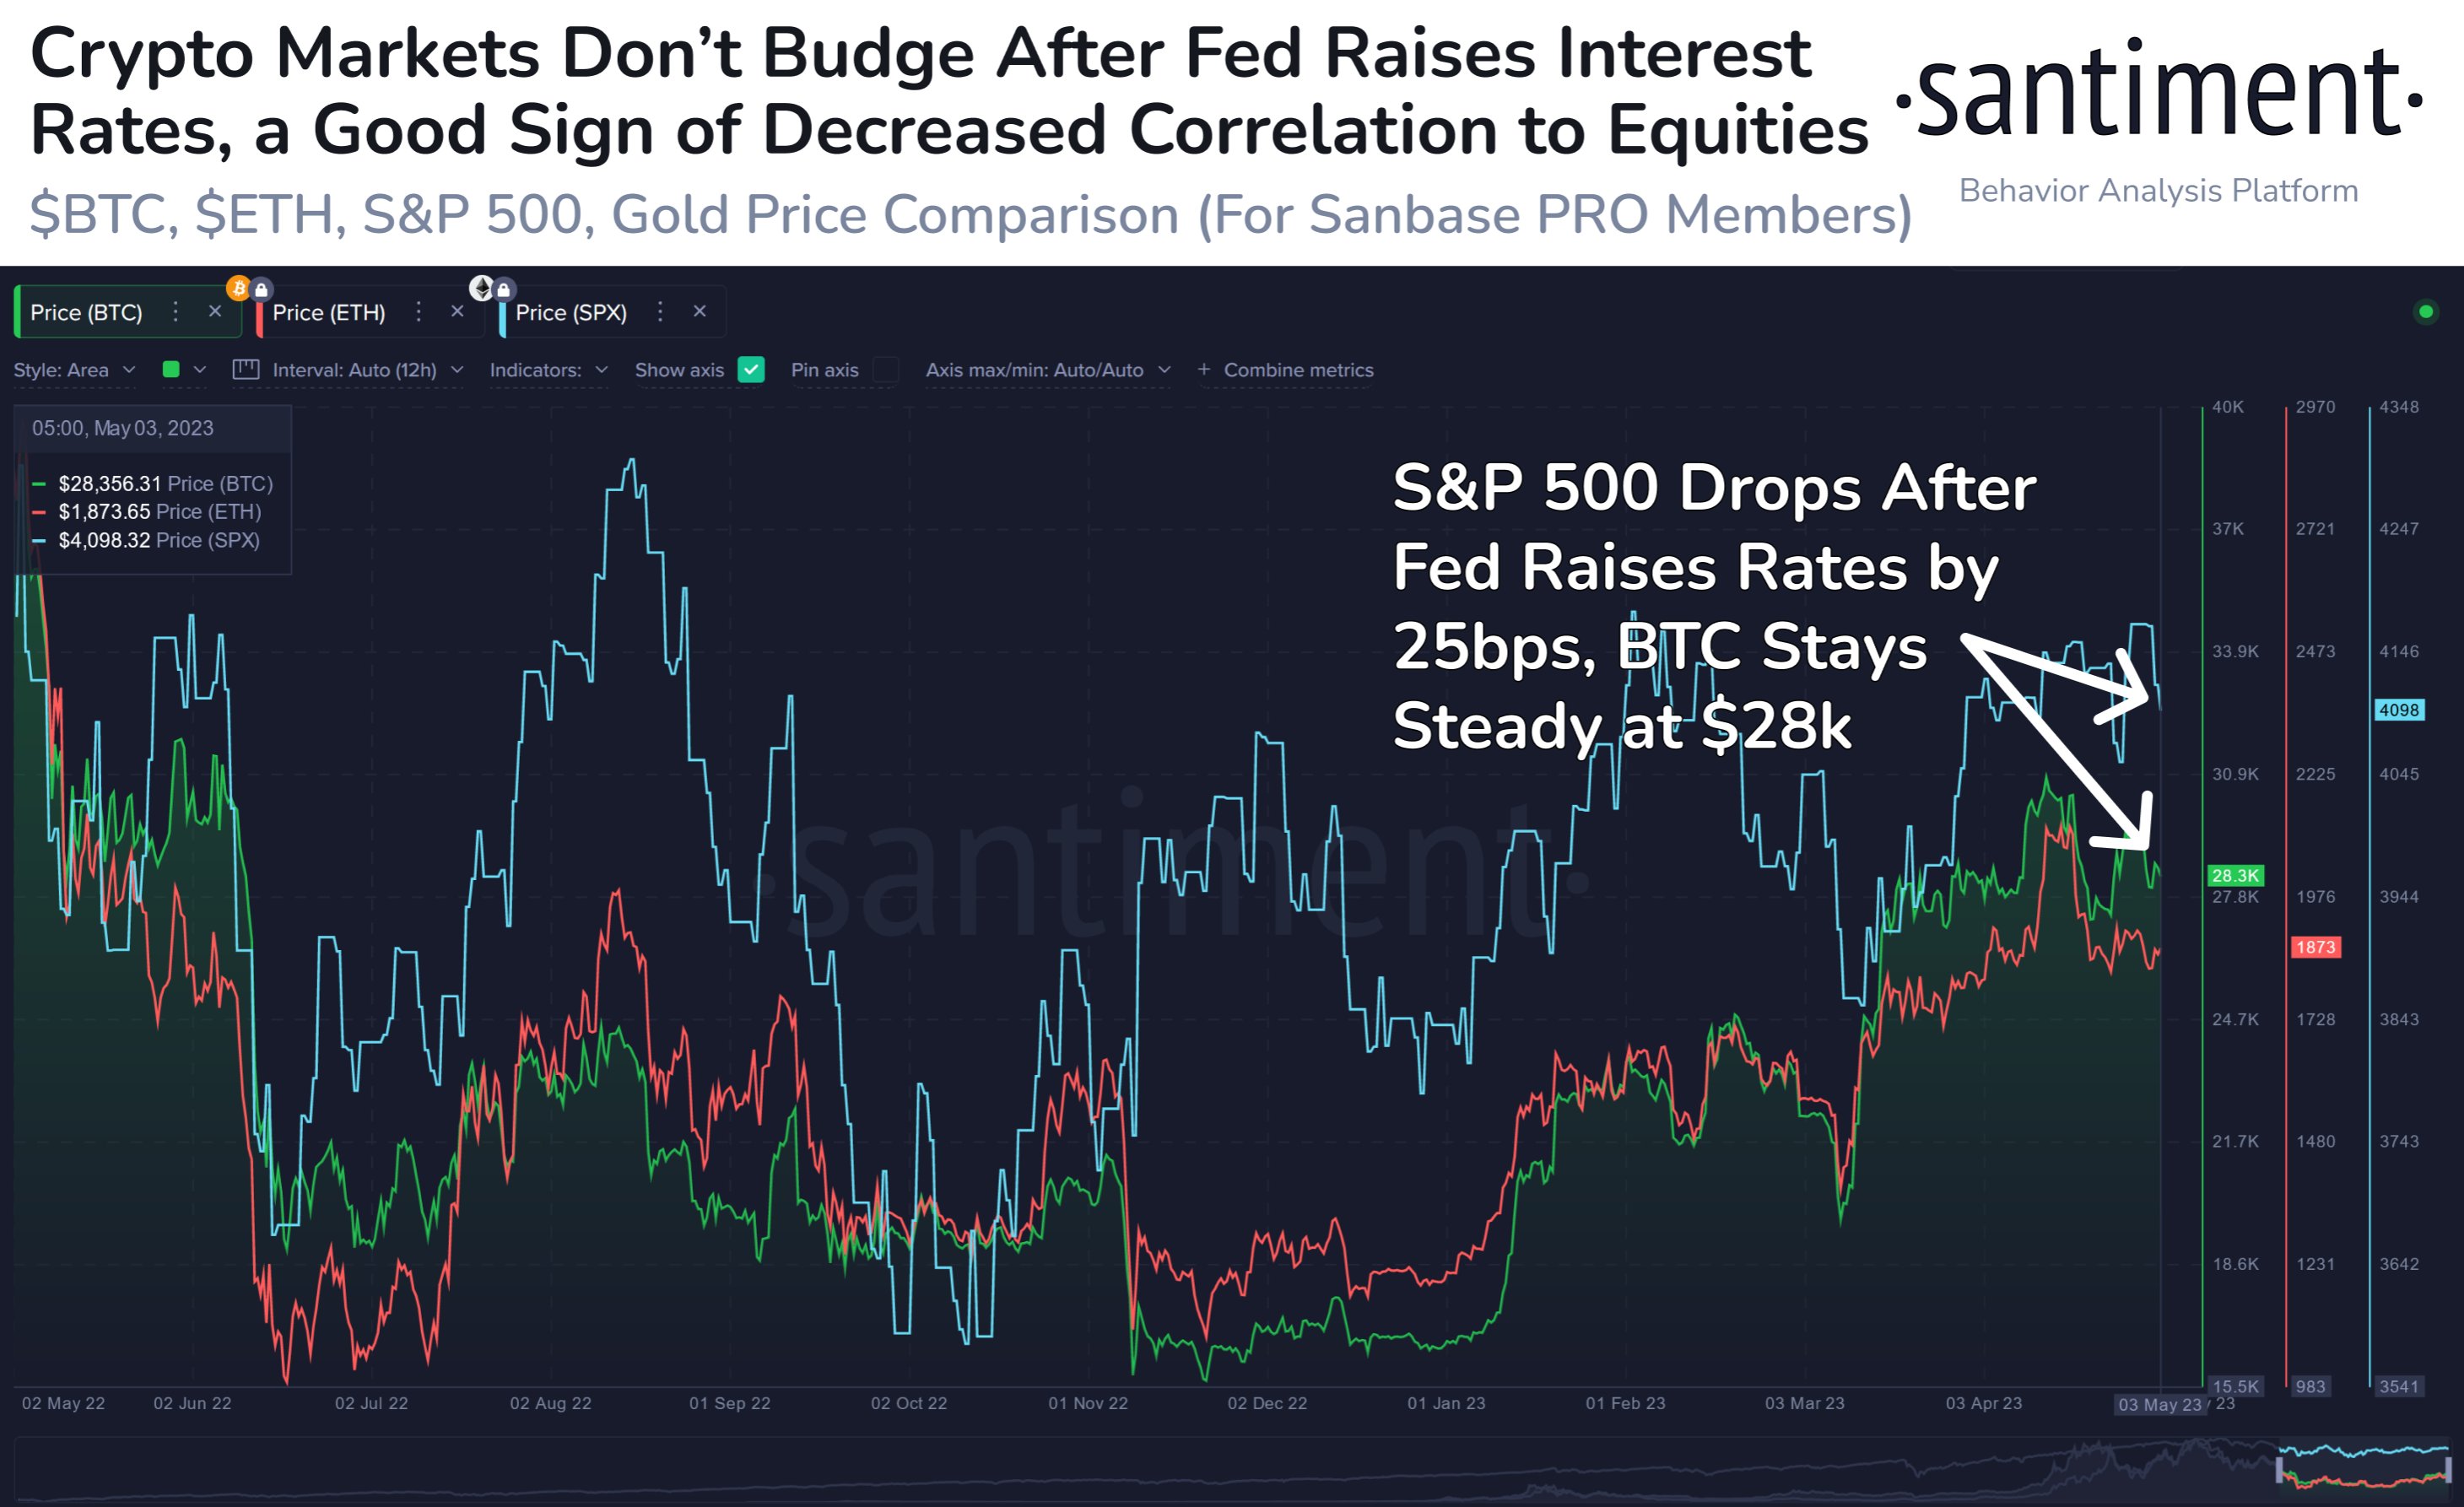
As displayed in the above graph, S&P 500 fell shortly after the rate hike, while BTC and ETH remained steady, showing the disconnection between the two sectors.
Both Bitcoin and Ethereum have risen in the hours since then, breaking the $29,000 and $1,900 levels, respectively. This could be a sign that investors are at ease now that the meeting is behind them.
“At least for now, it seems that the initial reaction to this interest rate hike was: “At least it’s over with now. Crypto no longer needs to worry about fiscal policy until June,” notes Santiment.
On-chain data also shows that the trading volumes of the top cryptocurrencies by market cap have trended up since the meeting, an indication that activity has been increasing in the sector.
Another indicator, the “active addresses,” which measures the daily total number of unique addresses that are taking part in some transaction activity on the Bitcoin blockchain, has also observed a surge following this Federal Open Market Committee (FOMC) meeting day, as the below chart highlights.

This metric provides an estimation of the total number of unique users that are using the network right now, so its value going up suggests a high amount of traffic has visited the chain during the past day.
The latest spike in the Bitcoin active addresses is the highest seen in the last two weeks, with the one from two weeks ago being mostly due to a sharp plunge in the price.
“This rally seemed to be much more related to the rate hike finally being official, and you can see how active addresses pushed even higher directly after the announcement,” explains the on-chain analytics firm.
BTC Price
At the time of writing, Bitcoin is trading around $29,200, up 1% in the last week.
What Fat Tails and Revolutionary Ages Mean for Digital Assets
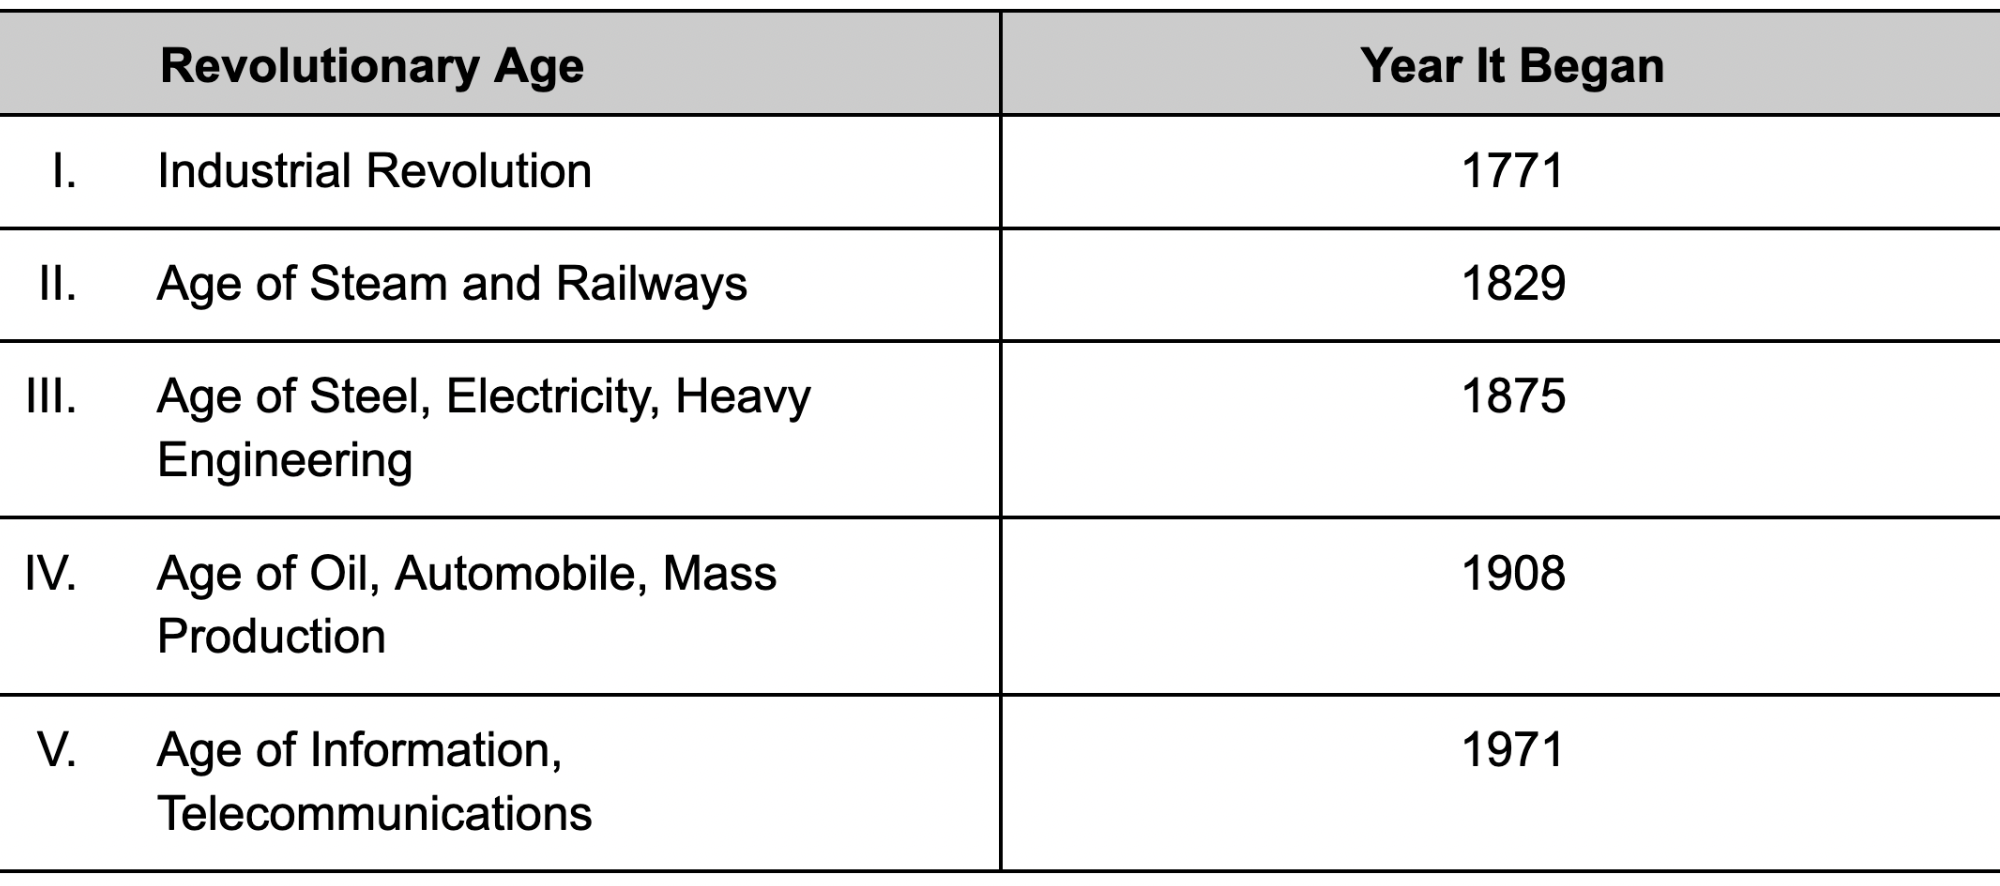
Stock market returns are overwhelmingly driven by a small group of winners. Jennifer Murphy, CEO of Runa Digital Assets, expects the same trend in digital assets.
Quant Explains How This Nasdaq Support Retest Could Also Help Reverse Bitcoin
A quant has explained why the recent retest of a critical support level by Nasdaq may help Bitcoin reverse its own trend.
Nasdaq-100 Has Recently Retested A Critical Support Trendline
As pointed out by an analyst in a CryptoQuant post, Nasdaq-100 is currently above a support line that has historically been important.
Nasdaq-100 (NDX) is a stock market index that includes 102 equity securities issued by 101 of the largest non-financial companies (based on their market caps) listed on the Nasdaq stock exchange.
Here is a chart that shows how this trendline has acted as a bounce in the index’s price over the past decade:
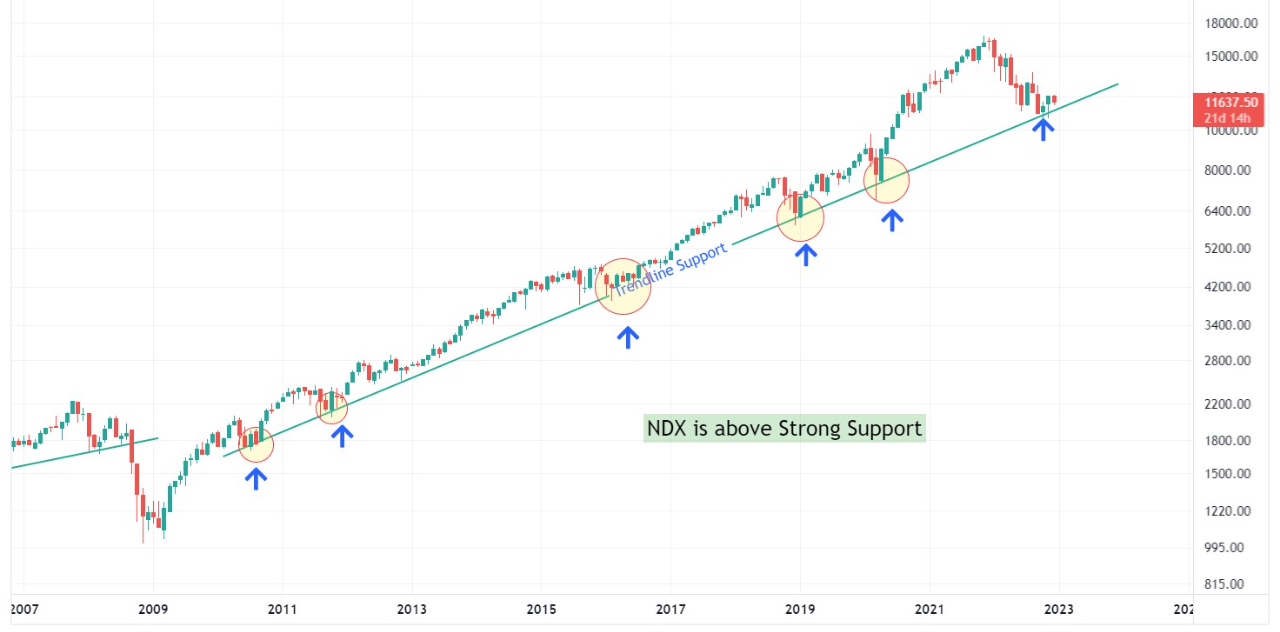
As you can see in the above graph, the price of NDX has been supported five times by this trendline since the year 2010. In each of these instances, the line has put a check on the decline in the index, and has consequently reversed it back up.
Recently, the Nasdaq-100 index has once again made a touch of this trendline, and has so far managed to stay above it.
The quant notes that this retest could have been the end of the latest downwards trend, and might have also been the point of return of a bullish trend.
However, if the trendline is lost instead, it would show the extreme strength of the downtrend, and would suggest that there is more drawdown ahead for the market.
At the same time, Bitcoin has also been testing a support line, as the analyst has highlighted in the chart:
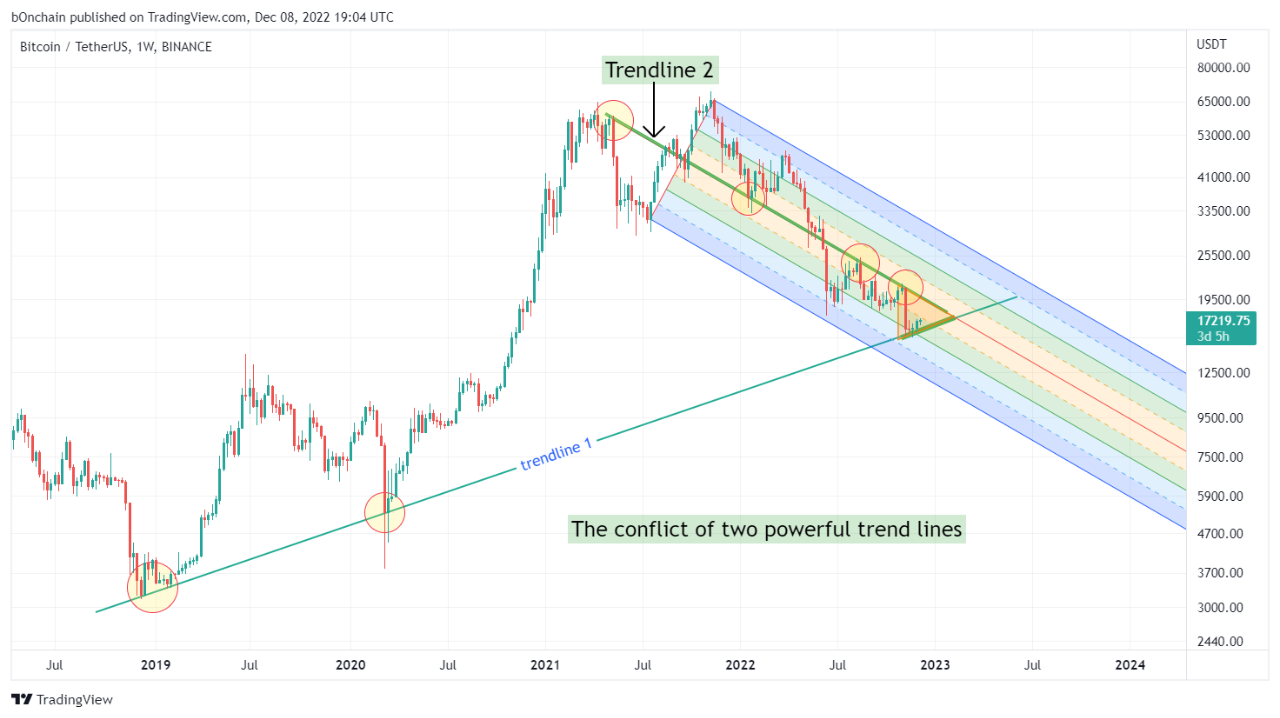
In the past year or so, Bitcoin has shown to be highly correlated with the stock market. The reason behind this correlation has been the rise of institutional investors in the crypto who treat it like a risk asset.
The quant believes that if the current support retest in the stock market proves to be successful, then BTC could also be expected to see a reversal of its own due to its correlation with the stocks.
Bitcoin Price
At the time of writing, Bitcoin’s price floats around $17.2k, up 1% in the last week. Over the past month, the crypto has lost 7% in value.
Below is a chart that shows the trend in the price of the coin over the last five days.

Bitcoin Moves Differently From US Stock Market, Correlation Weakening?
Data shows while Bitcoin has been correlated with the US stock market for some time now, the two haven’t moved in tandem recently.
Bitcoin Correlation With US Stocks May Be Weakening As BTC Has Been Moving Differently
As pointed out by an analyst in a CryptoQuant post, BTC has gone down in the past week while stocks have made some gains.
A “correlation” between two assets (or markets) exists when both their prices follow the same general trend over a period of time.
For Bitcoin, there has been a strong correlation with the US stock market during the last couple of years or so. The reason behind the markets becoming so tied is the rise of institutional investors in the crypto.
Such investors view BTC as a risk asset and pull out of the coin as soon as there is macro uncertainty looming over the market (hence driving the crypto’s price down along with the stocks).
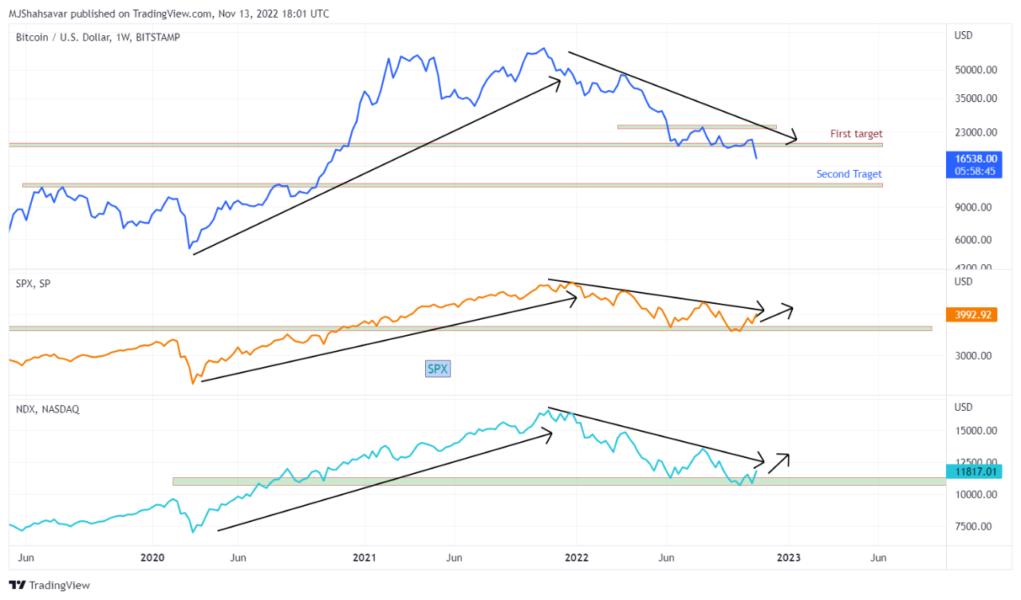
Here is a chart that shows the prices of Bitcoin, S&P 500, and NASDAQ over the last few years:

Looks like the assets have followed similar trends in recent times | Source: CryptoQuant
As you can see in the above graph, Bitcoin wasn’t correlated with the stock market in 2019 and early 2020, but it all changed when COVID struck.
After the black swan crash that occurred in March 2020, the price of BTC started following S&P 500 and NASDAQ.
Though, while BTC showed a same general long-term trend, the crypto continued to be much more highly volatile than the stocks.
The correlation has continued through the bear market, but the last week or so has turned out different.
While the US stock market has seen some uplift in the past 7 days, Bitcoin has instead taken a sharp plummet.
These markets showing different behavior recently could suggest the correlation between them may be reducing.
With the latest plunge, BTC has also lost the support line of the previous all-time high, something that has never happened in the previous cycles.
The quant in the post notes that this recent trend is a sign of weakness in the crypto market, which could lead to further downtrend in the near future.
BTC Price
At the time of writing, Bitcoin’s price floats around $16.5k, down 20% in the last week. Over the past month, the crypto has lost 15% in value.
The below chart shows the trend in the price of the coin over the last five days.

The value of the crypto seems to have remained below $17k in recent days | Source: BTCUSD on TradingView
Featured image from André François McKenzie on Unsplash.com, charts from TradingView.com, CryptoQuant.com
Quant Explains How US Stock Market Volumes Influence Bitcoin Price
A quant has explained how there is a connection between the recent trends in the US stock market volumes and the Bitcoin price.
TradFi Depth Oscillator Has Hit A Low And Is Now Turning Back Up
As explained by an analyst in a CryptoQuant post, the volume depth in traditional finance markets has been low recently.
The “TradFi volume” is a measure of the total amount of transactions that buyers and sellers are making on the US stock market.
There is a concept called “market depth,” which is the ability of any market to take in large orders without impacting the price of the commodity much.
Generally, the more orders there are in a market, or simply, the higher its volume, the stronger the depth of the asset. However, something important is that these orders should be spread evenly within the market, otherwise the depth wouldn’t be as great.
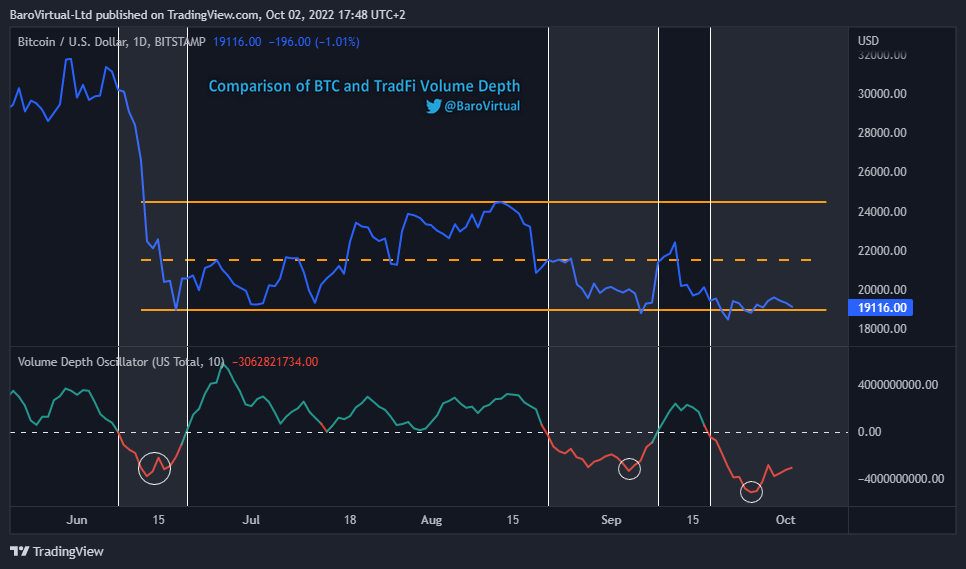
Using an oscillator, the cyclical trend in the depth of any asset can be noticed. Here is a chart that shows how the US stock market volume depth oscillator has changed its values during the last few months:
The value of the metric seems to have been turning around in recent days | Source: CryptoQuant
As you can see in the above graph, the quant has marked the relevant zones of trend between the Bitcoin price and the TradFi volume depth oscillator.
It looks like whenever the indicator has transitioned from positive to negative values, the value of the crypto has observed bearish winds.
On the other hand, the metric crossing the zero line the opposite way has lead to a bullish trend for the price of BTC.
Bitcoin has also seen local bottom formations around the points where the stock market volume depth oscillator itself has hit lows.
About a week ago, the indicator hit very low values that were comparable to those between February and March 2020. Since then, the metric has started turning back up.
The analyst believes that this recent trend formation could imply that Bitcoin may see a respite soon, and bounce to levels between $21.5k to $24.5k.
Bitcoin Price
At the time of writing, Bitcoin’s price floats around $19.2k, up 2% in the last seven days. Over the past month, the crypto has lost 4% in value.
The below chart shows the trend in the price of the coin over the last five days.
Looks like the value of the crypto has been stuck in consolidation during the past few days | Source: BTCUSD on TradingView
Featured image from Traxer on Unsplash.com, charts from TradingView.com, CryptoQuant.com
Goldman Sachs’ bearish macro outlook puts Bitcoin at risk of crashing to $12K

Bitcoin derivatives data also shows sentiment shifting in favor of a massive crash below $20,000, the current psychological support.
Worst quarter in 11 years as Bitcoin price and activity plunges

Quarterly returns on Bitcoin haven’t been this bad since it was trading under $20 in the early days of Mt. Gox, but the stock market isn’t faring so hot either.
Bitcoin Price Crashes Below $30K As Markets Show Signs Of Paranoia
Bitcoin has lost almost 10% of its value during the past 24 hours, falling below $30,000 for the first time since July 2021. And one analyst worries that the largest cryptocurrency might fall even worse.
BTC’s Tuesday decline is more than 55 percent lower than its November 2017 all-time high of $69,000. Year-to-date, Bitcoin prices have decreased by 34%.
Year-to-date, Bitcoin prices have decreased by 34%. The world’s most sought-after crypto asset plunged to $29,870.30 around 8 p.m. EST, TradingView data shows.
Suggested Reading | Shiba Inu: Biggest Dollar Holding Among Wealthiest Ethereum Whales
Bitcoin Drop Correlated To Stocks
Traditional financial markets and cryptocurrencies both saw a sell-off as a result of the Federal Reserve’s aggressive monetary tightening and recession fears.
The last time the largest cryptocurrency by market value dipped below the $30,000 level was on July 20, 2021, when it reached $29,301 before rebounding.
As institutions have joined the Bitcoin and cryptocurrency markets over the past year, their correlation with stock prices has grown. Consequently, Wall Street is having a difficult day as tech stocks continue to experience significant selloffs. The Nasdaq index decreased by 4.3%.
BTC total market cap at $594 billion on the daily chart | Source: TradingView.com
Analyst Sees BTC Dropping Lower
Bitcoin could “perhaps receive a mini-bounce near $35,000, but unless we break the trend line at around $37,000, I’m predicting for $29,000 in the coming weeks or week,” says crypto analyst Wendy O in a new social media video.
Numerous cryptocurrency investors have suggested that Bitcoin is the digital era’s version of gold, a potential flight-to-safety investment and inflation hedge.
The price behavior of cryptocurrencies, however, implies that the market does not view these extremely volatile assets as reliable value repositories during times of economic instability.
Suggested Reading | Bitcoin Carnage Continues As BTC Disintegrates To $34K
Crypto Market Feeling The Pinch For Weeks
Similarly to the stock market, the cryptocurrency market has been under pressure for weeks as investors cope with sustained growing inflation, the ongoing swirl of economic events deriving increasingly from Russia’s invasion of Ukraine, and stricter U.S. monetary policy by the Fed.
“Bitcoin’s long-term fundamentals are intact, but a recovery to record highs will take a very long time. Bitcoin will begin to stabilize when the carnage on Wall Street finishes, and many investors are still in panic-selling mode right now,” Edward Moya, senior market analyst at Oanda, stated.
The central bank increased interest rates by 50 basis points last week and pledged to shrink its holdings; instead of purchasing bonds to stimulate the economy, it will dispose of them to combat inflation.
The values of cryptocurrencies are quite volatile. Experts say this is something crypto investors will continue to face.
Featured image Pexels, chart from TradingView.com
Bitcoin Price Hits Three-Month Low, What’s Driving This?
At this point, it is no longer news that bitcoin has now hit its lowest point in three months. The last time the digital asset had seen its price break below $34,000 had been in late January but had continued to hold up well after this. Last time, the low market momentum following the market crash on December 4th had been the culprit. This time around, a whole different beast is behind the wheel of the tumbling asset value.
Stock Market On The Rocks
Bitcoin’s correlation with the stock market had been on the rise in the past couple of months, eventually hitting a high point in the first quarter of 2022. This correlation had continued to define the market movements of cryptocurrencies over the last few months. In multiple moves, the crypto market has been mirroring the stock market and this same mirroring has triggered the recent downtrend.
Most notable has been the decline in the NASDAQ. Dominated by tech stocks, the Nasdaq has taken a beating in the market. In the last week alone, it has lost 1.5% and on a year-to-date basis is not faring as well having lost about 22% in this time period.
Related Reading | Tron Is Trading Within Its Triangle Pattern; What Awaits The Coin Next?
As the Nasdaq went down last week, so has the crypto market. One difference though has been that the tumble in the crypto market has been more pronounced. It’s easy to see why this is the case given that the largely unregulated crypto market remains more volatile than its stock market counterparts. Hence, coins like bitcoin have recorded about 10% losses in the last week.
Now, while the stock market correlation has had a hand in the recent market crash, it is not the only reason for this. Market sentiment had been declining in recent times and this has given rise to more fear in the market. So a crash has been one that is long in the making.
Looking To The Future Of Bitcoin
Since the crypto market usually follows the movements of bitcoin, looking at the future of this digital asset can often help to see where the market might be headed. With the recent crash, the market has seen more than $200 million taken off the total market cap but indicators point out that this might only be the beginning.
Bitcoin had seen multiple bull rallies in 2021 in a pattern that is unheard of in the market. These rallies which had seen the price hit an all-time high of $69,000 have since subsided and are now naturally giving way to the next bear market.
Related Reading | TA: Ethereum Bears Aim Big After Recent Breakdown Below $2.5K
With the decline, bitcoin is now trading below every significant short and long-term indicator. Being under the 200-day moving average means that investors do not believe that the digital asset will be recovering above $40,000 anytime soon.
Since BTC has now lost its footing at its strongest support level, which was $36,000, bears now have majority control of the market. It is likely that the market will see BTC below $30,000 following this crash before any significant recovery.
Featured image from TIME.com, chart from TradingView.com
Bitcoin Follows US Stock Dive, Experts Predict $37,500 Price Level
As Wall Street opened today, resuming April 21 market losses, Bitcoin faced selling pressure.
Bitcoin prices fell following the stock market plunge. As a result, many experts predict that the Bitcoin price will take a hit and can dive to $37,500 per coin.
Related Reading | Is Bitcoin Gonna See Another Big Drop Soon? Historical Trend May Say Yes
According to TradingView data, on April 22, the price of Bitcoin hit $39,197.
Bitcoin trading below the significant support level of $40,000 | Source: BTC/USD chart from Tradingview.com
The crypto market significantly increased yesterday, with Bitcoin reaching above $42,700. Unfortunately, the day had cost bulls $40,000 support, which had not yet become meaningful at the time of writing.
The Material Indicators team observed that the bids were filling at lower prices for analytics resources’ order books.
According to a chart, there were about $100 million in bids waiting on Binance between spot and $37,500.
In a tweet, Material Indicators said’
#FireCharts is showing ~$100M in #bitcoin bid liquidity between here and the $37.5k range. Expecting it to get filled, but watching to see if #BTCUSDT liquidity moves to the active buy zone or the buy zone moves to the orders resting on the @binance order book.
Stock Market Today
The U.S. stock market continued to go down today. The S&P 500 was down 1.75%, and the Nasdaq 100 was down 1.43% in the first 90 minutes of trading.
The bond market sell-off worsened and reached “historic proportions” in Europe. In a tweet, markets commentator Holger Zschaepitz said;
The European corporate bond market’s ongoing selloff has reached historic proportions, w/high-grade bonds losing a record 8.6% in total return terms since their Aug peak. This is now worse downturn than lows reached during early coronavirus turmoil & the GFC, BBG has calculated.
Bitcoin Price Predictions
Many traders were waiting before making any decisions about Bitcoin. As a result, the BTC/USD exchange rate was now in a critical area.
Related Reading | Time Vs Price: Why This Bitcoin Correction Was The Most Painful Yet
Michaël van de Poppe, CEO & Founder Eight Golbal, said;
The level has hit. Let’s see how the market will respond from this area on #Bitcoin
Cheds, a crypto funding analyst, looked at the price performance over the past few weeks and took a more ominous line.
Bitcoin may now be in more trouble than people thought because it failed to stay above its range earlier this month, he warned on April 22.
In his tweet today, Cheds said;
$BTC my belief is most market participants are underestimating the impact of this failed breakout.
Bitcoin has been experiencing a lot of pessimistic predictions about its price in the mid-term. One example is former BitMEX CEO Arthur Hayes, who believes that the price will reach $30,000 by June.
Featured image from Pixabay, chart from Tradingview.com


