
Bitcoin price action since FTX “feels like the world has ended,” says Stock-to-Flow creator PlanB.
Cryptocurrency Financial News
Bitcoin price action since FTX “feels like the world has ended,” says Stock-to-Flow creator PlanB.

At least some were buying the dip below $20,000, data shows, while PlanB fields fresh criticism of his stock-to-flow BTC price models.

United States stock markets provide the backdrop for reversal in Bitcoin as $30,000 manages to hold.

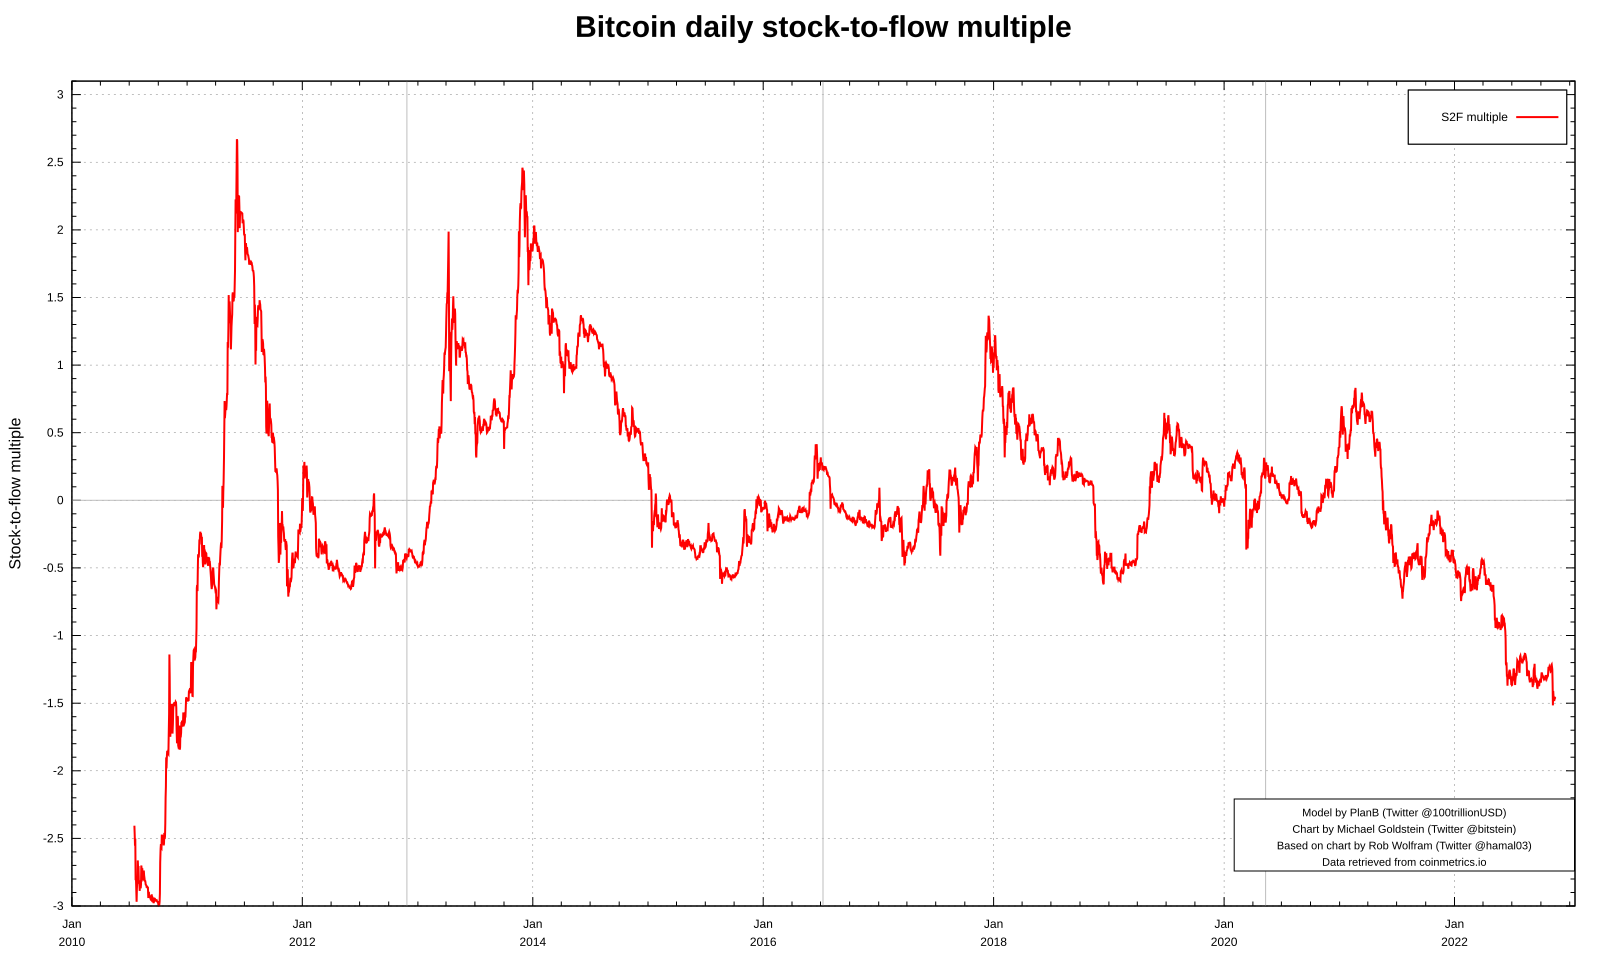
PlanB’s floor model misses its target in a historic first as fresh bear pressure mounts for Bitcoin price action.

Hitting $100,000 at the end of this year will spark a major publicity war by large volume investors, Matthew Hyland believes.

Will Bitcoin break above six figures before Christmas? PlanB’s Stock-to-Flow model suggests $100,000 BTC could be imminent.

The popular prediction model has been remarkably accurate in the past when it comes to forecasting Bitcoin’s bearish and bullish cycles against its rising scarcity.

Bitcoin price action exactly conforms to PlanB’s predictions for a second time, and if history repeats itself, BTC/USD should be at $63,000 by the end of the month.

Bitcoin price forecasts differ hugely depending on the methodology used, but stock-to-flow creator PlanB favors his $100,000 average target.
Popular Bitcoin model Stock-to-Flow (S2F) shows BTC has touched a trend line that has historically sent the crypto flying.
Bitcoin Touches S2F Deflection Trend Line
As pointed out by a crypto analyst on Twitter, BTC seems to have just touched a lower S2F deflection trend line.
The S2F or Stock-to-flow Bitcoin model helps in predicting the price of BTC. The method has proved to be remarkably accurate so far, besides a few points of deviation.
S2F model is based on the ratio between the stock (supply) and the flow (annual production). The model can be applied to any asset, not just BTC. A higher value of the indicator means the commodity is more scarce.
Here is how the latest S2F chart for Bitcoin looks like:
The BTC S2F chart seems have a negative deflection at the moment | Source: buybitcoinworldwide.com
As the graph shows, despite some deflections during certain periods, the model still seems to be close. Currently, the chart shows a negative deflection.
Now, there is another, related indicator of relevance here. The Stock-to-Flow deflection. This metric highlights whether an asset is undervalued or otherwise in terms of its S2F value.
Related Reading | On-Chain Expert Predicts $162K Bitcoin Peak This Cycle
The BTC S2F deflection is calculated by taking the ratio between the current price and the S2F value. When the ratio is more than 1, it means BTC is overvalued, while if it’s less than 1, the crypto is said to be undervalued.
Below is a chart that shows the current trend in the BTC S2F deflection value:
The BTC S2F deflection ratio is much less than 1 right now | Source: glassnode
As the graph shows, there is a trend line that Bitcoin has touched in the past, soon after which the price has jumped up.
It seems like the crypto has once again made a touch on this line, and if past pattern follows, the price might move up.
BTC Price
At the time of writing, Bitcoin’s price is around $38k, up 2% in the last 7 days. Over the past month, the coin has accumulated 8% in gains.
Here is a chart showing the trend in the value of the cryptocurrency over the last 6 months:
BTC seems to be once again moving downwards | Source: BTCUSD on TradingView
After a relieving period of sharp uptrend where Bitcoin reached $42k, the coin is once again falling down. As the S2F deflection trend line shows, it’s possible the price might shoot back up. However, that’s only given the pattern indeed holds.
Related Reading | “The Death Of China’s Bitcoin Mining Industry,” 7 Takeaways From The Article
Also, something to note here is that even if the pattern holds, the price might not immediately go up. As the S2F deflection chart shows, BTC touched the trend line twice in 2017 before shooting back up.

Someone is buying “a lot” of Bitcoin this week as stock-to-flow deflection reaches a level that traditionally sparks a serious price surge.

It’s make or break time for S2F as BTC teeters on the bounds of the famous model.

The only way is (more or less) up for BTC price action, the analyst insists, offering a potential 2021 high of $450,000.

Bitcoin would “surprise” the stock-to-flow creator if it fails to return to its forecast trajectory, with three years still to go until crunch time.

A majority of Bitcoin investors that held the cryptocurrency during its turbulent periods stand profitable.
Bitcoin fell below $50,000 on Friday. The pioneer cryptocurrency is currently trading at around $49,405 at 11:10 GMT. Within the last 24 hours, the coin lost 8.9%, a massive loss to traders and investors.
However, stock-to-flow models creator, PlanB, has said that he’s relieved that the coin has lost over 22% in just a week. Saying that Bitcoin is still acting “like clockwork” with regards to their price predictions.
In a tweet on Friday, analyst PlanB noted that the price dip to under $48,000 has sent BTC below it’s target laid out by his stock-to-flow model. Due to this, Bitcoin is no longer “front-running” stock-to-flow.
After the benchmark cryptocurrency traded above its required level, the quant analyst had suggested that the price movement of the coin was becoming inorganic.
Related Article | Bitcoin Dives Below Key Support, Here’s Why BTC Bears Are Back
“I am sort of relieved btc price is now under s2f model value again,” he wrote in a conversation with “The Bitcoin Standard” author Saifedean Ammous, who called PlanB’s predictions “astonishing.”
“For a moment I thought that people were front running the model and that the supercycle had started. Now we are back to normal .. like clockwork,” PlanB added.
Astonishing indeed, even to me. Btw I am sort of relieved btc price is now under s2f model value again. For a moment I thought that people were front running the model and that the supercycle had started. Now we are back to normal .. like clockwork. pic.twitter.com/BRHs30MPvJ
— PlanB (@100trillionUSD) April 23, 2021
The stock-to-flow and stock-to-flow (S2F) cross-asset (S2FX), variously call for an average BTC/USD price of $100,000 or $288,000 between now and 2024. This is the supercycle being expected.
PlanB said he believed Bitcoin would not stop at $100,000, which it should hit this year.
“Bitcoiners are often too bullish in the bull market, and too bearish in the bear market! I don’t think we supercycle this time either,” podcast host Stephan Livera, responded to Ammous.

Bitcoin price took a sharp dive below $50,000 | Source: BTCUSD on TradingView.com
Immediately the market dipped below $50k, notorious gold bug and crypto-skeptic, Peter Schiiff, was also quick to comment on the market action, poking fun at Bitcoin proponent Anthony Pompliano. He tweeted:
“Now that Bitcoin is back below $50k I think it’s time for @APompliano to tweet out $1k milestones on the way down the way he did on the way up.”
Now that #Bitcoin is back below $50k I think it’s time for @APompliano to tweet out $1k milestones on the way down the way he did on the way up.
— Peter Schiff (@PeterSchiff) April 23, 2021
Pompliano responded: “Bitcoin is up 600% in last year. Gold is up 3% in last year. No more tweeting until gold can beat inflation, Peter!”
Though, various factors have been said to cause the current fall.
Related article | Bitcoin Loses Important Lifeline That Got Bulls Blood Pumping
Some analysts noted that CME futures is now trading below spot price as bearishness begins, as well as a negative Coinbase premium.
When Coinbase premium is positive, it suggests bullishness. but the reverse, when Coinbase spot price is lower than that of fellow exchange Binance, is also true. Major sell orders on Coinbase, each one causing a brief downward spike in its orderbook spot price.
The Crypto Fear & Greed Index also remained in “greed” territory despite dropping to monthly lows, though still suggesting that a sentiment reset had yet to kick in.
Featured image from Pixabay, Charts from TradingView.com

The creator of the stock-to-flow models, PlanB, says that Bitcoin is still acting “like clockwork” with regard to the their predictions.

The Bitcoin bull run of 2021 has “at least some months” left to go, says PlanB amid impatience as BTC/USD hovers below recent highs.
The popular stock-to-flow bitcoin valuation model has the air of academic rigor. Unfortunately, it’s just math-laden marketing.
The popular stock-to-flow bitcoin valuation model has the air of academic rigor. Unfortunately, it’s just math-laden marketing.


