
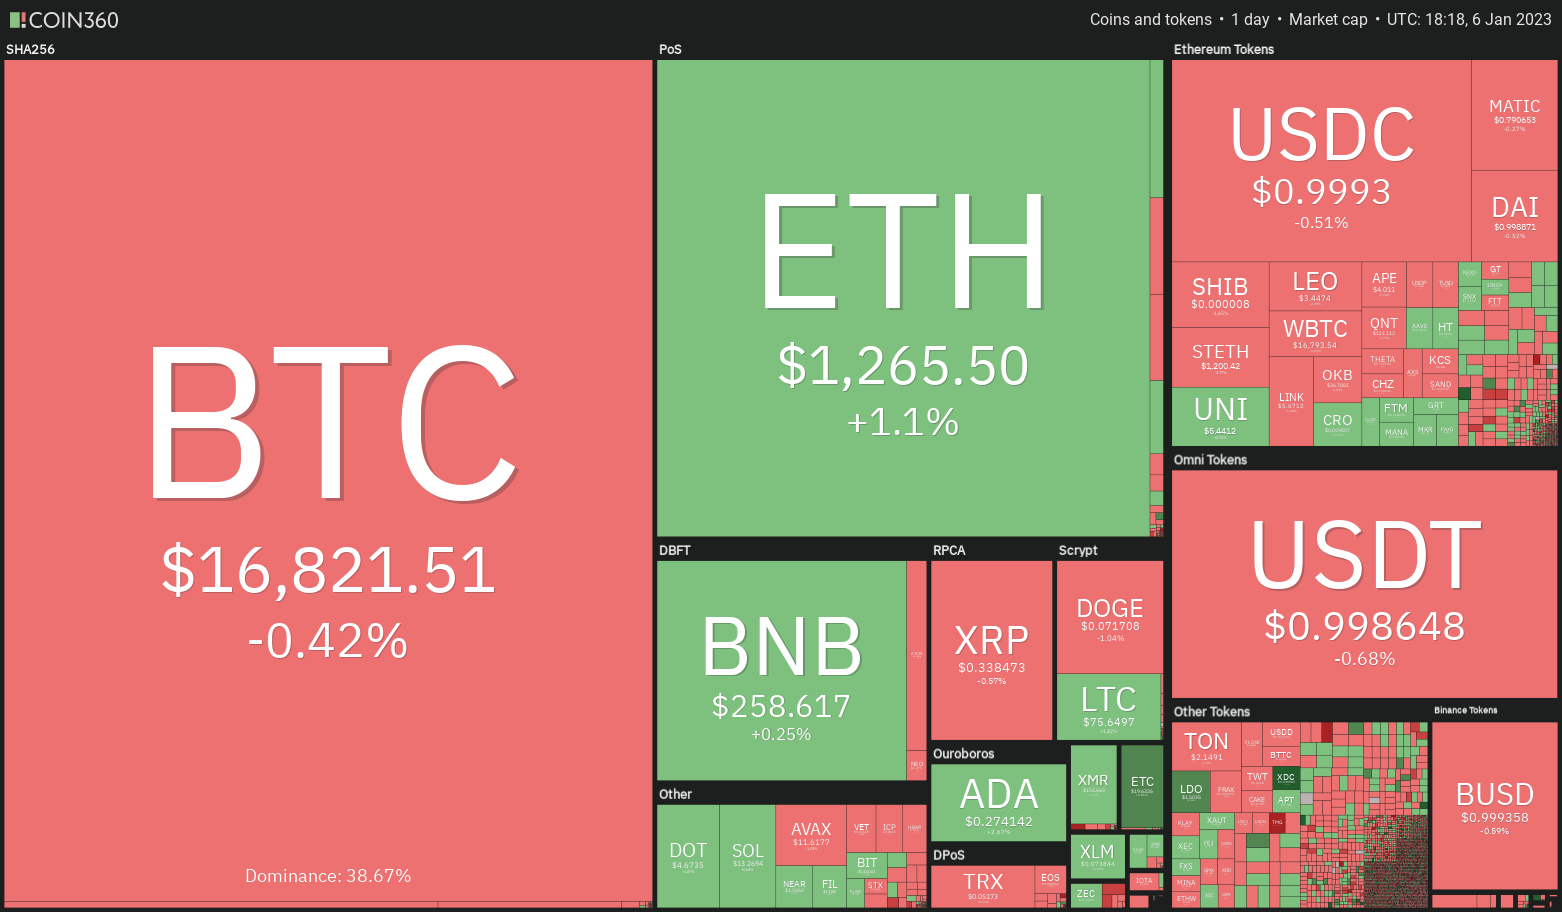
The DeFi market didn’t see much change in its first week of new year compared to the last week of 2022 as the price momentum remained in a similar zone.
Cryptocurrency Financial News

The DeFi market didn’t see much change in its first week of new year compared to the last week of 2022 as the price momentum remained in a similar zone.

Friday morning’s reports on job and wage growth and the service industry gave hope that the Fed may further slow the pace of monetary tightening.

A rally in equities markets is providing support to BTC and altcoins, but bulls will likely struggle in keeping the momentum needed to turn overhead resistance levels to support.
FTX’s U.S. leadership and the company’s Bahamas wing’s court-appointed liquidators have formed a cooperation agreement addressing how assets may be inventoried and disposed of, among other issues, a press release Friday said.

By definition, stablecoins are tethered to the real economy. But whatever links they have should be minimized, until their applications are fully proven, says Dan Kuhn.


According to the court filing, the number of victims in the FTX case made it “impractical” to rely on more traditional methods of notification.


According to a report by Nansen, approximately $94.2 million has flowed out of the exchange within the past week.

An Ohio family now has not one but two felons facing potentially lengthy prison sentences for crypto-related crimes.
On-chain data shows the Bitcoin exchange depositing transactions are now at a 4-year low, indicating that the bottom may be here.
As pointed out by an analyst in a CryptoQuant post, the metric’s current levels are the same as in Q1 2019. The “exchange depositing transactions” is an indicator that measures the total number of Bitcoin transfers that are headed toward centralized exchanges.
The difference between this metric and the more popular exchange inflow is that the latter indicator tells us the total amount of BTC being deposited to exchanges, that is, the combined sum of the value of each transaction going to exchanges (rather than their total number), which is a value that can be inflated by a few whales and are thus not representative of the trend being followed by the entire market (especially the retail investors).
But since the exchange depositing transactions only focus on the pure number of individual transfers taking place rather than their amounts, the metric could give a more accurate picture regarding whether the average investor is sending coins to exchanges or not at the moment.
Since one of the main reasons holders deposit to exchanges is for selling purposes, a high value of this indicator can have bearish implications for the price of the crypto. On the other hand, low values imply not many investors are applying selling pressure right now.
The below chart shows the trend in the 30-day moving average (MA) Bitcoin exchange depositing transactions over the last several years:
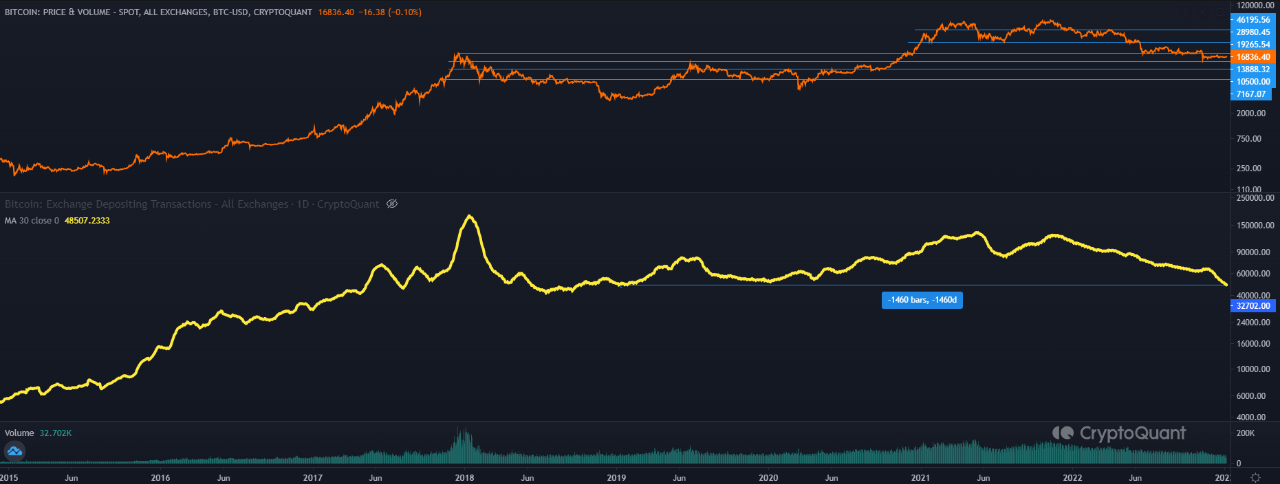
As shown in the graph, the 30-day MA Bitcoin exchange depositing transactions have declined for quite a while and have recently hit pretty low values. The current levels are the lowest the indicator has observed since Q1 2019, four years ago.
Back then, the bear market of that cycle was at its final stages as the asset price was at cyclical lows. This means that the appetite for depositing coins to exchanges, and thus for selling BTC, is at historically low levels.
This could suggest that the selling pressure may have become exhausted in the market now, and the bottom could be near, if not already, for the current BTC cycle. However, the quant in the post also notes that the bottoming process being possibly here doesn’t discount the possibility that there could still be a final downward push left for Bitcoin.
At the time of writing, Bitcoin is trading around $16,700, up 1% in the last week.


Live from CES 2023 in Las Vegas, the software development company is standing firm on why crypto’s future will be based on self-custody following the implosion of FTX.


The founder of FTX pleaded not guilty to all criminal charges related to the collapse of crypto exchange FTX.
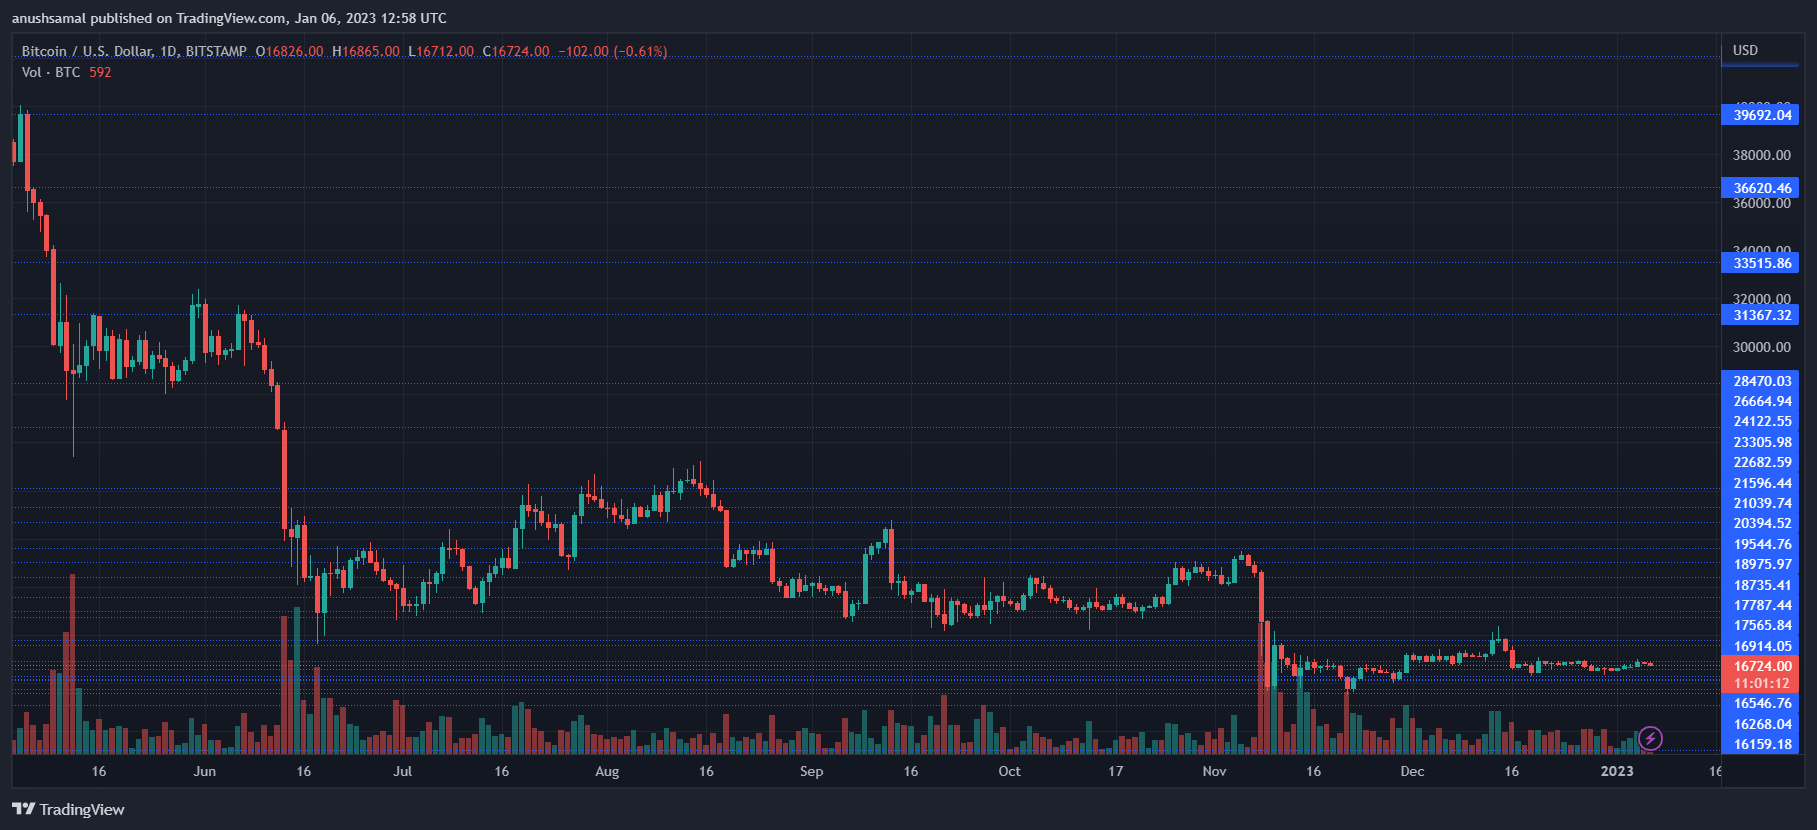
The Bitcoin price has struggled below $17,000 for multiple weeks now, and it recently dipped below the $16,900 mark. This downward move on the Bitcoin chart could be attributed to the recent Federal Open Market Committee (FOMC) minutes.
The minutes of the meetings revealed that the Federal Reserve System would stick with higher interest rates for the foreseeable future.
This has evidently sent ripples through the market, causing participants to react negatively. The technical outlook of the asset has reflected a fall in accumulation, but indicators are still positive about the Bitcoin price over the upcoming trading sessions. From the daily chart, it can be inferred that BTC will make a recovery in the next trading sessions.
Bitcoin continues to hold itself steady above the $16,600 price mark. Currently, the price of the asset is consolidated, with major altcoins following the same price trajectory. Over the last 24 hours, BTC slipped 0.6%. The Bitcoin price at the moment is trading at a 76% discount from its all-time high of 2021. The market capitalization of Bitcoin decreased slightly, indicating that sellers outnumbered buyers at press time.

BTC was trading at $16,700 at the time of writing. The coin recently lost the $16,800 support level; however, this is extremely short-term as BTC will soon initiate recovery on the chart.
A slight push from the buyers will help BTC propel itself above the $16,800 mark, which indicates that the overhead resistance for the coin stood at $16,900.
Clearing the $16,900 price mark will pave the way up to $17,000. On the other hand, if demand doesn’t show up immediately, BTC could retrace further to sit at $16,600 before it starts to move northward again. The amount of BTC traded in the last session declined to indicate slight bearishness.
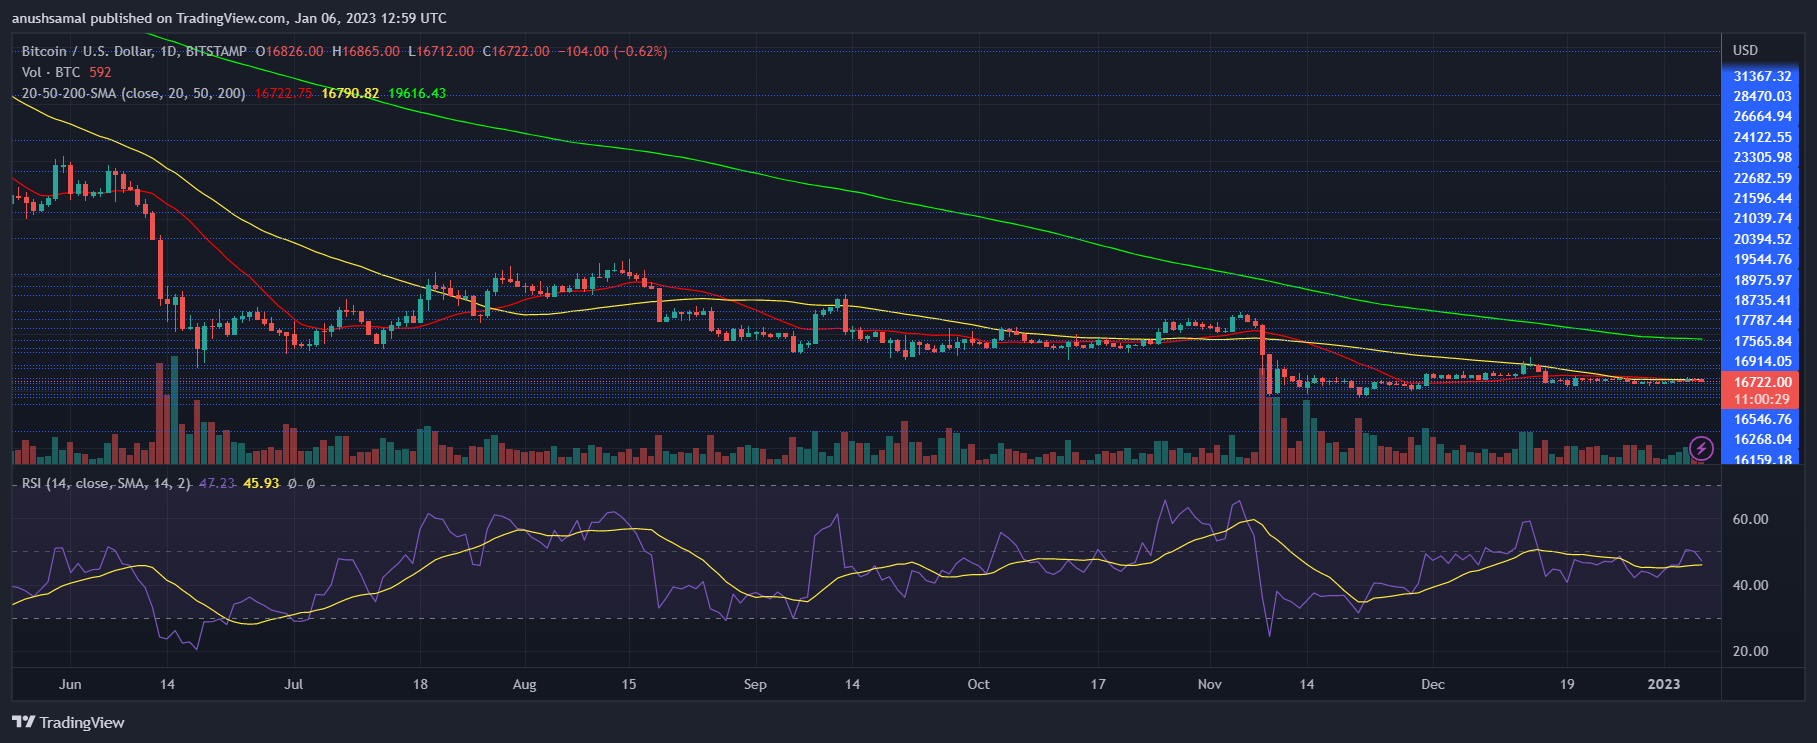
Despite a fall in the number of buyers, the technical outlook has managed to remain positive for Bitcoin price. The Relative Strength Index noted a downtick, which indicated that buyers were slowly exiting the market. On the other hand, however, Bitcoin has displayed a positive sign on the daily chart.
The price of the asset was above the 20-Simple Moving Average line (SMA), which meant that buyers still had the upper hand in driving the price momentum in the market. Additionally, the 50-SMA (yellow) was below the 20-SMA (red) line; this is a golden cross, a pattern that is formed before the coin starts a rally.
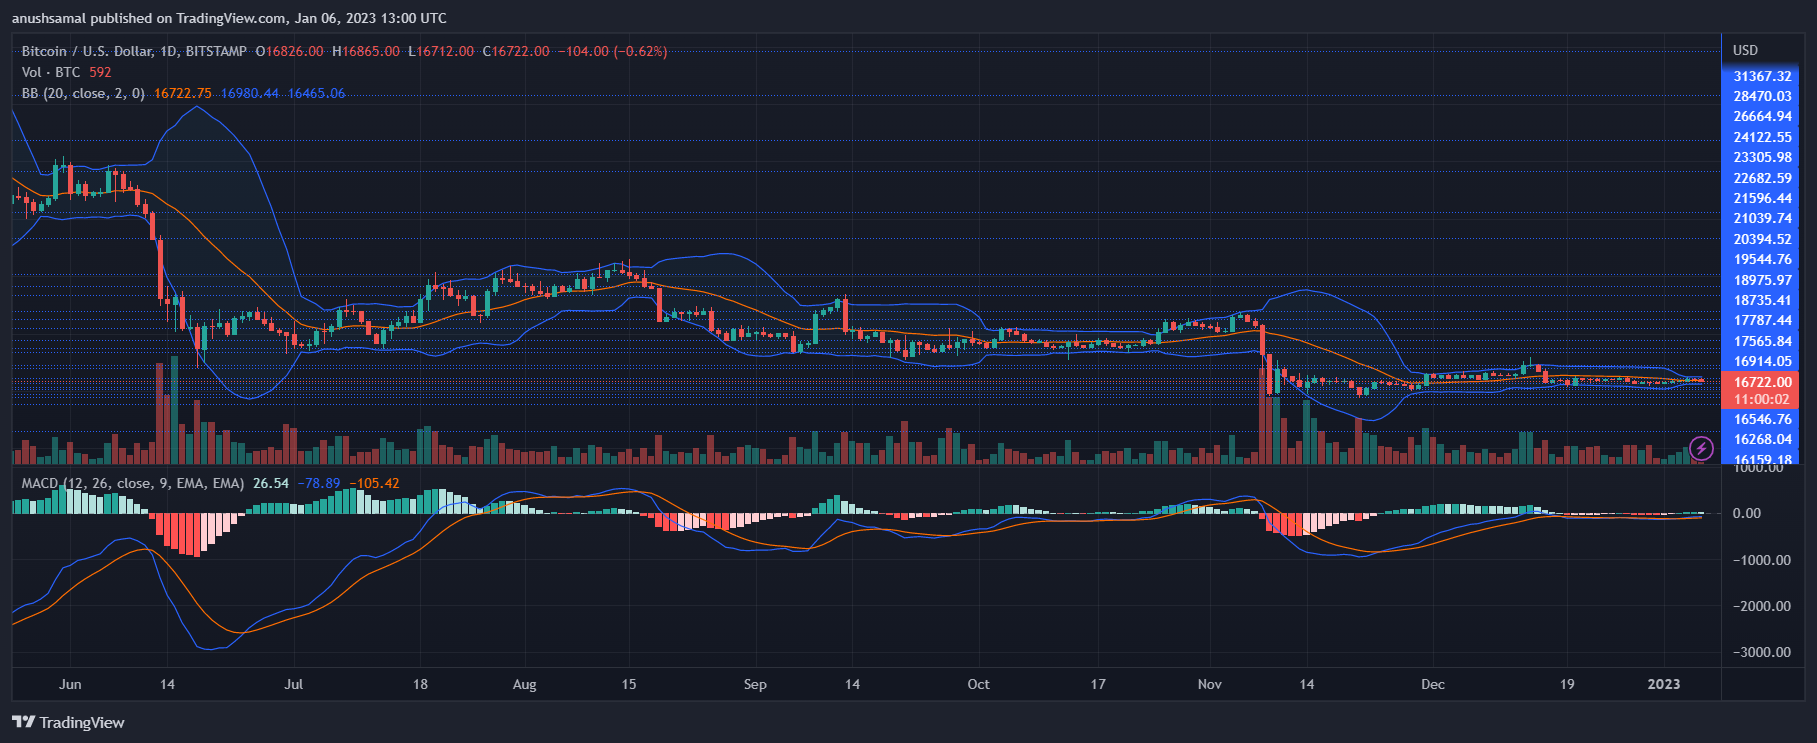
In accordance with incoming bullish strength, Bitcoin price depicted a buy signal on the daily chart. The price momentum is indicated by the Moving Average Convergence Divergence, which showed green signal bars.
Related Reading: Ethereum Gains 4.5% in Weekly Timescale As Shanghai Upgrade Nears
These bars were buy signals, which also aligned with the idea that the price of the asset was about to go up. Bollinger Bands illustrate volatility and future fluctuations in price. The bands were heavily constricted, in a squeeze, indicating a sharp turn in price and possible trading opportunities for traders.


The legal team confirmed the U.S. Departure of Justice was in the process of seizing the Robinhood shares, but said SBF was “compelled to reply” given other claims.

A new study by Ren & Heinrich suggests that Binance’s emergence as the dominant global crypto exchange might mean that its individual token listings are now getting a lot more attention – at least among speculators.

Web3 features are just beginning to appear on smart TVs, but they could become an on-ramp for general consumers.

Ripple has been locked in a bitter court battle with the U.S. Securities and Exchange Commission regarding whether XRP should be classified as a security or not.
Ripple’s CEO, Brad Garlinghouse, recently tweeted about him being optimistic but cautious of what 2023 brings in terms of regulations.
Because of this, XRP has been trading sideways, a movement not altered since FTX’s collapse. Adding to the downward pressure is the significant whale activity on the market. According to Whale Alert, whales have been moving hundreds of millions worth of XRP to the open market with the biggest transfer worth $92 million.
However, the market seems bullish despite recent bearish developments as XRP, as of writing, went up by 2% in the past 24 hours. XRP is currently trading at $0.3435, down 0.5% in the last seven days, data by Coingecko shows.
Today is the first day of the 118th Congress. While prior efforts at regulatory clarity for crypto in the US have stalled, I am cautiously optimistic that 2023 is the year we will (finally!) see a breakthrough. A thread on why…
— Brad Garlinghouse (@bgarlinghouse) January 3, 2023
The day the SEC filed the complaint, December 21, 2020, XRP fell by 67.13% on the charts. However, December 5 proved to be a day XRP holders should rejoice. According to a report, the SEC failed to satisfy the three elements of the Howey Test which determines whether the asset is a security or not.
This is a big win not just for Ripple but for the entire crypto industry as this would legitimize crypto’s place in the financial space. With the company and community hopeful for a win, Ripple released to escrow over 55% of XRP’s total supply out of which is a billion XRP.

Although the market is very hopeful for a win, Garlinghouse’s statement shows a very mixed sentiment about what 2023 will bring for the company and for the world of crypto.
But he is very clear on what could – or better yet, should – happen this year; break the status quo in the current U.S. legislation about what crypto should and shouldn’t be or America will lose its innovation leader status.
Currently, the sideways market movement could be broken in the next few weeks. As of writing, investors and traders of the token are pushing the price up to test the $0.3680 price resistance range.
With low correlation with Bitcoin and Ethereum, it might only be slightly dampened by bad macroeconomics as recession fears grow.
Crypto market FUD (fear, uncertainty and doubt), however, might become a problem. As of now, two events are sending negative signals to investors of crypto. First is Huobi’s decision to lay-off 20% of its workers, and the second is the Genesis-DCG fiasco.
Any negative developments here might affect XRP’s ability to test its current resistance range. As the situation develops, investors and traders should capitalize on the token’s current bullish momentum.
-Featured Image: The Daily Hodl


Traders are contemplating what will happen to ETH price and staked Ether derivatives after the next network upgrade opens withdrawals for stakers.
Solana-based BONK has been all the craze since the start of the new year. The meme coin had risen from obscurity to the largest meme coin on the Solana ecosystem in less than two weeks, recording massive gains for investors during this time. However, the hype seems to have reached its peak and BONK has begun the dreaded downward correction.
In the last day, the price of BONK has rapidly declined, losing more than 50% of its value during this time. It hit its all-time high price of $0.0000049 on Thursday when the hype was at its peak but since then, has fallen to $0.000002.
This was after recording a more than 4,000% return rate in a 10-day period and reaching a market cap of over $200 million. However, as is the case with meme coins, holding on to such gains becomes impossible with no real utility and eventually, the sell-offs dragged its price back down. Being a digital currency driven by purely social sentiment, this was expected to happen, just like it did with predecessors such as Dogecoin and Shiba Inu.
This drawdown in price has also seen the price surge recorded in Solana over the last week slow down significantly. However, while BONK is seeing over 53% losses in the past day, SOL recorded small gains of 0.17%.
With a downturn such as this, BONK could be seeing the start of the end just like Shiba Inu had done in October 2021. As such, it could be wise to get out of the cryptocurrency now if the losses were to continue for the next few days. But it is also important to take into account the growth of the meme coin, as well as the attention it is receiving in the market.
For example, BONK remains one of the most visited pages on Coinmarketcap. It is second only to RichQUACK, another meme coin that has not done well in the last week. What this shows is that there are still a lot of eyes on the cryptocurrency, which could give it a leg up.
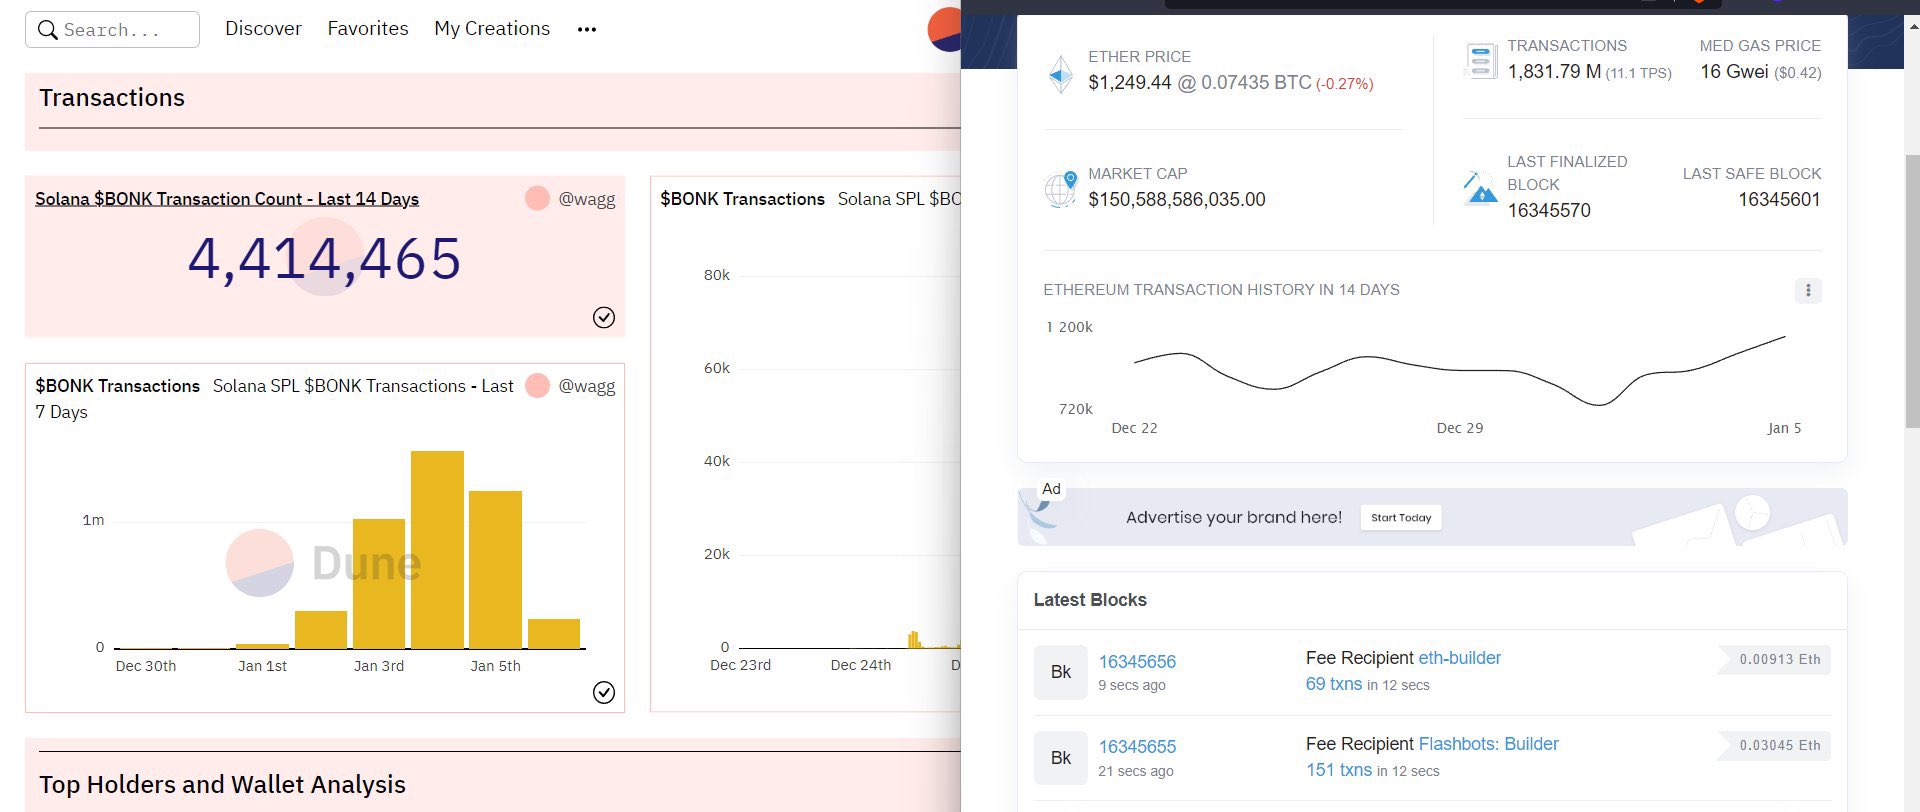
Another important tidbit is that BONK transactions had reportedly surpassed that of Ethereum in the last three days, according to data from Dune Analytics. Now, this is only at the peak of the hype and does not mean that the meme coin would be able to sustain such levels but is important to note nonetheless.

However, it is essential to remember that when a digital asset falls 50%, it would need to see a 100% increase to get back to its previous price, which can be a hard feat to accomplish for a meme coin. In the end, investors should keep in mind that meme coins are more volatile than the average large-cap cryptocurrency.

According to the company, it produced 475 BTC in December 2022, bringing its total mined Bitcoins in the fiscal year of 2022 to 4,144 BTC.


The crypto exchange has come under scrutiny from policymakers amid multilateral sanctions on Russia and U.S. sanctions on Iran.


