Sam Bankman-Fried’s repeated efforts to contact witnesses and influence their testimony shows that “no combination of conditions will reasonably assure the safety of the community,” prosecutors said in a written filing calling for his bond to be revoked.
Worldcoin is making reality look like a lot like Black Mirror

OpenAI’s sister company Worldcoin wants you to buy its coin — and possibly unleash a tempest of problems across the world in the process.
Meta Hopes to Recharge Lagging Horizon Worlds Metaverse With New In-House Game Studio
The struggling platform reported losses of $3.7 billion in the second quarter, though CEO Mark Zuckerberg remains “fully committed” to the metaverse and AI.
German regulator raised concerns about Binance CEO prior to license application withdrawal: Report

BaFin reportedly advised Binance that CEO Changpeng Zhao wouldn’t pass a “fit and proper” test as part of the financial watchdog’s licensing regime.
Arbitrum DAO’s First Grants Programs Take Shape
Two governance proposals are collectively requesting nearly $5 million worth of ARB tokens to launch grants programs.
Another week of DeFi hacks, but ZK-proof development heats up: Finance Redefined

The total value locked in DeFi protocols remained below $50 billion after another week of exploits.
XRP Ledger’s L2 Smart Contract Development Reaches Key Stage
Evernode, the XRP Ledger (XRPL) Layer 2 platform, has shared a series of updates on its journey toward launch, offering insights into its progress and the challenges it has faced.
XRP Ledger Layer 2 Platform Audit Scheduled For Mid-August
Evernode is a Layer 2 platform that seeks to bring smart contracts to the XRP Ledger ecosystem via Hooks. The platform is being developed by a team of experienced developers working to enhance the XRP Ledger network with advanced functionalities.
In the first update, Evernode announced that the audit of their three hooks is tentatively scheduled to begin in mid-August. However, the team is still waiting for paperwork and funding from Ripple to confirm the audit, just like other XRPL Grants Grantees.
In the second update, the Evernode team shared that the Nomad contract proved more challenging than expected. The contract did not persist on the betanet, which helped the development team identify bugs and areas for improvement. The team has been working hard to resolve these issues and remains optimistic that they will overcome the obstacles soon.
Ultimately, Evernode appreciated the approximately 104 betahosts who have provided invaluable feedback in testing and improving the platform in a near-live environment.
These updates highlight the complexity of developing a Layer 2 platform for XRP Ledger and the importance of thorough testing and auditing. It also emphasizes the dedication and hard work of the Evernode team throughout the development process.
However, upon successful launch, Evernode’s platform will enable developers to build and deploy smart contracts on the XRP Ledger network, opening up new use cases and applications for the ecosystem. This will enable XRP Ledger to compete with other smart contract platforms such as Ethereum, which has gained significant traction in decentralized finance (DeFi).
Moreover, Evernode’s platform will help drive the adoption of XRP Ledger by attracting more developers to the ecosystem. As the number of developers grows, the network’s capabilities will expand, leading to more use cases and applications, ultimately driving adoption and value.
The development of Evernode’s Layer 2 platform for XRP Ledger is a significant milestone for the XRP Ledger community. It showcases the continued innovation and development within the ecosystem, which are critical for its growth and success.
Overall, Evernode’s updates on the progress toward launching a Layer 2 platform for XRP Ledger demonstrate the importance of rigorous testing and auditing in developing complex systems.
The successful launch of the platform will open up new opportunities for developers, potentially driving adoption and growth in the XRP Ledger ecosystem.
At the time of writing, XRP has encountered a sideways price movement since Monday. As the fourth largest cryptocurrency in the market regarding trading volume and market capitalization, it is currently trading at $0.7119, representing a decrease of 1.6% over the last 24 hours.
Featured image from Unsplash, chart from TradingView.com
Pond0X token launch snafu leads to millions of dollars in losses

Investors reported they lost up to $2.2 million when the developer of Pond0x allegedly mishandled the token’s launch.
Seda co-founders discuss intersection of oracles and multichain

Oracles enable value, but they are also susceptible to value manipulation; co-founders of Cosmos-based Seda discuss their benefits and how to prevent pitfalls.
No, Sam Bankman-Fried Is Not Being Bailed Out By Democrats
Republican candidate Vivek Rameswamy is rightly furious over dropped campaign finance charges. But the charges are likely to return after a procedural adjustment – and claims of corruption do more harm than good.
Sam Bankman-Fried Maybe Hasn’t Escaped Campaign Finance Charges
Prosecutors just withdrew a campaign finance charge ahead of Sam Bankman-Fried’s criminal trial this October. That doesn’t mean the U.S. Department of Justice is letting the FTX founder off on alleged criminal conduct, however – and campaign finance charges could still be tried later.
Stanford MBA Explains Why Next Bitcoin Cycle Could Be “Bigger”
A Stanford MBA has explained why the current Bitcoin cycle was different from the others, and why the next one could end up being bigger.
This Bitcoin Cycle Faced Obstacles That May Not Be There Next Time
A “cycle” for Bitcoin refers to the period between two consecutive halvings. The halvings, events where the rewards miners receive for solving blocks on the network are permanently slashed in half, are chosen as the start and end points for the cycles due to the immense significance they hold for the cryptocurrency.
The rewards miners earn are essentially the only way new supply can be introduced into circulation, so since halvings cut these in half, the production rate of the asset itself gets tightened.
Because of basic supply-demand dynamics, Bitcoin’s post-halving scarcity increases the asset’s valuation. It’s not a coincidence that the bull markets have always followed these special events.
The halvings occur roughly every four years, with the next one being scheduled for next year. As BTC transitions towards a new cycle, Jesse Myers, a Stanford MBA, has released a new post that looks back at this cycle so far and compares it with the previous cycles.
At first sight, one difference becomes immediately clear: the structure of the top during this past bull market wasn’t anything like what the previous cycles displayed.
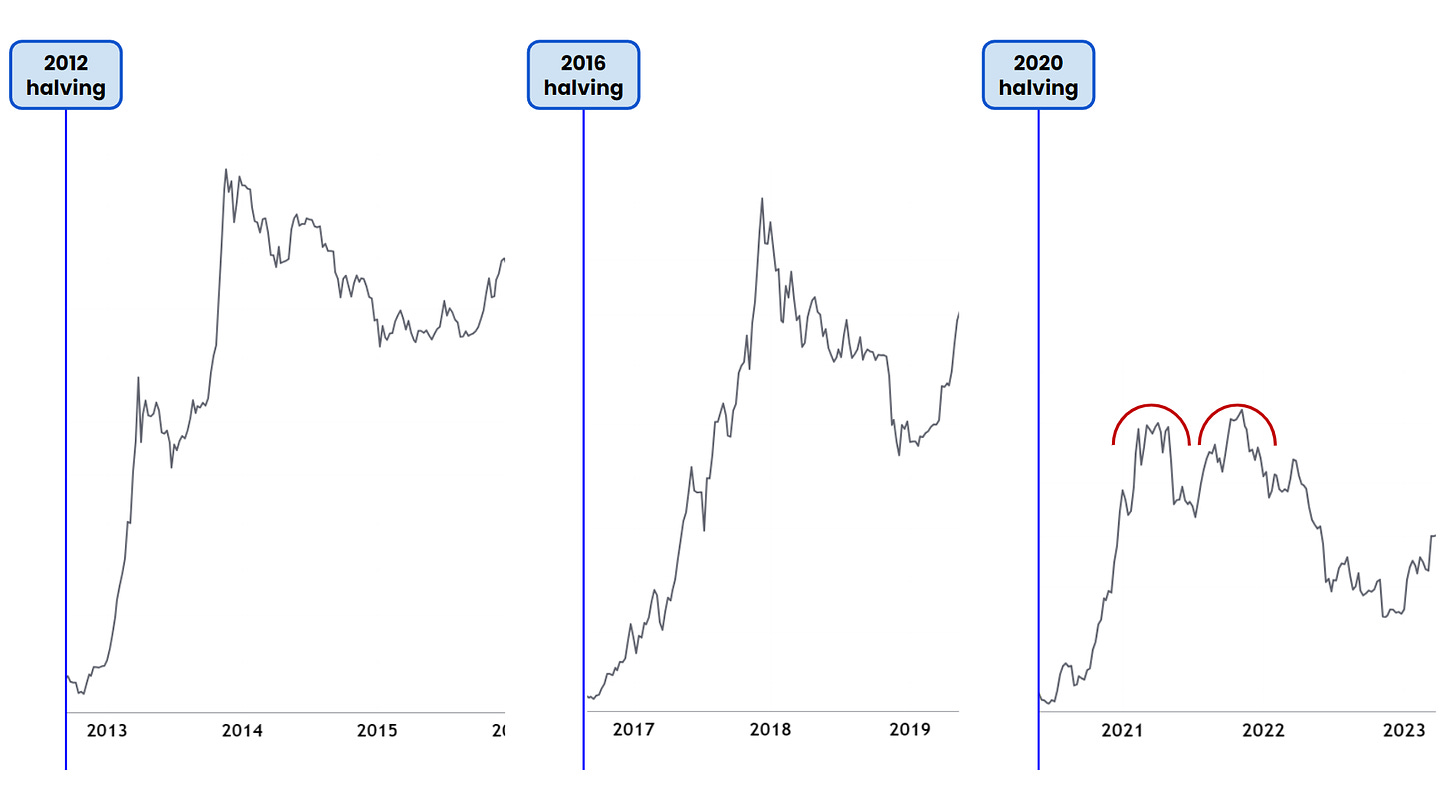
“Instead of a parabolic advance culminating in a blow-off top, we got a bi-modal rounded top spread out over six months,” notes Myers. So, why did the BTC price behave differently during this bull market?
Well, there are mainly four factors at play here. The first and undoubtedly the biggest one would be COVID-19 and the US government’s response to it. The onset of the virus and the black swan crash that came with it just preceded the cycle, meaning that the cycle kicked off in anomalous conditions.
During the cycle itself, the Fed was giving out stimulus checks as a way to mitigate the economic impacts of COVID. “That Quantitative Easing (QE) undoubtedly helped fuel the 2021 Bitcoin bull market,” explains the Stanford MBA.
The problem came, however, when the Fed changed its policy and switched to Quantitative Tightening (QT). Interestingly, this switch appears to be what marked the Bitcoin top in November 2021.
In the middle of all this, another factor was also at play: the May 2021 China ban on Bitcoin mining. Back then, China was the biggest hub of cryptocurrency mining, so the ban naturally delivered a significant shock to the sector.
The resulting selling pressure crashed the market, leading to the bull rally prematurely halting. It wasn’t until three months later that bullish winds once again returned for the asset.
While these factors have been quite influential for BTC, it’s apparent that they are unlikely to repeat, meaning they shouldn’t have any presence in the next cycle.
On the contrary, the other two factors that made this cycle different are likely to appear in the next cycle as well. This previous bull market was the first one where investors widely used leveraged futures trading. Probably, leverage would again come into play in the next bull market.
Lastly, there is the fact that platforms like FTX issue a lot of “paper Bitcoin.” Supply equivalent to 25% of the mined BTC that year was owned by FTX’s customers, but this BTC didn’t exist; it was only there on “paper.” The analyst believes that such fudging will likely be present during the upcoming cycle.
While there had been some developments in this cycle that ultimately shortened the bull market, some changes can be favorable for the next cycle.
The Bitcoin supply is quickly moving off exchanges, and the HODLers getting hold of the majority of the supply has often been making the news recently. Still, there is another super exciting factor.
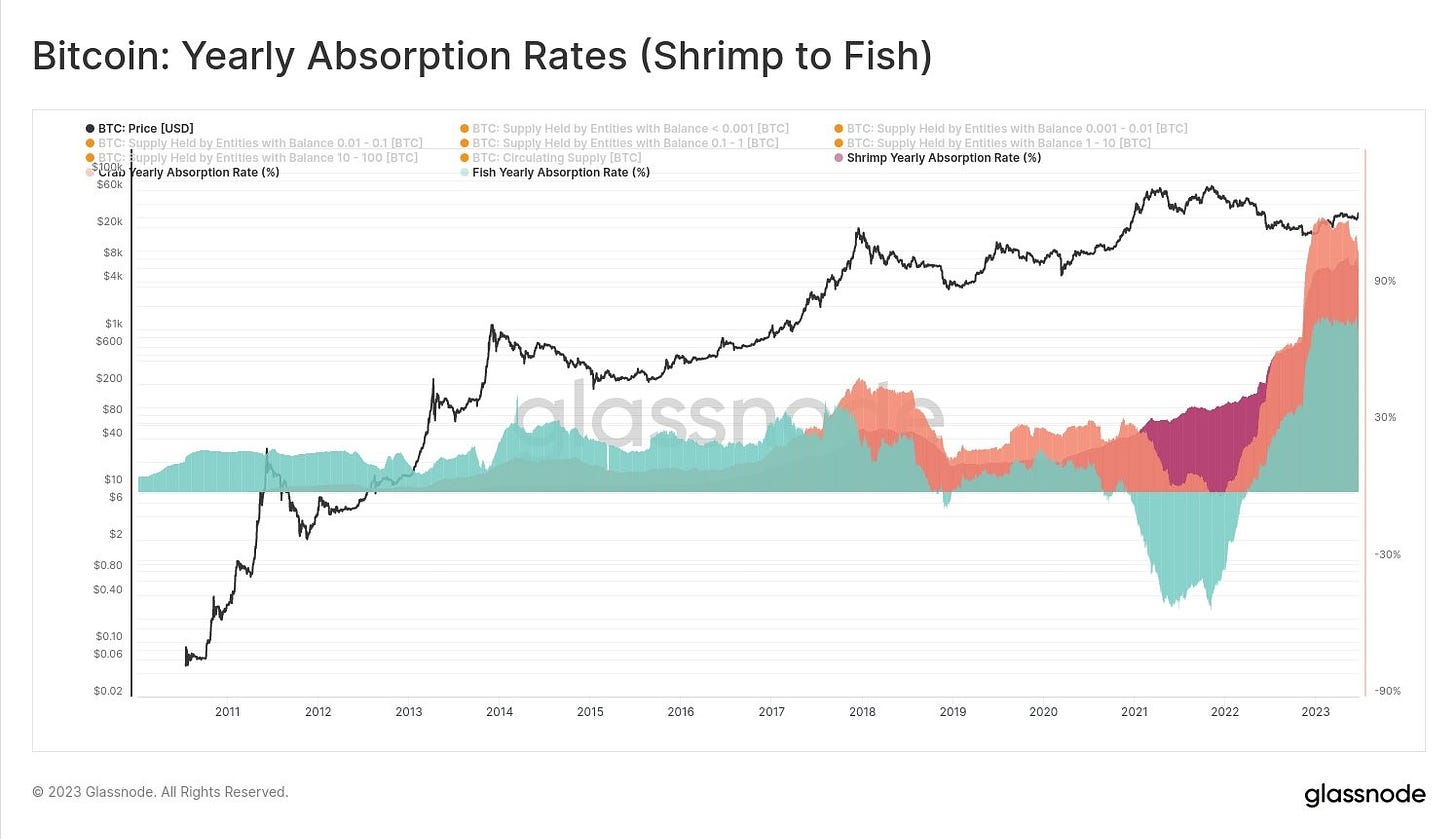
According to this chart from Glassnode, the relatively small entities on the network (holding less than 100 BTC) have been accumulating 275% of all Bitcoin being mined.
The fact that this rate is more than 100% suggests that the smaller investors are taking coins off the likes of whales. “This has never happened before. We have reached some kind of inflection point,” says Mjers.
Soon the halving will occur, and this supply shock brewing in the market will only get tighter. Perhaps the smaller investors are looking to get in before this happens.
Mjers mentions, however, that these individuals aren’t the only ones catching on; asset managers like Blackrock are also coming around and pushing to get themselves into the industry.
As mentioned before, the QT policy proved disastrous for BTC in this cycle, but a shift back towards QE may be imminent, which would naturally boost the market instead. The analyst thinks this event might coincide with the upcoming halving of the cryptocurrency.
Now, based on all these factors, these are probabilities that Mjers has assigned to the different price range predictions for the next cycle:

The Stanford MBA believes that a growth of more than 8x, a multiplier higher than what the current cycle saw, is the second most probable scenario, given all the potentially positive developments.
A cycle outperforming the previous has never happened in the cryptocurrency’s history, so if this scenario happens, it would be a first.
BTC Price
At the time of writing, Bitcoin is trading around $29,300, down 2% in the last week.
Aliens Exist. And They Use Cryptocurrency
‘We’re Compute Cowboys’: Gideon Powell on the Pioneer Spirit Driving Bitcoin Mining
An interview with the CEO of Cholla Inc., an oil & gas exploration company that’s investing in bitcoin mining.
Bitcoin Whales Make Alarming Deposits To Exchanges Amid Falling Prices
It would appear that Bitcoin whales are shifting their BTC into exchanges at an alarming rate, which is a warning that they may be getting ready to liquidate their holdings. Recent on-chain data shows that Bitcoin whale exchange deposits reached $275 million in a single day as the cryptocurrency continues to struggle to cross over $30,000.
Bitcoin Whales Moving Funds to Exchanges
Tweets from the whale transaction tracker @whale_alert indicate that a total of 9,406 Bitcoins, with an approximate worth of $275 million, have been moved into exchanges through separate transactions.
The vast majority of these trades entered Binance twice, with the largest single deposit being the entry of 2,459 BTC with a total value of $72.6 million. Another significant transaction included the deposit of 1,499 BTC with a total value of $44.3 million into the Binance exchange.
The actions of these Bitcoin whales, or large holders, often significantly impact the overall market. There are a few possible for big money transfers, but when whales make large deposits to exchanges, it usually signals they are preparing to sell in large volumes, which can crash the market, at least temporarily.
Many traders consider this a bearish signal and can spark worry that prices may soon drop. For smaller investors, this can mean opportunity or risk ahead.
The price of Bitcoin crossed over $30,000 last month, showing promising signs of an upward trend for investors. However, the cryptocurrency has experienced a slight decline in the last seven days, dropping by around 1.57%. Further massive selloffs by whales can have a counter effect on this bullish sentiment.
BTC HODLer Net Position Change Reaches 1-Month Low
In the same vein of waning bullish sentiment, the number of net Bitcoin position changes recently reached a 1-month low. The metric, which measures the position change of long-term investors on a monthly basis, shows whether investors are opening or closing positions in Bitcoin.
According to data from Glassnode alerts, this metric just reached a one-month low of 17,604.723. This shows that more holders have been closing out their BTC positions to withdraw their profits for the past few weeks than those opening new ones.
#Bitcoin $BTC HODLer Net Position Change just reached a 1-month low of 17,604.723
Previous 1-month low of 22,095.894 was observed on 18 July 2023
View metric:https://t.co/CU3jPaaHXh pic.twitter.com/8k2EHP0nsi
— glassnode alerts (@glassnodealerts) July 28, 2023
It is important to keep an eye on whale selloffs, but other factors, like the shift in the net position of HODLers, also help to reveal where the price of Bitcoin is headed in the short term.
Crypto Biz: Elon Musk’s X targets financial services, PacWest emergency rescue and more

This week’s Crypto Biz explores Elon Musk’s plans for X, the Italian central bank’s take on DeFi, PacWest’s merger with Banc of California and more.
Bitcoin Won’t Be Stuck Below $30K for Long, Crypto Options Traders Bet
BTC losing the significant price level after a month is likely just a short-term deviation based on derivatives trading data, SynFutures CEO said.
Data Shows: Bitcoin Traders Going Long, Blast Above $30,000 Looming?
Bitcoin continues to trade sideways during today’s trading session, holding the line draw for the past few weeks. Recent data shows that the cryptocurrency has been recording “crab-like” price action in the short term, but operators favor the long side of their trades.
As of this writing, Bitcoin trades at $29,700 with a 0.7% loss in the last 24 hours and a 2% loss in the previous week. The cryptocurrency’s implied volatility has been trending to the downside while BTC’s price holds still at its current levels.

Low Volatility Set The Stage For A Bitcoin Price Explosion?
Data from a report posted by crypto analytics firm Block Scholes via Deribit indicates that Bitcoin and Ethereum traders have been seeking long exposure to these cryptocurrencies. As mentioned above, this behavior coincides with a decline in delivered volatility.
As a result, the BTC and ETH perpetual swap markets are experiencing a shift in funding rates. This measure determines the percentage paid by long to short positions at a given time.
The chart below shows that funding rates have been trending to the upside since last September 2022. At that time, the price of Bitcoin and other cryptocurrencies hit a multi-year low.
Now, the BTC price experienced a 100% recovery from those levels leading to a change in the derivatives sector. The chart shows that funding rates across the BTC, ETH, and USDC trading pairs have been positive for the past three months.
This data shows that traders are going long and willing to pay short positions for their exposure. A positive funding rate is often linked to the sentiment among operators and could hint at an upcoming bullish run when found on platforms like Deribit, where “smart money” trades.

Why Are BTC Traders Going Long?
Conversely, Block Scholes wonders: why are traders going long when implied volatility fell to new all-time lows? What’s driving operators for long exposure while the price trades sideways so much that they are willing to pay a premium? The report stated:
We find it somewhat odd that traders are willing to pay such a consistently high rate for long exposure despite such low expectations of volatility.
The above is unclear; it could be traders hedging their positions on the options market could be traders getting ready for an upcoming move as the U.S. Securities and Exchange Commission (SEC) deliberates on the potential approval of a spot Bitcoin Exchange Traded Fund (ETF).
Sam Bankman-Fried’s legal team turns over docs related to NYT story, requests they be sealed

Lawyers claimed there was a “need to avoid” the public dissemination of documents Sam Bankman-Fried had shown a New York Times reporter that led to a story on Caroline Ellison.
A BlackRock BTC ETF Wouldn’t Be Possible Without Bitcoin Miners
With institutions like BlackRock, Fidelity and Ark Investments all seeking SEC approval for Bitcoin ETFs, it’s time to thank Bitcoin miners for laying the groundwork for industry expansion.


