Fantom Price Continues To Shine – What’s Behind The Latest 15% Surge?

Fantom price has been such a joy to watch for investors in recent days, as a much-needed breath of fresh air continues to spread throughout the crypto market. Bitcoin and other large-cap assets seem to be recovering well after a period of sluggish and frustrating price action.

Notably, Fantom emerged as one of the best performers in the cryptocurrency market over the past week, posting a substantial 26% price increase in the last seven days. The Layer 1 token has particularly been on a hot streak in the past day, soaring by 15%.

The Catalyst Behind The Latest FTM Surge

The much-awaited Sonic upgrade has been critical to the turnaround the Fantom price has witnessed in the past few months. Sonic is expected to improve Fantom’s technology stack and introduce major scalability enhancements without a disruptive hard fork.

Most recently, the Fantom Foundation unveiled the details of the upcoming layer-1 chain Sonic Network. According to the blog post, the new blockchain network will be connected to and be able to tap into vast amounts of liquidity, users, and protocols from “Ethereum and beyond” via a native layer-2 bridge.

As disclosed previously, the Sonic Network is expected to go live alongside a new token, with the ticker S. In the latest memo, the project revealed that FTM token holders will be able to migrate Sonic’s token at a 1:1 ratio, depending on the results of a governance vote.

The Fantom Foundation said in its latest blog post: 

Initially, this migration process is anticipated to be bi-directional, which will allow users to swap back and forth between $FTM and $S. Since the $S token will only exist on Sonic and $FTM will only exist on Opera, we anticipate utilizing a bridge to enable bi-directional swaps. This process enables a seamless migration for current Opera network participants to experience Sonic. After a transitional period (to be determined in the future), the migration process is expected to transition to a one-way migration of $FTM to $S.

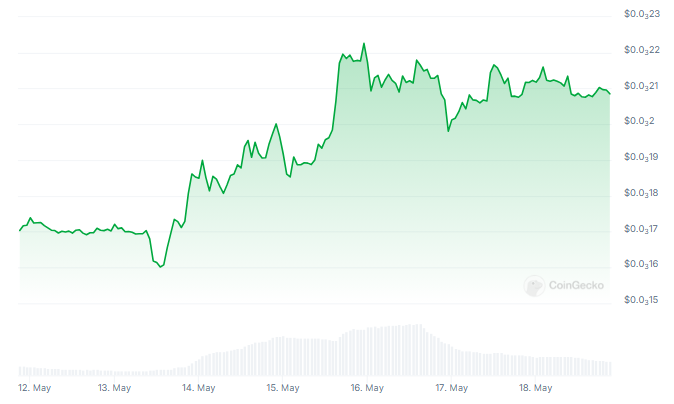
The project noted that the supply of the new S token will match that of FTM to facilitate the token migration process after the Sonic chain launch. It is worth mentioning that the Fantom price experienced a significant surge following this update on the Sonic Network on May 17.

Fantom Price At A Glance

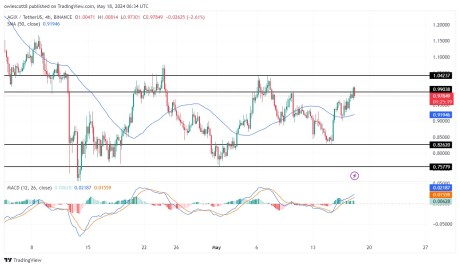
As of this writing, the Fantom price is around $0.908, reflecting an almost 15% increase in the past 24 hours.

Fantom Price

Why Altcoins Are The Best Investment For Now – Analyst

Popular crypto analyst Michaël van de Poppe continues to back altcoins to put up a spectacular bullish performance in the coming months. In a new X post on Saturday, the veteran analyst takes a deeper dive explaining the reasons behind his advocacy for altcoins investment ahead of a highly expected crypto bull run.

Investing In Altcoins Is The Best, Analyst Says Why

In his most recent bullish prediction on altcoins, van de Poppe begins by stating these tokens may not present as the most ideal investment especially considering that their combined value is down by 70% against Bitcoin in the last three months. 

The analyst has attributed this poor performance to several factors including a delay in network updates and an extended bear market. In addition, van de Poppe also notes Ethereum’s current struggles to be a significant contributor to this market downturn. 

He explains that typically the crypto bullish hype moves from Bitcoin to Ethereum, followed by tokens with big market cap, then middle-cap tokens and small-cap tokens. 

However, this cycle appears to be experiencing some delay due to a bearish cloud over Ethereum, driven by uncertainty over the approval of a proposed spot exchange-traded fund (ETF) as well as its asset class. 

Nevertheless, van de Poppe believes this delay to be quite temporary as he postulates that market traders are currently pricing in any potential negative effect from the denial of an Ethereum Spot ETF or the classification of the prominent altcoin as a security. 

Once Ethereum embarks on a bullish course, van de Poppe predicts other altcoins to follow suit. The analyst projects that certain tokens could record a 1000% gain as seen between October 2023-February 2024, amid the hype around Bitcoin spot ETFs.

However, the analyst nudges investors to buy into the altcoin market now during the period of “lowest confidence”. He believes such an act is similar to investing in Bitcoin at $3,700 at the start of 2020, thus ensuring investors generate maximum profits in the coming bull run.

Ethereum ETF Approval In The Balance

As weeks continue to progress, the approval of an Ethereum spot ETF by the US Securities and Exchange Commission (SEC) appears highly uncertain

This sentiment is driven by the Commission’s ongoing deliberation on whether to classify Ethereum as a security as well as a lack of dialogue between the agency and prospective issuers.  The next deadline dates are for May 23/May 24, during which the SEC will respond to 2 ETF applications with many analysts expecting further delays from the Commission.

At the time of writing, Ethereum trades at around $3,123.39 reflecting a 0.53% increase in the last day.

altcoins

This Crypto Trader Just Sold All His Bitcoin For Altcoins Like Cardano And XRP, Here’s Why

Crypto expert Michaël van de Poppe recently revealed that he had sold all his Bitcoin and rotated his capital to altcoins. The analyst explained the reason for this move and remarked that he was doing this to acquire more of the flagship crypto later on.

Why This Analyst Swapped His Bitcoin For Altcoins

In an X (formerly Twitter) post, Van de Poppe explained that altcoins have been “crushed unreasonably hard.” As such, he believes things can only improve from here on, noting that the “upside (for these altcoins) can’t be denied.” 

Based on his explanation, the analyst suggested that these altcoins will likely outperform Bitcoin from here on as the flagship crypto already had its moment before the halving when crypto natives swapped their altcoins for Bitcoin. Before now, Van de Poppe had already predicted that altcoins would make a bounce in their Bitcoin pairs post-halving. 

He also mentioned back then that there would be a narrative shift to Ethereum. More recently, he indicated that the news around the Spot Ethereum ETF would trigger a rally for Ethereum and other altcoins. While explaining his decision to swap his Bitcoins, he again touched on this and hinted that Ethereum would be integral to any move these altcoins make. 

Van de Poppe claimed everyone expects the worst, that the Spot Ethereum ETF applications will be denied because the SEC considers the crypto token a security. Therefore, he believes the market is already priced in accordingly and can only recover from here on, even if the SEC eventually rejects the applications. 

The crypto analyst further claimed that the markets could make a “significant U-turn” if the news ends up being slightly better than a rejection. He also highlighted other developments that could help trigger this move. One is the FIT21 bill, which the House will soon vote on. This bill is expected to provide regulatory clarity for digital assets in the United States. 

Van de Poppe also noted that the SEC’s lawsuit against Ripple is coming to a “final stage” and predicts that the crypto firm will likely secure a final victory, which could also help provide a major boost for these altcoins. 

Meanwhile, he expects that Decentralized Physical Infrastructure Networks (DePIN) and Real World Assets (RWA) will be “massive,” with traditional companies transitioning into the Web3 ecosystem. As such, Van de Poppe urged his followers to “allocate” themselves if they wanted to “make a large return.”

Van De Poppe’s Big Bet

It is worth noting that Van de Poppe’s decision to swap his Bitcoins for altcoins isn’t an end in itself but a means to an end. The crypto expert hopes to make a return of 300% to 900% on his investment in the coming six to twelve months. Van de Poppe hinted that he would rotate his capital back to Bitcoin after this period and predicted that he could make another 300% to 600% return on his investment as long as Bitcoin stabilizes.

He warned of the risk of taking such a bet, revealing that he is currently down around 20% on his overall investment. He also remarked that he could still post more losses on his investment, considering these altcoins could still experience further declines from their current price levels. 

However, Van de Poppe added that he is fine with whatever the outcome of his investment is. Again, he reaffirmed that he is “happily allocating” his entire capital towards altcoins and concluded by stating that the bull cycle will be “glorious.”

Altcoins total market cap from Tradingview.com (Bitcoin crypto)

Floki Inu Frenzy: Memecoin Eyes New Highs As Open Interest Soars

Floki Inu (FLOKI), the Shiba Inu-inspired memecoin, has rocketed into the spotlight with a surge in trading activity and a nearly 20% price increase in the past week. However, experts caution that this “pup-ularity” might be short-lived, fueled more by hype than by strong foundations.

Open Interest Takes Off: Newcomers Flock To FLOKI

The key indicator driving excitement is the skyrocketing Futures Open Interest for FLOKI. According to Coinglass, this figure, which reflects the number of outstanding futures contracts, has climbed a staggering 110% since May 1st, reaching a 30-day high of nearly $20 million. This suggests a surge of new market participants entering FLOKI positions, potentially anticipating further price increases.

Adding fuel to the fire is the significant rise in FLOKI’s daily trading volume. On May 15th, Santiment reported a daily volume exceeding $1 billion, marking the highest level for FLOKI since late March. This intense buying activity indicates a surge in investor interest, pushing the price upwards.

Momentum Indicators Point To A Bullish Charge

Further bolstering the case for a bullish FLOKI is the behavior of its key momentum indicators. Both the Relative Strength Index (RSI) and the Money Flow Index (MFI) currently sit comfortably above their neutral lines, at 62.68 and 65.37 respectively. In simpler terms, these metrics suggest that the price momentum leans towards further gains in the short term.

Also, the broader market sentiment surrounding FLOKI is notably positive. Increased trading volumes and a surge in social media mentions have amplified investor interest, suggesting that the cryptocurrency is gaining traction not just among retail traders but also institutional investors.

Recent partnerships and strategic developments within the FLOKI ecosystem are likely to fuel further growth. These factors, combined with the strong technical indicators, paint a promising picture for FLOKI’s near-term performance, potentially paving the way for substantial price appreciation.

However, beneath the shiny exterior lies a potential cause for concern. The Chaikin Money Flow (CMF), an indicator that measures the buying and selling pressure of an asset, paints a rather bearish picture.

Still In Negative Zone

Despite the price appreciation, FLOKI’s CMF remains firmly in negative territory, currently hovering around -0.11. This suggests that even though the price is rising, the buying pressure might be weakening.

This divergence between price and buying pressure is often seen as a sign of a potential reversal, indicating a rally driven by short-term speculation rather than long-term investor confidence.

While FLOKI’s recent performance is undeniably impressive, the underlying factors suggest a potentially volatile future. The surge in open interest and trading volume hints at a market frenzy, but the negative CMF raises concerns about the rally’s sustainability.

Featured image from Floki, chart from TradingView

Cardano Whales Return To The Table, Increase Massive Holdings By 10%

Cardano (ADA) whales are back in the picture, with recent data suggesting their confidence in the crypto token may have been revived. If so, this will be massive for ADA, which could experience significant price surges soon enough based on this development. 

Cardano Whales Add To Their Holdings

The market intelligence platform IntoTheBlock recently revealed in an X (formerly Twitter) post that Cardano whales (who hold between 100 million and 1 billion ADA) have now added 11% to their balances over the past 30 days. These investors now hold 6.71% of Cardano’s total supply. 

This represents a bullish development for Cardano since whale accumulation usually suggests that these investors are positioning for a potential price surge. These whales also contribute to the price surge since buys of such magnitude could trigger a rally in the price of any crypto token. 

Besides the whales, retail investors are also heavily invested in Cardano. Data from IntoTheBlock shows that the bid-ask volume imbalance is bullish for ADA. Furthermore, the ‘In The Money’ metric has also turned bullish for Cardano, meaning that most of these investors are currently in profit. 

Generally, the confidence in the Cardano ecosystem is growing once again. Data from DeFiLlama shows that the Total Value Locked (TVL) on the network has increased by over 5% in the last seven days. Lately, there has also been a significant increase in Cardano’s trading volume, meaning users are actively trading on the network. 

Cardano’s Rally Is Imminent 

Crypto analyst World of Charts suggested that Cardano might soon experience a significant rally, noting that the crypto token’s breakout was already confirmed and moving toward the projected price targets. The analyst had previously predicted that a successful breakout would take Cardano’s price to $1 in the coming weeks. 

Crypto analyst Trend Rider also confirmed that Cardano is already witnessing a bullish reversal, highlighting the bounce the crypto token made after flashing a bullish signal on the daily chart. In the short term, the analyst expects ADA to climb back above $0.5 and added that Cardano will need to hold above $0.51 on the weekly to end the price correction and confirm a bullish continuation. 

Crypto analyst Dan Gambardello, the founder of Crypto Capital Venture, also provided insights into Cardano’s future trajectory. He noted that Cardano is currently breaking its 20-day moving average (MA), which the analyst claimed is a very “nice sign” for ADA. 

Gambardello pointed out on Cardano’s daily chart that the 50-day MA has crossed the 200-day MA, which likely means that the bottom is already in, and this is the lowest Cardano will go. This occurrence is referred to as a golden cross and is a bullish signal, indicating the beginning of an upward trend. 

Featured image from Pexels, chart from TradingView

AGIX Sustains Momentum Above 100-Day Moving Average – Rally Imminent?

AGIX is one of the leading AI tokens in the crypto space with a total supply of 2 billion, and a total trading volume of over $105 million, which is over 11% down in the last 24 hours.

For over two days, the price of AGIX has been holding strong above the 100-day Simple Moving Average (SMA). The token which has been on a downward ally for quite some days, is showing some signs of price reversal and if this happens a change of direction might occur and the price of AGIX will start a new movement upward.

As of the time of writing, AGIX was trading around $0.98817 above the 100-day simple moving average, about 1.68% up in the last 24 hours. Currently, there are two main resistance levels of $0.99038 and $1.04237 and two main support levels of $0.82620 and $0.75779, respectively.

Technical Indicators Suggest Upward Rally For AGIX

4-Hour MACD: A technical look at the MACD indicator from the 4-hour timeframe, the MACD histograms are trending above the zero line, and both the MACD line and the Signal line have crossed and are trending above the MACD zero line, indicating a bullish trend. This can be seen in the below image.

AGIX

4-Hour RSI: The formation of the Relative Strength Index (RSI) in the above image also suggests that the price of AGIX is bullish as the RSI signal line is seen trending above the 50% level. This indicates that buyers are active in the market therefore overpowering the strength of sellers.

Alligator Indicator on the 4-hour timeframe: A look at the alligator indicator from the 4-hour time frame shows that the price is trading above the alligator lines as the alligator lip and teeth have both successfully crossed above the alligator jaw, suggesting that the price might continue to move in an upward direction.

AGIX

Support And Resistance Levels To Break

Conclusively, the price of AGIX is currently trading around the $0.99038 resistance level and if it manages to break above this level, AGIX’s price will continue to move further toward the $1.04237 resistance level and if it breaks above this level, an upward trend might begin. 

However, should the price of AGIX fail to break these resistance levels, it will reverse and start a downward movement toward its previous support level of $0.82620. If it manages to break below this support level, the price might move further to test the $0.75779 support level.

AGIX

Why Did Bitcoin Just Jump 10%? Blockchain Firm Weighs In

The cryptocurrency market has been on a hot streak in the past few days, with several large-cap assets posting significant gains in the past week. Most notably, the Bitcoin price bounced back from around $61,000 to above $67,000 for the first time in nearly a month.

As expected, this latest price movement has sparked a lot of speculation and discussion around the premier cryptocurrency. Popular blockchain analytics firm CryptoQuant has shared on-chain insights into the recent Bitcoin price rally and its future trajectory.

How Did Bitcoin Price Reach $67,000?

In a recent report, CryptoQuant revealed the catalyst and on-chain manifestations behind BTC’s latest rally to above $67,000. According to the analytics firm, the price of Bitcoin rode to its new highs on the back of the news of lower-than-expected inflation in the United States.

The inflation data released on Wednesday, May 15 showed that the Consumer Price Index (CPI) rose by 0.3% in April – lower than the expected 0.4%. This revelation suggested that inflation might be on a downward slope in the US, making risky assets like Bitcoin more attractive.

In its report, CryptoQuant revealed that there has been a decreased selling pressure in the BTC market, as short-term holders are selling at low or negative profits. Meanwhile, Bitcoin balances at over-the-counter (OTC) desks have steadied, implying that fewer coins are entering the open market.

What’s more, the analytics platform highlighted a particular on-chain signal that might have predicted the recent Bitcoin price rally. According to CryptoQuant, BTC miners have been extremely underpaid over the past few weeks, which often correlates with price bottoms.

The Catalysts For Sustained BTC Rally?

CryptoQuant, in its report, identified potential catalysts for a continued rally for the Bitcoin price. According to the on-chain data company, demand from permanent holders and largest investors is on the rise but it needs to climb rapidly to push the price of BTC even higher.

Furthermore, the latest data shows that Bitcoin ETF (exchange-traded funds) purchases have dwindled to nearly zero daily, while stablecoin liquidity growth is also on a decline. CryptoQuant noted that these two metrics need a jolt, which might be critical for a sustained Bitcoin rally.

As of this writing, the Bitcoin price continues to hover around $67,000, reflecting a 2.5% increase in the past 24 hours. According to CoinGecko data, the premier cryptocurrency is up by a significant 10% in the past week.

Bitcoin price

Tether Adds Fresh $1 Billion USDT To Supply – Bitcoin To Rally Again?

According to data from CoinMarketCap, Bitcoin rose by 2.9% on Friday to trade above $67,000 for the first time since April 24. This positive price performance by the maiden cryptocurrency has been attributed to the low inflation levels reported in the latest Consumer Price Index (CPI) data. 

However, Bitcoin is an asset subject to the influence of several forces. According to a report by blockchain analysis platform LookonChain, BTC may soon experience another price rally following an increase in the supply of a specific stablecoin.

Can USDT Replicate Surging Effect On Bitcoin? 

In an X post on Friday, LookonChain reported that the Tether Treasury has minted an additional 1 billion USDT indicating a consistent rising demand for the stablecoin. USDT which ranks as the third largest cryptocurrency doubles as the most dominant stablecoin in the crypto space with a market cap value of $111.25 billion. 

The USDT token has famously recorded much growth in the last year with over 31 billion new tokens minted on the Tron and Ethereum network. Interestingly, LookonChain reveals that this rise in USDT market share contributed significantly to Bitcoin’s ascent from $27,000 to $73,000 in the past fifteen months.

The theory behind this relationship stems from an increase in traders’ liquidity provided by investments in USDT.  This increased market liquidity can alter the status of Bitcoin’s supply and demand and oftentimes lead to a rise in BTC’s price. 

Following the most recent 1 billion USDT minted by the Tether Treasury,  most investors and spectators could be expecting a similar boosting effect on Bitcoin’s price, especially with the crypto bull season in play. 

However, Bitcoin’s price in the coming months is still likely to be influenced by other factors such as the BTC spot exchange-traded fund (ETF) market. According to data from SoSoValue, net inflows on Friday reached $177.01 million bringing the total value of the Bitcoin spot ETF market to $12.58 billion. As more major traditional finance players gain a piece of this novel market, Bitcoin is expected to experience monumental levels of demand which will translate into weighty price gains.

BTC Price Overview

At the time of writing, Bitcoin was trading at $66,853, reflecting a 9.64% gain in the last week. The crypto market leader is currently in a consolidation state as it gathers momentum to break past the 67,000 resistance zone. 

Bitcoin is likely to remain the “diamond” of the crypto bull season for many investors based on historical price data. However, there remains a need for proper research by all investors and traders before engaging the market. 

Bitcoin

ADA Price Surge Could Push Ratio Of Holders In Loss Below 55%

Cardano (ADA), the proof-of-stake blockchain network known for its smart contracts, has defied recent predictions of a fall from the top 10 cryptocurrency rankings by market cap.

In a surprising move, ADA has instead become the top performer among major coins, experiencing a 7% surge in the last 24 hours. This price action has ignited discussions about ADA’s potential to revisit its 2021 glory days, when it reached a peak of $3.10.

A Tale Of Two Whales: Retail Accumulation Vs. Profit Taking

The recent price increase can be attributed to two key factors: a surge in buying pressure and a potential upcoming “battle of the whales.”

On-chain data reveals that retail investors, the so-called “whaley” masses, have been accumulating ADA aggressively, particularly between $0.48 and $0.50. This large cluster of buyers could act as a support system if the price reaches that level.

However, lurking beneath the bullish sentiment is a potential obstacle. Data shows that only 40% of current ADA holders are in profit.

A price increase to $0.49 could be particularly significant, as it could push the ratio of holders in loss below 55%. This milestone could trigger further buying pressure as more investors see an opportunity to move into profit territory.

Whales Return? On Volume And Market Cycle

Cardano’s price rally is also being fueled by a significant rise in trading volume, reaching a weekly high of $461 million according to Santiment. This surge in activity indicates growing interest in ADA, which could propel the price further upwards.

But can this momentum be sustained? The answer might lie with the “original whales,” the large investors who hold a significant portion of the cryptocurrency.

Interestingly, the current distribution of ADA shares some similarities with the market conditions in 2021, when the price hit $3. Back then, whales held roughly 6% of the total supply. Today, that number sits at nearly 7%, suggesting a potential return of these big players.

However, analysts caution that the success of this “whale comeback” narrative depends heavily on the broader market cycle. If the current bull market reaches its peak, ADA’s price growth could be restricted, hindering its ability to revisit its all-time high.

Can ADA Defy The Odds?

Cardano’s recent price surge has instilled a sense of cautious optimism in the cryptocurrency community. While the strong buying pressure from retail investors and the potential return of whales are positive signs, the profitability of current holders and the unpredictable nature of the market cycle pose challenges.

In the coming weeks, it will be crucial to observe whether ADA can overcome the selling pressure at $0.49 and sustain its upward trajectory. If trading volume continues to rise alongside the price, and if the current bull market holds, ADA might just surprise everyone and revisit its much-anticipated $3 mark.

Featured image from Pexels, chart from TradingView