Avalanche (AVAX) Price Dips As Market Turbulence Persists

AVAX is the native utility token of the Avalanche blockchain. The token is currently ranked 12th by market cap, with a total supply of 440,043,419 AVAX and a total trading volume of over $396,250,098 in the last 24 hours. Since its recent pullback at $36.15, AVAX has continued to move downward.

Currently, the general cryptocurrency market is bearish. This has led to the price of AVAX dropping below the 100-day Simple Moving Average (SMA) and the price might continue to drop in the next couple of days. As of the time of writing, the price of AVAX was trading around $33.52 and about 0.22% down in the last 24 hours.

Technical Indicators Point Toward A Sustained Downtrend For AVAX

To figure out where the AVAX price might be headed next, the following indicators can be used to examine the chart.

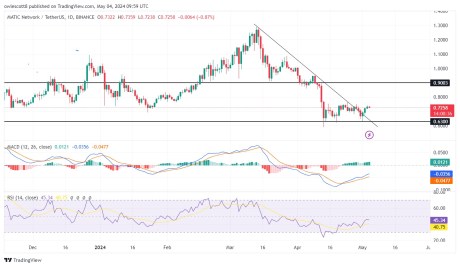
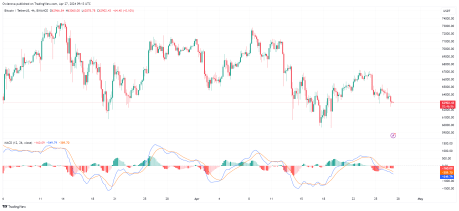
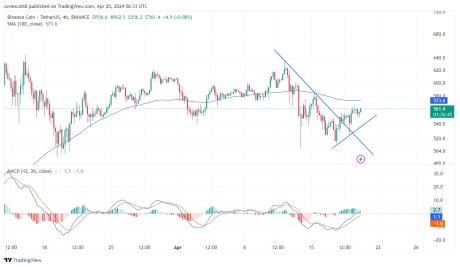
4-Day MACD: A technical look at the MACD indicator from the 4-hour timeframe, the MACD histograms are trending below the zero line, and both the MACD line and the Signal line crossed each other while trending below the MACD zero line, indicating a continuous movement on the downside. This can be seen in the below image.

AVAX

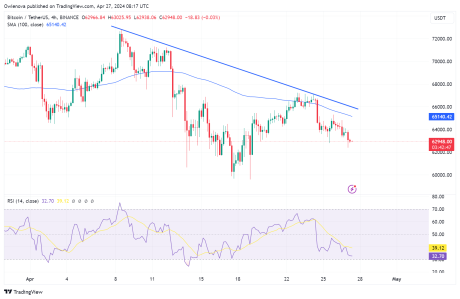
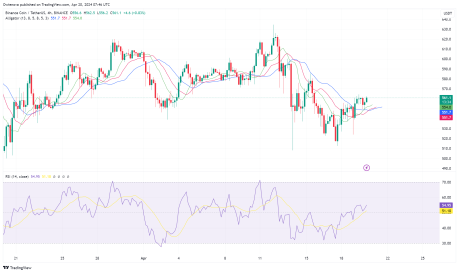
4-Day RSI: The formation of the Relative Strength Index (RSI) in the above image also suggests a downward continuation movement as the RSI signal line is seen to have moved above the 50% level and then dropped below it. This suggests that sellers are still very much active in the market therefore overpowering the strength of buyers.

Alligator Indicator: A look at the alligator indicator from the 4-hour time frame shows that AVAX is trading below the alligator lines as the alligator lip and teeth have both successfully crossed above the alligator jaw. It can also be seen that the price tried to move above the alligator lines but failed to do so, suggesting that the price might continue to move in its downward direction.

AVAX

The Coin Could Form A New Low

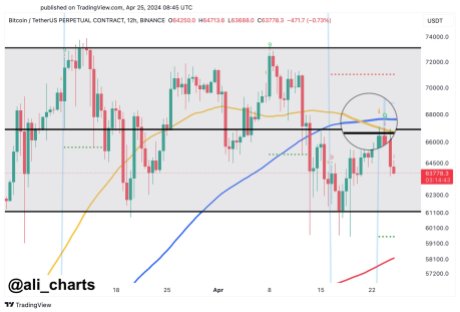
Conclusively, from the previous downward movement, AVAX has formed two resistance levels of $39.94 and $36.15 and a support level of $30.34. Currently, AVAX is moving toward this support level and if it breaks above this level, the price might drop even further to create a new low. 

On the contrary, if the price fails to break above this support, it will reverse and start an upward movement toward its previous resistance level of $36.15. Should AVAX manage to break above this resistance level, the price might move further to test the $39.94 resistance level.

AVAX

Bitcoin Bearish Signal: Analyst Predicts Potential Dip To $52,000

As the price action of Bitcoin continues to attract crypto investors’ interest, Michael Van De Poppe, a well-known market analyst and trader in a bearish scenario has made a worrying prediction, warning the community of a potential drop in price for the crypto asset to the $52,000 level.

Bitcoin Poised For A Possible Decline

Michael Van De Poppe’s prognosis explores the factors that are driving the gloomy view of Bitcoin‘s price trajectory, in the midst of market turbulence and uncertainty.

Van De Poppe affirms that the largest crypto asset by market cap is currently at the range low. For Bitcoin to maintain the range and the upward momentum to persist, this is technically the region it should probably hold.

Bitcoin

Should the asset fail to sustain this position, Van De Poppe anticipates a potential movement on the downside in the future. Thus, he has placed his price targets at $55,000 or even further toward the $52,000 threshold.

The post read:

Bitcoin is at the range low. This is technically the area where you’d prefer to see it hold, so the upward momentum continues, and the range holds. If this doesn’t hold, then we might expect $52-55K as a potential low on this correction.

Van De Poppe previously pointed out that Bitcoin is gradually moving close to the lower bounds of the range, in order to test support around $62,250 level. Consequently, it appears likely that BTC will keep moving toward the upside, following the breakout of the support level.

However, since the recently concluded Bitcoin Halving event, boredom has set in, suggesting a possible price decline. Thus, should a correction on the downside eventually take place, $52,000 and $55,000 are the two levels Van De Poppe expects BTC to drop to. Despite the negative outlook for BTC, the crypto expert thus far has urged investors to acquire more of the coin.

Opposite Sentiment On BTC’s Investment

While Poppe solicits investors to invest more in BTC, crypto critic and gold advocate Peter Schiff, on the other hand, has urged investors not to do so. Instead, Schiff has highlighted a possible impending massive rally for assets like Gold, Silver, and mining stocks.

He claims that the charts and the fundamentals have never looked this promising. Due to this, Schiff implored investors to engage more with these assets, saying Bitcoin is dead money and holders should sell before it is buried. “Take advantage of what could be the biggest precious metals bull market in history,” Schiff added.

As of today, Bitcoin’s price has shown resilience, fueling optimism of an upward movement. BTC has recovered the $63,000 price level once again after falling to nearly $60,700 on Thursday.

The digital asset is trading at $63,077, indicating a 3% rise in the last 24 hours. Data from CoinMarketCap shows that both the market cap and trading volume have also increased by 3.10% and 5.52%, respectively, in the past day.

Bitcoin

Analyst Narrows Down Timeline For Bitcoin Peak This Bull Cycle

Rekt Capital a popular cryptocurrency expert has set aside the potential timeline that Bitcoin, the largest crypto asset is expected to peak in the ongoing bull cycle, citing historical price trends. Rekt Capital’s analysis examines the current price action of Bitcoin and how it aligns with previous bull cycle peaks following the Bitcoin Halving event.

Bitcoin Peak On The Horizon

Today, May 9, BTC’s price witnessed a drop below the $61,000 price level, demonstrating a potential move on the downside. However, Rekt Capital is unshaken by this move as he believes the more Bitcoin consolidates between current price levels and $70,000 following the Halving, this cycle will slow down and resynchronize with its regular historically recurrent Halving cycle. As a result, given the price movements of past trends, he expects BTC to see a bull market top between the middle of September and October next year.

Furthermore, he noted that due to Bitcoin’s current two-month consolidation period, the present rate of cycle acceleration has dropped from 260 days to 210 days.

Bitcoin

The analyst highlighted that about 518 days after the Halving in the 2015-2017 cycle, BTC reached its market peak. Meanwhile, in the 2019-2021 bull cycle, it took the digital asset approximately 546 days after the Halving to top out.

Thus, in the event that BTC reiterates these trends and the next bull market top takes place between 518 and 546 days post-Halving event, Bitcoin’s peak this cycle might occur during the aforementioned timeframes. This is the reason why the expert is confident that the more time Bitcoin takes to stabilize, the better off it will be for bringing this cycle back in alignment with the customary Halving cycle.

Possible Retracement Before An Uptrend

While the analyst anticipates BTC to experience a retrace large enough to persuade investors that the bull market is over, he urges investors not to be shaken out as it will turn around eventually to resume its upward movement. According to Rekt Capital, fortunate investors understand that there are moments to panic and moments to accumulate and that the two often go hand in hand.

Currently, the price of Bitcoin is moving on the downside after a slight recovery on Wednesday. BTC’s price has now fallen close to $60,700 as it was unable to break above $65,500 once more.

Related Reading: Bitcoin Peak Pre-Halving Doesn’t Guarantee Further Gains: Analyst

At the time of writing, the digital asset in the weekly timeframe is demonstrating a positive momentum, while in the daily timeframe, it is trending on the downside. In the past week, BTC has increased by over 4% and has decreased by about 2.29% in the past day, trading at $60,860.

Both the trading volume and market cap are also down by 2.45% and 2.20% respectively in the last 24 hours.

Bitcoin

Crypto Expert Weighs In On ETH/BTC Pair’s Recent Decline

Amid turbulence surrounding the crypto market, popular founder and Chief Executive Officer (CEO) of Into The Cryptoverse Benjamin Cowen has taken the spotlight to shed his insights on the recent downtrend observed in the Ethereum/Bitcoin (ETH/BTC) pair. Cowen’s views examine the complex relationship between Ethereum and Bitcoin pricing and the potential for further downside risk.

According to Benjamin Cowen, the ETH/BTC pair is currently on the downside, and the last 2 times that the pair declined, ETHUSD witnessed a steep decline of around 70%. Given that the crypto community has been eagerly anticipating an Altcoin season for the past 2.5 years, Cowen thinks it is crucial to warn the community that there is still a possibility of a downward movement.

ETH/BTC Pair Rejected By The Bull Market Band

Cowen has also confirmed that ETH/BTC is presently being rejected by the bull market support band, which he previously predicted days back due to a price pump. “I would expect it (ETH/BTC) to be rejected by the bull market support band, at least when looking at weekly closes ($0.053-$0.054),” he stated. He further noted that the pump appears to be mirroring the last cycle of rate cuts right before summer capitulation.

Following the launch of Bitcoin Spot Exchange-Traded Funds (ETFs), Cowen mentioned that ETH/BTC saw a sharp rally. The analyst affirms that the rally was probably similar to the trend of the previous bull cycle, ushering in new lows.

ETH/BTC

Furthermore, Cowen stated that there has been an unquestionable macro downtrend since November 2021, particularly following the merger of the ETH/BTC pair. However, it is also evident that the market did not decrease abruptly.

As a result, investors held ETH instead of BTC all the way down from 0.085 to 0.048 because of the multiple lower highs, giving the impression that it was holding up quite well. 

Prior to the Bitcoin Halving, Cowen predicted that the bull market support band would reject ETH/BTC, at least when considering weekly closes ($0.053-$0.054), should there be a rebound after the Halving, similar to that witnessed with BTC spot ETF launch. Regardless of what occurs, the expert is confident that ETH/BTC will reach between $0.03 and $0.04 by this summer.

Heightened Divergence Between Ethereum And Bitcoin

Being the two leading cryptocurrency assets, there is great interest surrounding Ethereum and Bitcoin. However, on-chain analytics firm Glassnode has highlighted a shift in performance between both digital assets.

According to the firm, the performance of Ethereum and Bitcoin has been increasingly diverging so far in the 2023–2024 cycle. This is due to poorer performance in ETH price, which is explained by a generally weaker trend in capital rotation. In addition, this is evident when particularly compared to preceding cycles and all-time highs.

ETH/BTC

Bitcoin Local Bottom In? Analyst Offers Insights

In an ever-evolving world of cryptocurrency markets, deciding the bottom of Bitcoin price correction is an endeavor that attracts interest from both investors and analysts. Joining the fray is cryptocurrency analyst and trader MilkyBull offering insights on the subject, claiming that Bitcoin’s local bottom has developed due to a certain development.

Following its weekend recovery out of bear market territory, the price of Bitcoin slightly decreased on Monday. However, MilkyBull is confident that the recent retracement might be the last before BTC turns to move on the upside.

Bitcoin Local Bottom Is In

According to the expert, given that the next liquidity grab interest is above $64,557, the local bottom for Bitcoin is in. As a result, before moving on to the current all-time high of $73,000, BTC will first clear the $67,000 price level and consolidate. Thus, Bitcoin may eliminate the CME gap below either prior to or subsequent to eliminating the liquidity above $64,975.

Related Reading: Bitcoin Bottom In? Retracement From $73,800 Is Deeper And Took Longer To Form

The CME gap is a price difference that occurs between the Friday closing price and Sunday opening prices of the Chicago Mercantile Exchange (CME) Bitcoin futures market. Therefore, the expert considers this development a good area for long trade, signaling a buying opportunity for BTC bullish investors.

Bitcoin

MilkyBull further drew attention to a previous analysis that suggests Bitcoin could be poised for a rally due to historical patterns. The analyst noted that the 2017 price action shows that when BTC breached a new all-time high, there was a healthy retracement that was driven by liquidity before it surged to a cycle peak. 

Given that BTC might be mirroring this pattern, MilkyBull’s analysis might suggest that BTC has undergone its last shakeout, and a move on the upside could be imminent. He also confirmed that the present consolidation range was paralleled by the preceding consolidation, which began to materialize from December 2023 to February 2024. 

This pattern, identified as a manipulative strategy of the market makers (MMs) by the expert, is meant to remove degenerate Short-Term Holders (STHs), which are particularly vulnerable to price corrections below their cost base.

BTC Correction On The Horizon

While MilkyBull anticipates a rally, market expert Benjamin Cowen expects the leading cryptocurrency asset to drop in the upcoming days. Last week, Cowen claimed BTC’s Return On Investment (ROI) 12 days after the Bitcoin Halving event was the worst performance that the asset has experienced. According to Cowen, this is reasonable as it is the first time BTC is reaching a new all-time high before the Halving.

Almost a week later, there is still no improvement, as the analyst noted that BTC ROI is still performing worse than in previous cycles. Comparing this action with that of 2016, Cowen expects BTC to undergo a decline in the coming week.

During the time of writing, BTC was trading at $63,970, demonstrating an increase of over 3% in the past week. While its market cap is down by 1.17%, its daily trading volume has garnered positive sentiment, rising by 40%.

Bitcoin

Bitcoin Repeating Bull Cycle Trend From 8 Years Back: Analyst

Well-known cryptocurrency analyst and trader Rekt Capital has revealed an intriguing finding regarding Bitcoin’s price trend in a recent analysis. His ground-breaking prognosis reveals that the crypto asset is mirroring historical price action that took place during a bull cycle eight years ago.

Similar Historical Price Tendency In Bitcoin

Rekt Capital asserted that the way Bitcoin is reiterating a past price trend from a cycle 8 years ago is amazing. Given the magnitude of the 2016 bull cycle, BTC could be poised for significant growth in the upcoming months. During the 2016 bull cycle, BTC witnessed a notable growth of nearly 3,000%, following the conclusion of the Bitcoin Halving event

Moving on, Rekt Capital drew attention to his previous post regarding Bitcoin’s post-Halving movement, which he dubbed the Post-Halving Danger Zone. According to the analyst, the digital asset is currently caught up in this zone.

Bitcoin

He further noted that Bitcoin has veered to the negative below the current Re-Accumulation Range Low, repeating the pattern that began in 2016. In 2016, the move below the re-accumulation range was about 17%. However, this divergence in 2024 is down by 6%.

Rekt Capital previously affirms in 2016, about 21 days after the Halving, Bitcoin saw a lengthy -11% decline before transitioning toward the upside.

Thus, if there should be downside volatility in this cycle around the Re-Accumulation Range Low, 2016 data indicates that BTC could turn to the upside in the next 10 days, considering the post time.

Even though the Post-Halving “Danger Zone” ends in the upcoming days, particularly four days from now, Rekt Capital stated that 2016 data proves that there may be some negative volatility at the $60,600 Range Low in the interim. 

Pre-Halving Danger Zone For BTC

Notably, the expert also identified a Danger Zone before the event, where previous Pre-Halving retraces have always started. According to Rekt Capital, pre-Halving retracements have historically been seen in Bitcoin between 14 and 28 days before the event, and this cycle hasn’t been any different thus far.

He stated that Bitcoin saw its first pre-Halving retrace of -18% about 30 days before the Halving, while in 2016, the pre-Halving retrace started 28 days before the event, suggesting BTC could move in the same direction as that of 2016. Due to this, Rekt Capital is confident that a potential danger zone could occur after Halving.

However, the retracement from the current all-time high has now proven to be deeper and longer than past retracements, spanning several weeks. Consequently, the expert predicted a high probability that Bitcoin prices may have reached a bottom.

At the time of writing, the price of Bitcoin was seeing a positive sentiment, rising by 0.43% to $64,126 in the past day. Both its market cap and trading volume have increased by 0.50% and 24.43%, respectively, in the last 24 hours.

Bitcoin

MATIC Bullish Signals Abound: Technical Indicators Hint At Sustained Uptrend

MATIC is the native utility token of the Polygon blockchain and it is currently ranked 18th by market cap, with a total supply of 10 billion MATIC and a total trading volume of over $204 million in the last 24 hours. It has been moving upward since its last rejection at a $0.6342 support level.  

Following the recent bullish trend of the crypto market, MATIC has not been left behind as the price has been on an uptrend with very strong momentum for a while now. Since its last rejection point, MATIC has seen a price reversal of over 10%.

Technical Indicators Point Toward Sustained Uptrend For MATIC

To figure out where MATIC’s price might be headed next, several indicators can be used to examine the chart;

1-Day MACD: A technical look at the MACD indicator from the 4-hour timeframe, the MACD histograms are trending above the zero line, and both the MACD line and the Signal line have crossed and are heading towards the MACD zero line, indicating a bullish trend.

MATIC

1-Day RSI: the formation of the Relative Strength Index (RSI) in the above image also suggests an upward movement as the RSI signal line is seen moving toward the 50% level. This indicates that buyers are gradually becoming active in the market therefore overpowering the strength of sellers.

4-hour Alligator: A look at the alligator indicator from the 4-hour time frame shows that the crypto asset is trading above the alligator lines as the alligator lip and teeth have both successfully crossed above the alligator jaw, suggesting that the price might continue to move in an upward direction.

MATIC

Potential Price Movement

From the previous downward movement, the price of MATIC has managed to create one major resistance level of $0.7365 and one major support level of $0.6324. Currently, MATIC is moving toward this resistance level and if it breaks above this level, it might go even further to test the next resistance level of $0.7680. 

However, if it fails to break above this major resistance, it will reverse and start a downward movement toward its previous support. Also, if it manages to break below this support level, the price might move further downward thereby continuing on its downtrend. As of the time of writing the price of MATIC was trading around $0.7253 and about -0.94% down in the last 24 hour

MATIC

Analyst Discusses Bitcoin Price Path To Heighten Fear Factor

MilkyBull, a well-known personality in the world of cryptocurrency analysis, has drawn attention lately for his analysis of Bitcoin’s price trajectory and his prediction of a situation that might cause more fear in the market.

MilkyBull’s analysis delves into the subtleties of Bitcoin’s movement, identifying patterns and trends that could have a big impact on investor mood. 

Bitcoin Triggering Anxiety In The Market

According to the analyst, the market will get even more fearful of the Bitcoin price path before it bottoms out and continues to rise. The analyst claimed that because of the current price of BTC, Blackrock iShares Bitcoin Trust (IBIT) saw its first-ever outflows since the approval of the Bitcoin Spot Exchange-Traded Funds (ETFs).

Furthermore, he reminded us that positive news always denotes the peak of a Bitcoin bull cycle, while negative news denotes the bottom. With this notion, investors could position themselves for the next trajectory BTC takes.

To further explore his narrative, MilkyBull drew attention to a previous analysis regarding Bitcoin’s final local bottom in this cycle. Given that BTC is following the PA (Price Action) of 2017, MilkyBull believes that the crypto asset might have bottomed out or come close to it.

Historically, the bull market support band strongly sustains the Bitcoin market in bull cycles. As a result, the analyst is confident that Bitcoin’s price may wick through the support and recover.

Another aspect highlighted by the expert is the Global liquidity during past bull cycles. Presently, Global liquidity is closely linked to Bitcoin at a level where it recovered in October 2022 and October 2023, which led to the inception of a massive surge in the digital assets markets, sparking a massive surge in the whole cryptocurrency market. 

With the macro volatility on Tuesday, MilkyBull stated that Bitcoin is at a pivotal juncture for the last local bottom before it resumes its rise to the cycle peak. Though the market does not always respond to such expectations, the majority of members in the crypto space are requesting a correction to $48,000.

BTC Poised For A Breakout On The Upside

Another crypto analyst Captain Faibik has also spotted the largest cryptocurrency asset undergoing a price recovery lately. According to the expert, although BTC is currently seeing a rebound, it is still moving inside the falling wedge formation.

Related Reading: Bitcoin Loses Historical Level, Analyst Says “Reclaim And Bounce, Or Die”

Thus, Bitcoin’s bullish investors must overcome the $61,000 resistance level for the digital asset to break out from this formation. Should BTC break out from this formation successfully, Captain Faibik anticipates a notable move on the upside toward $78,000.

Given that BTC is already trading above $61,000, all eyes are now set on the $78,000 price level. At the time of writing, BTC was situated at $61,701, indicating a rise of over 5% in the past day. Data from CoinMarketCap shows that its market cap has increased by 5%, while the trading volume is down by 21%.

Bitcoin

Bitcoin Déjà Vu: Analyst Identifies Trends Reflecting 2016 Cycle

Cryptocurrency analyst Rekt Capital has come up with an intriguing narrative pointing to several trends in the current price action of Bitcoin that are similar to the price trends seen in the 2016 bull cycle, even as market sentiments continue to dwindle. 

Bitcoin Trends Reiterating 2016 Pattern

According to Rekt Capital, more than a month after the initial analysis, Bitcoin keeps demonstrating how much it closely resembles the cycle of 2016. Similar to 2016, Bitcoin has experienced further declines over the past three weeks following the Halving below the Range Low of its Re-Accumulation Range also known as the Post-Halving Danger Zone

The post read:

Over a month later Bitcoin continues to prove how it is more similar to the 2016 cycle. Just like in 2016, Bitcoin in this cycle is seeing additional downside below the Range Low of its Re-Accumulation Range in the three-week window after the Halving (i.e. Post-Halving “Danger Zone”).

Given that Rekt Capital already addressed the concept of the Post-Halving Danger Zone, the analyst is not shocked by this current price decrease. During the 2016 cycle, about 21 days after the Halving event, BTC saw a lengthy decline of 11% before transitioning toward an upward direction.

Bitcoin

It is worth noting that Rekt Capital noted that if downside volatility around the Re-Accumulation Range Low is going to happen in this cycle, 2016 history indicates it may happen during the 15 days following the Halving. Since the recent event was concluded about 12 days ago, the expert’s prediction could be realized in the upcoming days.

Related Reading: Bitcoin Enters ‘Danger Zone’ Post-Halving, Analyst Warns Of Potential Downside

While the Post-Halving “Danger Zone” ends in 15 days, 2016 data suggests that there may be some negative volatility in the interim, possibly reaching the $60600 Range Low.

Drawing attention to previous patterns, Rekt Capital highlighted a similar pattern between the 2016 and 2024 pre-Halving re-accumulation range. After a breakout from the re-accumulation range this year, BTC witnessed a Pre-Halving rally, as was observed in 2016.

Pre-Halving Retrace Movement

Just like in 2016, once the pre-Halving rally peaked, Bitcoin started its Pre-Halving retrace. Specifically, this occurred roughly 28 days prior to the Halving event in both 2016 and 2024.

A negative wick on the weekly candle indicates a significant reaction in the first week of the pre-Halving Retrace in 2016. However, this reaction was fleeting and came before an extended price decline.

This cycle likewise saw a strong early reaction from Bitcoin via a downward wick, but there are indications that this reaction might not have lasted long. Thus, to avoid a fate similar to that of 2016, Rekt Capital believes that BTC will need to maintain highs around $60,000 and beyond.

Bitcoin

Bitcoin Milestone Ahead? Analyst Forecasts New Peak This Month

In the face of a general market decline and pessimism, Captain Faibik, a cryptocurrency expert and enthusiast, has emerged with an optimistic outlook for Bitcoin (BTC) foreseeable future trajectory, predicting that the crypto asset could rise to a new all-time high before this current month closes. 

Bitcoin To Reach New All-Time High In May

Faibik’s analysis, which is based on his in-depth knowledge of cryptocurrency dynamics and a sharp eye for market trends, explores the possibility of a large short-term rise in Bitcoin. According to the analyst, Bitcoin is at a key junction currently testing the daily Moving Average 100 (MA100) level once more after recovering from it in the past.

Bitcoin

Historically, the crypto asset has found considerable support at the 100MA level. Should BTC recover from this point on, Captain Faibik anticipates a significant rise on the upside in the upcoming days. Thus, he expects the digital asset to reach a new all-time high within the month.

The post read:

Last time, BTC bounced back from the daily MA100, and now it is testing it again. If it bounces back from here, we can expect a Bullish Rally in the coming days. New All the High could be incoming this month

The crypto analyst noted Bitcoin’s price action in the daily timeframe also suggests that a bullish rise is on the horizon. Faibik stated that on the daily timeframe chart, BTC is still moving above the major trendline and inside the green box indicated in his chart. As a result, the analyst expects BTC to undergo a quick comeback.

Related Reading: If History Repeats, This Is How Bitcoin Price Will Perform In The Next 6 Months

Another notable finding from Captain Faibik is that the daily Relative Strength Index (RSI) has been drifting below a trendline that has been in place for some months. Although this might indicate a brief waning of positive momentum, Faibik interprets it as a sign of an impending price recovery for Bitcoin. Given that BTC is still moving inside the bullish flag pattern, the expert anticipates a bounce back towards $68,000 in the upcoming days.

$100,000 Price Target For BTC

Captain Faibik’s most bullish target for BTC recently is the $100,000 price mark. Last week, Faibik pointed out key narratives that could catalyze Bitcoin’s price to $100,000 in the coming months.

According to the expert, the presence of bullish investors in the market was the reason why BTC was trying to make a comeback in the previous week. Thus, for a significant price increase to $100,000, these investors must retake the crucial resistance level of $72,000.

Furthermore, Faibik highlighted that BTC Bulls have solidly secured the weekly Exponential Moving Average (EMA) 10 following the October 2017 Descending Channel breakout. Due to this, the crypto analyst is setting $100,000 as the digital asset’s next price target.

Following a decrease of more than 13% over the previous 7 days, the price of Bitcoin is currently trading at $57,701. In the last day, its market cap has plummeted by over 6%, while its trading volume has increased by about 61%.

Bitcoin

Major Bitcoin Developments Points To A Wilder Bull Cycle Than Anticipated

Lark Davis, a well-known cryptocurrency analyst and trader, has identified several significant developments in the Bitcoin ecosystem that could trigger an even more intense bull cycle than initially anticipated. Davis’s perspective delves into the revolutionary changes in the Bitcoin ecosystem, such as institutional and global acceptance, which hold the potential to accelerate the current bull market.

According to the analyst, there is about to be a big shock to the Bitcoin supply. This is a result of miners now being able to produce just 450 BTC each day, due to the recently concluded Bitcoin Halving event, which cut down miners’ reward in half.

Bitcoin Spot ETFs Poised To Catalyzed Prices

Another key catalyst pointed out by Davis is the US Spot Bitcoin Exchange-Traded Funds (ETFs). Since the approval of the products by the United States Securities and Exchange Commission (SEC) on January 10, over 3,000 BTC have been purchased on a daily basis. Consequently, BTC witnessed a surge of nearly 60%, rising from around $46,000 to $73,000 after the SEC green light BTC spot ETFs.

The latest country to approve the Spot Bitcoin ETFs is Hong Kong. Two weeks ago, the Securities and Futures Commission of Hong Kong granted approval for BTC Spot ETFs to multiple leading asset managers, thereby positioning the city as a primary hub for these products. Given the previous impact of the funds propelling BTC to a new all-time high, the approval of the products in HK could cause the asset to see another surge in value.

Hong Kong’s move to approve the spot ETF products, which have already started trading today, has inspired other Asian countries, such as South Korea, Japan, and Singapore, to consider doing the same. On the other hand, the Australia Securities Exchange is already on the verge of accepting the funds within the year.

As a result of these developments, institutions from all around the world are vying for a share of the Bitcoin market. This could trigger a much broader adoption of BTC, thereby impacting prices significantly.

Davis highlighted that the availability of Bitcoin on all exchanges is presently at a record low, and the OTC desks are getting low. Due to this, the crypto expert believes this current bull cycle will be far crazier than predicted.

BTC Prices Continue To Struggle

Despite the funds clearance in Hong Kong, BTC has yet to witness major price movements, as it continues to struggle between $61,000 and $66,000. Given this, several analysts are anticipating a further price decline in the coming weeks.

Bitcoin is currently trading at $61,322, indicating a decline of 1.60% in the last 24 hours. Its trading volume has increased by 41%, but its market cap is down by over 1% in the past day.

Bitcoin

Bitcoin Long-Term Outlook: Analyst Foresees Peak In Late 2025

Following the fourth Bitcoin Halving, Rekt Capital, a popular cryptocurrency trader and expert, has offered a compelling narrative on the future trajectory of Bitcoin, predicting that the crypto asset could peak this bull cycle in the following year. Rekt Capital’s analysis emphasizes on the possibility that this current cycle could reiterate past Halving cycle trends, positioning BTC for significant gains in the coming months.

Bitcoin Could Mirror Past Halving Cycle

According to the analyst, Bitcoin reached its all-time high within 518 days following the Halving in the 2015–2017 cycle. Meanwhile, after the event in the 2019-2021 bull cycle, the digital asset topped out within 546 days. This suggests that the event has always catalyzed massive growth for the leading cryptocurrency asset.

Should the past trend hold, the next bull market top might happen between 518 and 546 days following the recently concluded fourth Halving, particularly around the middle of September or middle of October in 2025, according to Rekt Capital.

The analyst noted that in this cycle Bitcoin is accelerating by about 220 days currently. Thus, the longer time BTC consolidates after this Halving, it will be better for resynchronizing this current cycle with the previous events cycle.

Bitcoin

Rekt Capital also noted that Bitcoin has experienced further declines in the three weeks after the Halving, according to historical data from 2016. He has labeled the period as the Post-Halving “Danger Zone,” this is where there is a chance of downside volatility at the range low of the Re-accumulation Range.

In 2016, approximately 21 days after the occurrence, Bitcoin saw a lengthy -11% decline before gaining momentum toward the upside. However, data for 2016 indicates that if there will be downside volatility in this cycle around the Re-Accumulation Range Low, it may happen during the following 15 days.

Although the post-Halving danger zone ends in 15 days, the 2016 data indicates that there may be some negative volatility in the interim, possibly reaching the $60,600 Range Low.

Parabolic Phase For BTC

It is worth noting that Rekt Capital anticipates a parabolic phase after the re-accumulation phase is concluded. During this stage, Bitcoin usually sees massive growth leading all the way up to a new all-time high.

In the previous Halvings, Bitcoin would historically consolidate in this Re-Accumulation Range for up to 150 days before ultimately entering a parabolic phase. Once BTC breaks out of this re-accumulation stage, Rekt Capital expects BTC to see a parabolic upside by September this year if it consolidates within the aforementioned timeframe.

At the time of writing, BTC was down by over 5% in the past 7 days and was trading at $62,504. Presently, its market cap is down by 1.53%, while its trading volume has increased by over 22% in the last 24 hours.

Bitcoin

Bitcoin Drops Below 4-Hour MA – Bearish Trend Ahead?

Following a pullback, the price of Bitcoin has continued on its downward movement. The coin, after failing to break above the 100-day Simple Moving Average (SMA) and the trend line has experienced a drop of over 6% from its previous high.

Will the price of BTC continue to move in a downward direction or will it reverse and start moving in an upward direction?

As of the time of writing, the price of BTC was trading around $62,972 which is about 28% down from its all-time high and was down by 1.27% in the last 24 hours. Although the price is trading below the 100 SMA on the 4-hour chart, on the daily chart it is still trading above the 100 SMA.

Current Condition Of Indicators And What They Suggest

Looking at the chart, technically a support level and a resistance level of $59,653 and  $67,255 were formed respectively. However, there could be more support and resistance levels created if the price continues to move downward.

Bitcoin

4-Hour Moving Average: A technical observation of the chart from the 4-hour timeframe as seen in the image below reveals that the price is trending below the 100-day moving average. This suggests that the price is on a downtrend and could potentially move further downward.

4-Hour RSI indicator: The Relative Strength Index (RSI) indicator here suggests a downward trend as the RSI signal has crossed and is trending below the 50% line as observed on the above chart.

Bitcoin

The MACD indicator from the 4-hour chart also suggests that the price might continue to move downward as the MACD histograms are trending below the zero line. Both the MACD line and the Signal line have crossed and are trending below the MACD zero line, indicating a bearish trend, as seen in the above image.

Possible Outcome

With the setup of the above indicators, it can be suggested that the price of Bitcoin is still bearish and that there are possibilities that it could still move further downward.

If Bitcoin continues downward and breaks below the support level of $59,653, it could witness a deep correction to create a new support level. However, if the price fails to break below this support level, it could start an upward correctional movement towards its previous level of $67,255 and if it manages to break above this level, the price will begin an uptrend.

Bitcoin

Bitcoin Bearish Signal: Analyst Warns Of Potential Drop To $59,000

Amidst the anticipated positive effect of the recently concluded Bitcoin Halving event, Ali Martinez, a well-known cryptocurrency analyst and trader has issued a noteworthy warning about BTC’s trajectory, predicting that the price of the crypto asset could undergo a correction to the $59,000 mark.

Potential Declines For Bitcoin

Martinez’s analysis delves into the potential for Bitcoin to experience possible dives on the downside in the short term. Considering the BTC’s chart in the 12-hour timeframe, the analyst noted that two signals have manifested signaling potential price declines.

Related Reading: Analyst Points To Possible 30% Bitcoin Correction, Calls For Caution

These include a red candlestick from the TD (Tom Demark) Sequential and a death cross between the 50 and 100 Simple Moving Average (SMA). As a result, Martinez believes that the development could trigger a price drop to $63,300. Additionally, he urged the community to be ready for further dips to around $61,000 and $59,000.

Bitcoin

Martinez previously highlighted that the TD Sequential indicator on the 12-hour chart has flashed a sell signal. This signal came in light of Bitcoin experiencing a mid-level resistance of a parallel channel. Given this, he underscores a cautious approach amidst times like this, given the history of this indication, especially in the event that the digital asset falls below the $65,500 support level.

According to the expert, the trend score for the coin’s accumulation has fallen to zero. Specifically, this suggests that whales are either distributing or not hoarding BTC at the moment.

It seems Martinez’s forecast has taken place as BTC is already trading below the aforementioned support level. Following the price decline, Bitcoin has also seen a notable drop in accumulation.

Over the past few weeks, there has been consolidation in Bitcoin’s price as it has been unable to sustain its surge over its all-time high of $73,000 achieved in March. On Thursday, BTC witnessed a notable drop to around $63,000, which higher inflation and slower growth in the United States were considered to be a catalyst for the drop.

BTC’s Path To $1 Million

Even though there have been some short-term swings with Bitcoin, its long-term trend is still positive. Jack Mallers, the Chief Executive Officer (CEO) of Strike has predicted a long-term growth for BTC to a whopping $1 million.

Mallers shared his perspective on the digital asset’s future trajectory during an interview with David Lin. The financial instability in the bond markets, which significantly involves banks, is the foundation upon which Maller draws his projection.

He asserts that significant liquidity infusions could result from the possible rescue needed to stabilize these markets, driving up the price of assets like Bitcoin. Mallers believes BTC’s value will rise, underlining the limited availability of BTC when paired with rising demand.

At the time of writing, BTC was trading at $64,207, indicating a 0.72% increase in the last 24 hours. Despite the crypto asset showing positive signs, its trading volume is down by over 8% in the past day.

Bitcoin

Analysts Identify Key Scenario For Bitcoin Hitting $100,000

Prior to the Bitcoin Halving event, BTC’s price saw considerable instability, but it has since rebounded, reaching the $66,000 level, triggering bullish predictions from top crypto analysts regarding the coin’s future path.

Captain Faibik, a crytocurrency analyst and trader, has emerged with an intriguing prediction, underscoring a narrative that could potentially propel the price of Bitcoin to the coveted $100,000 mark in the upcoming months.

Bitcoin Poised For A Notable Rally To $100,000 

According to Captain Faibik, Bitcoin has managed to hold the $60,000 support level in the wake of bullish investors in the market. As a result, the largest crypto asset by market cap is currently making a strong comeback.

These bullish investors, according to Faibik must reclaim the crucial $72,000 resistance level in order to see a major rally to the $100,000 price level. This scenario acts as a ray of hope for the cryptocurrency community, igniting speculations and influencing projections about Bitcoin’s potential for future growth. Given the anticipated impact of the Bitcoin Halving and bulls, the $72,000 level could be realized in the short term.

Bitcoin

The expert previously highlighted that the Bitcoin weekly candle closed above the Exponential Moving Average (EMA) 10, demonstrating that the bulls are still very much in charge of the market. Following the Descending Channel break out in October last year, BTC Bulls has firmly secured the weekly EMA10, prompting the crypto analyst to put his next price target for the digital asset at $100,000.

Faibik also noted that the daily Relative Strength Index (RSI) for Bitcoin has emerged from a falling wedge pattern. This breakout suggests that a 15% to 20% bullish rally in Bitcoin’s value is on the horizon.

Meanwhile, in the daily timeframe, a bullish flag formation is underway, and in the event of an upward breakout from the bullish flag, Faibik anticipates a new all-time high for Bitcoin by May.

Is A $1.5 million Price Level Possible For BTC?

One of the most bullish predictions for Bitcoin this year came from Ark Invest Chief Executive Officer (CEO) Cathie Wood. The CEO foresees the digital asset to rise by over 2,000% reaching a whopping $1.5 million by 2030.

During an interview in Hong Kong, Wood reiterated her projections for BTC, which were supported by a thorough investigation that included institution surveys and evaluations of market volatility.

She stated:

I have been asked this question from different angles, and our analysis from multiple perspectives indicates that by 2030, Bitcoin could rise to $1.5 million. This price prediction is based on a survey of institutions, using a discount rate and volatility analysis.

Initially, Wood’s forecast for Bitcoin was estimated at $600,000 in the next six years. However, considering the effect of the Bitcoin Spot Exchange-Traded Funds (ETFs), she now believes the coin has the potential to hit $1.5 million.

Bitcoin

Bitcoin Market Dynamics Still Positive Post-Halving – Bitfinex Analysis

In the midst of the dramatic changes that have occurred in the cryptocurrency space after the Bitcoin halving event, Bitfinex provides a perceptive analysis that reassures investors that the market dynamics of BTC have remained positive in the post-halving period. Bitfinex examines the on-chain data and finds encouraging signs for Bitcoin in spite of the United States economy’s current state of uncertainty in its most recent Alpha report, which was released on April 22.

Bitcoin Market Dynamics Remains Bullish

According to the Hong Kong-based crypto platform, exchange withdrawals of Bitcoin are currently at levels not seen since January 2023. This simply indicates that a lot of investors are putting their assets in cold storage in expectation of price rises.

Also, the exchange noted that long-term investors’ aggressive selling has not yet caused the usual pre-halving price decline, which suggests that new market participants are absorbing the selling pressure quite well, highlighting the tenacity of the present market structure of Bitcoin.

The Bitfinex Alpha report revealed that the average daily net inflow from spot Bitcoin Exchange-Traded Funds (ETFs) is $150 million. Given the ETFs’ inflows far exceeding the $30 and $40 million daily issuance rate of BTC following the halving, this significant supply and demand imbalance could encourage further price appreciation.

Bitfinex further claims the massive purchases of spot Bitcoin ETFs, which have dominated the entire year’s market narrative, may decline. However, recent ETF outflows have shown that ETF demand may be starting to stabilize.

It is important to note that the recently concluded Halving cut down miners’ reward from 6.25 BTC to 3.125 BTC. As a result, miners are now modifying their operating tactics in order to sustain their activities against the decline in reward following the Halving.

Thus, the amount of Bitcoin that miners are sending to exchanges has significantly decreased, which may indicate that they are selling ahead of time or collateralizing their holdings to upgrade infrastructure. Consequently, this could possibly lead to a gradual increase in selling pressure rather than a sudden drop in value at the Halving.

New BTC Whales Surpassed Old Whales

Since the conclusion of the fourth Halving, on-chain data shows a significant rise in new Bitcoin whales. CryptoQuant Chief Executive Officer (CEO) Ki Young Ju, reported the development, noting that the initial investment made by the new whales in Bitcoin is nearly twice that of the old whales combined.

According to the data, the total holding by these new whales, which are short-term holders, is valued at $110.6 billion. Meanwhile, the old whales, which are long-term holders, own a whopping $67 billion worth of BTC. This change in whale demographics may impact Bitcoin’s future course and the dynamics of the cryptocurrency landscape as a whole.

Bitcoin

Ethereum Spot ETFs Approval Skepticism Persists, As ETH Recovers

Ethereum Spot Exchange-Traded Funds (ETFs) approval odds continue to witness notable pessimism as the cryptocurrency space awaits the United States Securities and Exchange Commission’s (SEC) decision on the products scheduled for May.

The expectation surrounding the SEC’s decision highlights how important ETF approval is in terms of giving conventional investors more convenient access to Ethereum’s spot market. Presently, data from Polymarket, the world’s largest prediction market, shows that ETH ETF approval odds have fallen to a mere 11%.

Pessimism Deepens As Ethereum ETFs Remain Uncertain

As the May deadline draws near, doubt and skepticism loom large on the horizon, casting a dark shadow for the products. One of the most recent figures to voice doubts about the SEC’s willingness to approve the exchange-traded products this May is Nate Geraci, the president of ETF Store.

According to Geraci, the regulatory watchdog is eerily silent on Ethereum spot ETFs. He further suggested that the products might not be approved due to the SEC’s significantly lower level of engagement with ETF issuers than in previous interactions.

“Logic says that is correct, but also wonder if SEC learned a lesson from clown show with spot Bitcoin ETFs,” he added. Thus, he has pointed out two possible options for the products, which are either an approval or lawsuit from the Commission.

Commenting on the president’s insights, a pseudonymous X user questioned if there is a possibility that activities are taking place behind closed doors in order to avoid disrupting the pre-launch market. Geraci responded, saying he believes that could be possible, drawing attention to Van Eck CEO Jan Van Eck’s review, which might prove otherwise.

It is worth noting that Van Eck is one of the earliest firms to submit its application for an Ethereum exchange product. Even though the company was the first to file for an application, Jan Van Eck is pessimistic about the approval of the ETPs, saying they will probably be rejected in May.

He stated:

The way the legal process goes is the regulators will give you comments on your application, and that happened for weeks and weeks before the Bitcoin ETFs. And right now, pins are dropping as far as Ethereum is concerned.

In light of this, investors prepare for an unpredictable result while managing market swings and modifying their investment plans in the face of changing regulations.

ETH Price Sees Positive Movement

While Ethereum ETFs might be experiencing negative sentiment, ETH, on the other hand, has witnessed a positive uptick lately. ETH has revisited the $3,000 level again after falling as low as $2,888 during the weekend.

Today, ETH price rose by over 4%, reaching around $3,234, indicating potential for further price recovery. At the time of writing, Ethereum was trading at $3,215, demonstrating an increase of 1.40% in the past day.

Also, the asset’s market cap and trading volume are up by 1.40% and 5.96% in the last 24 hours. Given the anticipated impact of the recently concluded Bitcoin Halving on cryptocurrencies, ETH could be poised for noteworthy moves in the coming months.

Ethereum

BNB Resilience: Holding Firm At $560 – What’s Next?

The price of BNB hasn’t fallen below its previous low, and it’s showing some strong signs of heading up. After a spell of moving downward, the Binance Smart Chain’s native token is aiming for an upward bounce back towards its earlier high.

Technical Indicators Point Toward Sustained Uptrend For BNB

To figure out where the BNB price might be headed next, several indicators can be used to examine the chart:

BNB

4-Hour MACD: A technical look at the MACD indicator from the 4-hour timeframe, the MACD histograms are trending above the zero line, and both the MACD line and the Signal line have crossed and are heading towards the MACD zero line, indicating a bullish trend. This can be seen in the above image.

RSI 4-hour Timeframe: The formation of the Relative Strength Index (RSI) in the below image also suggests an upward movement as the RSI signal line is seen trending above the 50% level. This indicates that buyers are still very active in the market therefore overpowering the strength of sellers.

4-hour alligator: A look at the alligator indicator from the 4-hour time frame shows that BNB is trading above the alligator lines as the alligator lip and teeth have both successfully crossed above the alligator jaw, suggesting that the price might be starting a new rally.

BNB

At the time of writing, the price of BNB was up by 1.35% and was trading around $561 in the last 24 hours. BNB price is showing bullish signs and also forming a base above the $508.1 support level. Also, the price is trading above the bearish trend line and below the 100 Simple Moving Average (SMA) on the 4-hour chart.

Final Thoughts

From the previous downward movement, the price of BNB has managed to create one major resistance level of $635 and one major support level of $508. Currently, BNB is moving toward this resistance level and if it breaks above this level, the price might go even further to create a new high. 

On the other hand, if the price fails to break above this major resistance, it will reverse and start a downward movement toward its previous support and if it manages to break below this support level, the price might move further downward thereby starting a new downward trend.

BNB

Bitcoin Halving Could Catalyzed $100,000 Price Surge: Bitwise CEO

As the cryptocurrency community excitedly awaits the impending Bitcoin halving, Bitwise Chief Executive Officer (CEO) Hunter Horsley has weighed in on its impact on BTC, predicting that the event could potentially propel prices to $100,000 or even higher.

Horsley expressed his optimistic outlook toward the upcoming Bitcoin Halving on the X (formerly Twitter) platform. Every four years, the Halving has historically been linked to greater price increases, and Horsley’s upbeat view indicates that this cycle might be no different from the others.

Upcoming Bitcoin Halving Is Being Underestimated

According to the CEO, the much-anticipated event is presently being significantly underestimated in the crypto space. He claims that the market has never priced in it in the past, and it will not be priced in this time either, expressing his confidence toward the occasion.

Horsley highlighted the historical relevance and transformative implications of these occurrences, drawing comparisons with past Halvings and citing the notable profits that investors achieved in 2020, 2016, and 2012. He stated that following months of debate by investors on whether the previous three halvings were priced in, Bitcoin grew by 5.4x, 2.8x, and 88x, respectively.

Given the past price developments, the Bitwise CEO anticipates this Halving to serve as a catalyst for the $100,000 target for BTC. Horsley’s prediction seems very reasonable since the figure is just about a 47% increase from the digital asset’s current price.

It is worth noting that the opinions of fully deployed current holders are not used to measure the impact of the Halving. Rather, it depends on whether there will be a significant and sustained increase in demand in addition to the daily decrease in the supply of natural sellers. 

In all, the Bitwise CEO foresees a steady growth in demand along with the conditions for a substantial Halving event this year. As investors prepare for the possible impact of this historic occasion on Bitcoin’s price trajectory, this audacious prognosis highlights the possibility of massive price increases not only in BTC but the entire cryptocurrency market.

BTC Move Into No Man’s Land

With the Halving less than 24 hours away, Cold Blooded Shiller, a cryptocurrency analyst, has reported that Bitcoin has entered No Man’s Land. “There are some interesting discussion points on BTC right now, but we have just entered No Man’s Land,” he stated.

According to Shiller, until one of the two green zones highlighted in his chart is contacted, he believes the price action is far more unpredictable. Nonetheless, there are some interesting links here for former price action and Relative Strength Index (RSI).

The analyst claimed the RSI is currently resetting on the Higher Time Frame (HTF), and the last time it occurred was back in January, following a similar breakdown from consolidation seen now.

While Shiller does not think the results will be the same this time, it’s quite reasonable if no recovery happens due to this degree of loss.

Bitcoin