Solana (SOL) Continues To Register Notable Gains Daily, Is $50 the Target?

Solana opened this month on high momentum, consistently posting notable gains over the past few days. SOL scored a weekly high of $45.36 on November 1 before receding. But after a brief decline to the $40 price level, the bulls have regained momentum, intent on pushing closer to $50 this time. But it remains to see if SOL bulls have enough momentum to rally that high.

SOL Bucks All Odds As It Vies For Higher Highs

Despite the high volatility in the altcoin market, Solana (SOL) has refused to back down. The Ethereum killer has continued its uptrend in the past two weeks, making it one of the top-gaining cryptocurrencies today.

SOL graces the top gainers’ list as the fifth-highest gainer in today’s trading session. Solana is trading at $43.23, with over 3% price increase in the last 24 hours.

Solana Bulls have continued to fight off significant sell pressure caused by FTX-related transfers. The crypto exchange is selling millions of crypto assets to pay its debts to customers as it seeks a fresh start.

Reports revealed that the court approved FTX to sell $3 billion worth of crypto assets frozen on the exchange since last year. On-chain data from Spot On Chain shows that the defunct crypto exchange FTX owns millions of SOL coins. According to Spot on Chain’s latest updates, FTX and Alameda have transferred approximately $223 million worth of Solana coins to exchanges. 

However, these large inflows of Solana in the market didn’t cause a decline. Instead, SOL’s price entered a rising channel, initiating an uptrend.

The most significant upturn was when the crypto breached the critical resistance at $22 in mid-October. SOL has been unstoppable since then, crossing the $30 price mark and rising above $40, a position it has maintained in the last few days.

Solana’s price is now over 86% higher than its past month’s value, with a 9.70% seven-day price increase, according to CoinMarketCap data.

SOL Market Outlook As It Flips Over A Multi-month Trendline 

As depicted on the chart below, SOL has broken from a multi-month trendline channel, flipping a significant resistance level at $27.58 to support. The $27 price level is the new trendline pivot as it forms a new channel.

SOL chart

If SOL manages to remain above the $42 price level, given the ongoing bullish momentum, the next target price is $46.83. Maintaining this level could facilitate more rallies to $50 in the coming days. But buyers have to apply more pressure to remain in control.

However, if the bears fail to maintain the $42 price, SOL could decline to $39 and subsequently to $31.43 if the bears mount more pressure.

Meanwhile, SOL continues to live up to its alias, the Ethereum Killer. An update from on-chain data provider Kaiko shows that SOL has outperformed Ethereum since September.

The increase in the SOL/ETH ratio since September confirms this assumption. The SOL/ETH ratio has climbed from 0.011 to nearly 0.025 and is now back to the pre-FTX collapse levels.
Self-Authentication System Of Shiba Inu Has Technical Issues, Developer Reveals

The newly launched SHIB self-authentication system, Shibdentity, has witnessed some technical issues. Kaal Dhairya, a Shiba Inu developer, revealed this today, November 7. As part of their efforts to make the Shib Ecosystem self-sufficient, the developers also introduced The Shib Magazine.

Shiba Inu Developers Launches The Shib Magazine

The Shiba Inu developers recently launched Shib Name Service (SNS) on its layer-2 network, Shibarium. The Shib Name Service aims to introduce the Shibdentity, a self-custodial identity system for the SHIB ecosystem

The product aims to make the ecosystem sufficiently decentralized so users wouldn’t have to depend on third-party platforms. Shibdentity creates a decentralized identity platform, enhancing security and user experience and eliminating censorship so that users can control their digital identities.

As stated in an October 31 disclosure, the launch of the SNS marks a milestone for Shiba Inu. The team described the newly launched feature as a disruptor introducing something special and human-readable addresses to the ecosystem. 

It allows users to self-manage their Shibarium addresses without third-party interference. They can quickly transfer tokens to others using unique initials. 

Meanwhile, the SHIB self-authentication system Shibdentity, launched on November 1, developed some technical issues. The developer has yet to reveal the reason behind the technical glitch. However, the issue may be due to overwhelming traffic on the system. 

Dhairya noted that the developer team is working to resolve the issues and have things back to normal as soon as possible.

“The newly launched self-custodial authentication system as part of the Shib Magazine is having technical issues for some users. We are working towards fixing this as soon as possible,” the developer said.

SHIBUSD price chart

Shiba Inu Developers Launches The Shib Magazine For Timely Ecosystem Updates

The Shib Magazine aims to furnish the community with updates regarding Shib Inu products and services, including the layer-2 network Shibarium. In addition, the newly launched magazine will also report on the latest interviews with top cryptocurrency industry experts. 

This will ensure the community members remain up-to-date on happenings around the ecosystem and the broader crypto market. Moreover, when fully up and running, the magazine will promote a timely update of trending tokens and upcoming Shibarium features. 

According to reports, the first 1,000 readers will receive an NFT of the magazine cover for free. The SHIB Doggy DAO Foundation sponsors this effort.

More Updates On Shibarium Progressive Strides

Shibarium has proven successful since its launch in late August, covering significant milestones in the subsequent months. On October 18, the layer-2 network exceeded 3.5 million in total transactions, with over 1.2 million blocks in less than two months post-launch. Currently, Shibarium boasts a total of 3.8 million transactions and over 1.5 blocks.

Related Reading: Chainlink Enters Bull Territory, Signals Long-Term Uptrend — Crypto Expert

There was a popular notion that the launch of Shibarium would boost Shiba Inu’s price by facilitating token burns, lowering transaction costs, and increasing speed. However, within the launch period, Shiba Inu recorded a considerable price decline, even when most tokens soared.

But recently, Shiba Inu has posted notable strides, recording over 15% 30-day price increases and a nearly 6% gain in the last seven days. Over the past 24 hours, SHIB price has increased over 2% and trades at $0.0000081.

Dogecoin Poised For A Deep Pullback After Failing To Hold Key Resistance, Analyst

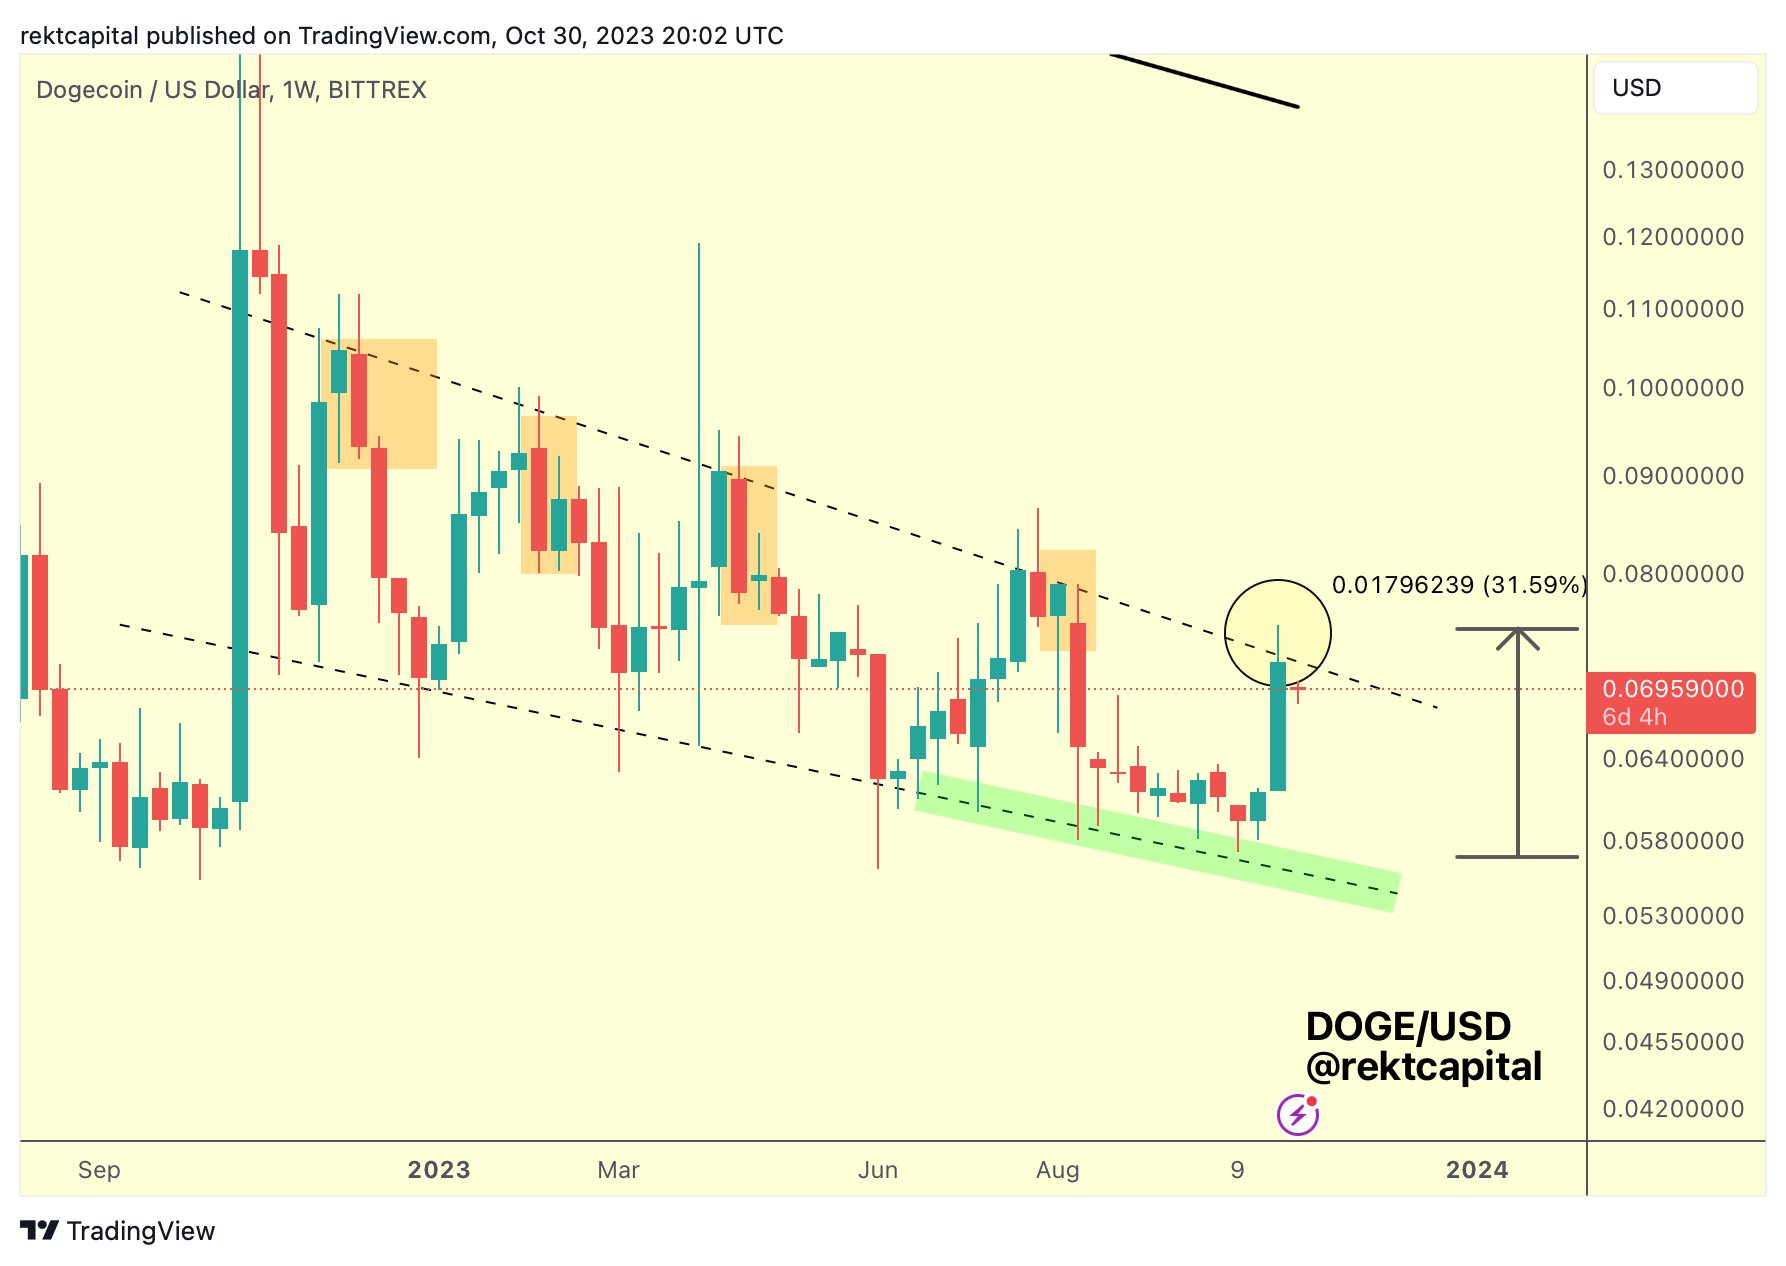
Following a futile fight to break the $0.07 resistance, Dogecoin (DOGE) appears poised for a big drop. This was a warning in an October 31 X post by prominent crypto analyst Rekt Capital to his nearly 400,000 followers.

According to the analyst, despite its notable rally last week, DOGE failed to break its diagonal resistance, which resisted its ascent for several months. As a result of this failure, DogeCoin’s price might decline significantly soon.

Rekt Capital Analysis: DogeCoin’s Complex Weekly Close Below Resistance

From Rekt Capital’s analytic chart, Dogecoin (DOGE) has had a tricky week. It recorded notable upswings but closed below a significant resistance level at the price channel top. The analyst marked the meme coin’s closing price with a circle, as seen on the chart below. 

This setup suggests that DOGE’s anticipated big upswing might encounter delays, the analyst said in the Twitter post. He added that, in the past, when this has happened, DogeCoin’s price declined significantly.

This means that the DOGE breakout is postponed. Previous weekly closes like this -> downside, Rekt Capital remarked.

However, despite the high likelihood of a decline, the analyst believes there’s hope for DOGE. Rekt said, “If DOGE can hold the highs and reclaim the channel top as support – there may still be a chance.”

Based on Rekt’s chart, to confirm a bullish trend, the DOGE $0.07 resistance needs to change to a support level on the weekly timeframe.

Rekt's chart

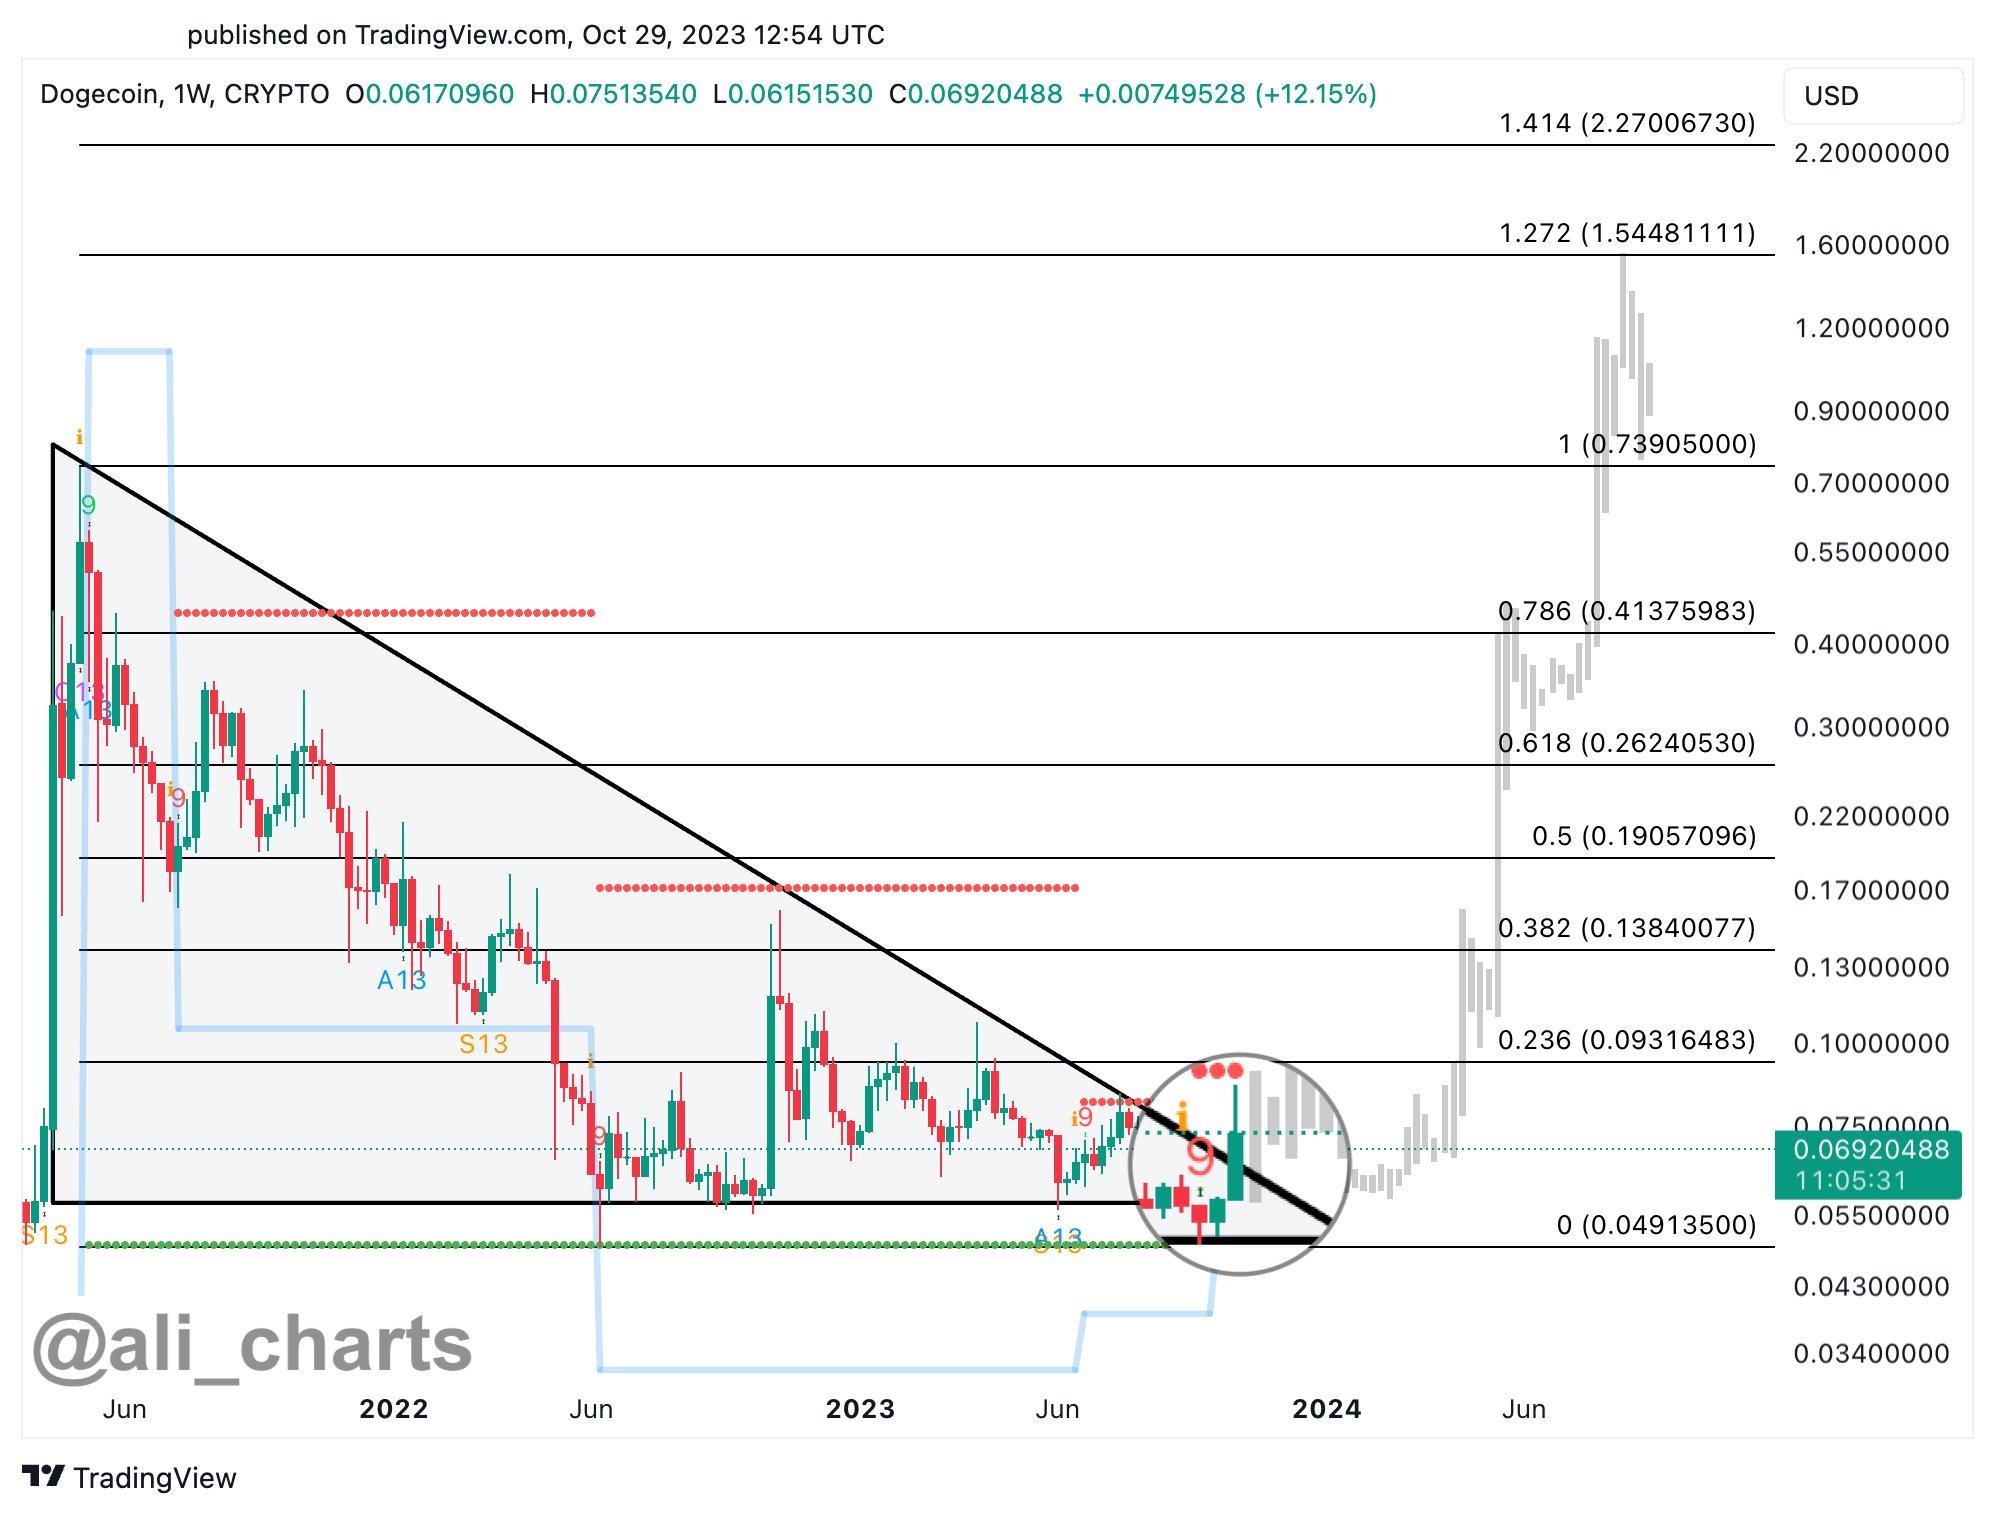
Ali Martinez’s Bullish Analysis: Dogecoin’s Promising Breakout

Recently, another crypto expert, Ali Martinez, made an optimistic prediction about Dogecoin. The analyst shared a chart on the X platform showing that the meme coin has broken out of a long-term pattern. According to Martinez, this happened when the overall cryptocurrency market trend shifted upwards.

@ali_charts

Also, Martinez highlighted that a special TD Sequential indicator gives a BUY signal on DOGE. According to the analyst, this signal strengthens the positive outlook for the cryptocurrency. In context, this indicator helps traders figure out if an asset’s price might change direction.

Meanwhile, Dogecoin has formed two consecutive bullish higher-high candles on the weekly chart. The setup confirms that DOGE indeed broke free from the previous pattern. 

In line with Rekt’s analysis, if the market keeps up this pace, the price could increase significantly. As of the time of writing, DOGE is trading at $0.0665; the coin is down by almost 4% in the past 24 hours. However, over the last seven days, Dogecoin has gained more than 1%, with a 12% 14-day increase.

Solana (SOL) Leads Gains Among Top Coins, Can Bulls Send The Price To $40? 

SOL ranks among the bullish cryptocurrencies today, benefitting from the ongoing rally in the crypto market. $40 looks more realistic since SOL overcame the psychological resistance level of $20. 

Based on its present trajectory and exciting events in the Solana community, investors wonder if it will attain $40 in the coming days. The technical indicators in the chart below will uncover SOL’s price trajectory in the coming days. 

SOL Testing $36.69 Resistance, Will The Bulls Rally To $40?

SOL is in an uptrend on the daily chart, forming a third consecutive green candle as the buyers continue accumulating. Remarkably, SOL flipped the $33.05 resistance level to support on October 30 and is testing the $36.69 support today, October 31. 

The Relative Strength Index (RSI) indicator displays a value of 77.78, already in the overbought region above 70. The RSI shows no signs of a decline, implying that more buyers are opening long positions for SOL. 

Furthermore, the Moving Average Convergence/Divergence (MACD) indicator is above its signal line, displaying a strong buy signal. This signal is confirmed by the green Histogram bars formed on October 30 and today. 

Therefore, SOL will likely rally to the $40 resistance level in the coming days if the buyers push it above the $36.69 resistance level.

However, if rejection occurs at $36.69 and the RSI retraces from the overbought level, buyers must apply a trailing stop loss to curtail massive losses. 

Nevertheless, SOL looks well positioned to return to $40 based on its strong support level at $33.05. Also, some exciting developments in the Solana community are driving more investors to the ecosystem and boosting SOL’s price. 

SOLUSD price chart

Solana’s Launch Of Block Explorer Amidst Other Developments

Solana Developers, on October 30, announced that Cymbal’s Human Readable Block Explorer now supports Solana. It’s worth mentioning that Solana has organized over 466,000 NFT projects, has over 10 million active wallets, and tracked over 36 million tokens in real time. The Cymbal AI helps Solana users keep track of their activities with ease and is a welcome development in the ecosystem. 

Also, there is much excitement in the crypto community for the ongoing Solana Breakpoint 2023 annual conference that began on October 30. This event is in Amsterdam, Netherlands, with notable speakers taking vital topics surrounding blockchain technology.

The first day of the event featured an address from JavaScript co-founder and Brave CEO Brendan Eich. According to Eich, there are massive integrations with Solana support coming to the Brave browser in 2024. This announcement by the CEO is likely driving the adoption of SOL tokens ahead of a potential price surge above $40. 

Additionally, Phantom Mobile announced the creation of an NFT feature not available on their mobile devices but supported by Solana. According to the developers with Camera Mint on Phantom Mobile, users can instantly convert photos and videos into Solana NFTs using the app. 

The diversity of the Solana ecosystem makes it ideal for most investors since its tokens are still quite affordable. Therefore, SOL could rally in the coming days if the buyers continue the ongoing accumulation phase.

DOGE Breaks Free From Multi-year Descending Order, What’s Next?

Dogecoin has also benefited from the general crypto market rally, gaining over 7% in the past week. DOGE has settled at the $0.069 price range today, with its market cap above $9 billion, showing its massive adoption. Also, on the weekly chart, DOGE shows signs of a breakout pattern as more buyers continue to accumulate the tokens.

According to crypto analyst Ali Chart, Dogecoin has broken out of a multi-year descending triangle pattern on the weekly chart. The analyst believes this confirms a buy signal for the asset on the weekly timeframe, making its future outlook bullish. 

DOGE Breaks Out Of Descending Triangle Pattern

DOGE entered a descending triangle pattern from July 2023 as bearish conditions in the market forced a decline. However, the buyers forced a breakout from this pattern in October as the general market moved into an uptrend. 

Remarkably, DOGE flipped the $0.067 resistance level into support, rallying to the $0.071 resistance level. Furthermore, DOGE has formed two consecutive green candles on the weekly chart, confirming its break out of the descending triangle. 

Related Reading: Ethereum Resilient Above $1,800 Pre-FOMC Meeting – Details

Additionally, the Relative Strength Index (RSI) displays a value of 51.8 in the neutral zone and moving sideways. It implies that while the buyers are dominant, some traders are beginning to make a profit, leading to a slight decline. However, if the RSI moves to 55, the buyers will likely resume the accumulation phase. 

Also, the Moving Average Convergence/Divergence (MACD) is above its signal line, displaying a buy signal on the weekly chart. Moreover, the green Histogram bars confirm that the buyers are not yet done with the accumulation of DOGE. If DOGE breaks above the $0.071 resistance level, it will likely continue on its rally in the coming weeks. 

DOGEUSD price chart

Whale Movement Aiding Dogecoin’s Price Gains

According to the crypto tracking platform Whale Alert, a dormant address holding over 5.39 million DOGE tokens valued at $372,461 has been reactivated. Notably, this address remained inactive for almost 10 years, with its last activity in 2013 when DOGE launched in the public market. 

Whale Alert confirmed that this whale transferred 392,000 DOGE to a new blockchain address. Also, a massive 350 million DOGE tokens were transferred to the crypto exchange Robinhood on October 27 from a whale address. 

These transfers are likely aiding Dogecoin’s rally in the past week due to increased on-chain activity. Also, the general price uptick in the crypto market led to a rally for meme coins. 

Furthermore, Dogecoin’s profile as one of the largest cryptocurrencies by market cap is aiding its price rally. Therefore, DOGE’s uptrend may continue in the coming weeks if the general market sentiment remains positive.

Chainlink (LINK) Rides Bullish Waves With 42% Gains In The Week, Is $15 Possible?

LINK recorded impressive gains in the past week, with an over 43% seven-day price increase. However, the token’s price has slightly retraced in the last 24 hours, likely due to buyers taking profit after an aggressive accumulation phase for LINK tokens. 

Chainlink’s notable uptick could be due to the ongoing bullish waves in the broader crypto market. Bitcoin, the flagship cryptocurrency, recorded a significant uptick, surging to nearly $35,000, the highest in over a year. 

Bitcoin’s performance triggered a wave of optimism across the crypto market, causing most coins, including LINK, to soar. Moreover, Chainlink’s CCIP has recorded additional adoption and likely consolidated on LINK’s price gains. 

But how far can the ongoing bullish momentum take LINK? Can it conquer prevailing resistance to reach $15? Let’s find out! 

LINK Shows Signs Of Retracement, Is $15 Possible?

LINK is in an uptrend after breaching the $6.99 support level as buyers re-entered the market and forced a rally to the $11.9 resistance level. 

LINK’s rally began last week when it surged from $7.42 on October 16 to $10.41 on October 23. While the rally has stalled, the latest strides show that buyers are intent on facilitating further rallies to retest the $11.9 resistance

A move above this level would empower LINK to target $15. Moreover, the higher high candlesticks on the chart imply that LINK will likely consolidate on its rally in the coming days. 

Additionally, the Moving Average Convergence/Divergence (MACD) is above its signal line, displaying a strong buy signal. The green Histogram bars confirm this signal, which implies that LINK buyers are still active. 

LINK trades at $11.003, with a 1.62% increase in the last 24 hours. Based on LINK’s trajectory, it will likely break above the $11.9 resistance to reach $15 in the coming weeks if buyers sustain their charge. 

LINKUSD price chart

What Is Driving LINK’s Price Gains?

Besides the general uptrend in the crypto market, Chainlink has recorded notable developments within its ecosystem, likely sustaining its price gains.  

One such is the integration of Chainlink’s CCIP by DeFi provider Affine. The Chainlink CCIP is the new industry standard for secure cross-chain linking on Ethereum and Polygon mainnets. 

Affine hopes to leverage the CCIP’s messaging abilities to create a cross-chain NFT bridging function for Affine Pass NFTs. It will ensure seamless and secure NFT transfers between supported blockchains. 

According to Affine developers, they selected Chainlink to host the Affine NFTs due to its proven security and reliability track record. 

More so, some experts forecast that there will be up to $5 trillion in tokenized digital securities by 2030. Chainlink will likely benefit from this expansion since it is a significant player in tokenized assets technology.

With benefits such as fast transaction settlements, operational cost savings, and enhanced transparency, tokenization will likely boost Chainlink’s overall value. 

These developments are likely sustaining the price gains for the LINK token in the past week. Although LINK trades slightly above $11 today, it will likely rise to $15 if market conditions remain favorable.

Bitcoin Price Could Flip Bullish In November As It Mirrors Previous Cycles, Analyst

Bitcoin analysts eagerly scrutinize the charts as November approaches, hoping to gain insights from past cycles. Historically, November has always been significant for the cryptocurrency market, as BTC usually gains value, affecting other coins. 

According to crypto analyst Miles Deutscher, November promises to be a pivotal month for Bitcoin enthusiasts and investors.

Bitcoin’s Ongoing Sideways Trend Hints At Potential Bullish Shift In November

Market experts suggest that Bitcoin’s stagnant price movement might transition to a bullish trend in November. According to them, this could occur if it behaves similarly to past cycles before a halving event. 

For instance, on October 10, cryptocurrency analyst Miles Deutscher referenced a chart from CryptoCon. In the X post, Miles highlighted the parallels between Bitcoin’s recent patterns and those observed in earlier cycles.

He added that around November 21, the price of Bitcoin usually starts going up a lot, getting ready for the next halving event. This date holds significance as a turning point in Bitcoin’s price trajectory.

For instance, in 2015, when Bitcoin’s price was ranging for about six months, it began to go up in November. Similarly, in 2019, the price of Bitcoin didn’t change much for most of the year, but then it started to increase towards the end of the year.

BTCUSD price chart

Other Crypto Analyst Predicts Similar Price Projections

Another prominent crypto trader and analyst, Mags, noticed something interesting in Bitcoin’s chart. According to the analyst, Bitcoin’s price is about 60% lower than the highest price it ever reached. This happened around 200 days before its previous halving, just like in 2015 and 2019.

The analyst wrote:

In 2016, BTC was -65% below its ATH. In 2019, BTC was -60% below its ATH. In 2023, BTC is currently -60% below its ATH. So, even if it seems like Bitcoin’s price isn’t moving much, it’s following a similar pattern to previous cycles.

Another crypto analyst, Galaxy Trading, posited a similar prediction for Bitcoin’s price move. The analyst drew attention to 2018-2019 when Bitcoin’s price hit a significant bottom. He noted that Bitcoin could dump or bottom around Nov 10-15 this year if we see a similar price move.

Additionally, lead researcher at Matrixport, Markus Thielen, said that Bitcoin’s price might go up massively by the end of 2024. However, he thinks it will happen for different reasons than what we’re seeing now.

He drew attention to some critical areas in August 2012, December 2015, May 2019, and August 2020. According to him, the bullish market commenced within 12 to 18 months in each case.

However, the Bitcoin halving is around six months away and might occur in late April or May, depending on your countdown timer.

The analysis from different observers is signaling a positive outlook for the price of Bitcoin before the next BTC halving. Meanwhile, today, October 10, BTC trades at $27,568, indicating a slight gain in 24 hours with a volume of $12,189,678,605.

TWT Token Registers 20% Gains As Crypto Market Slumps, What’s Next?

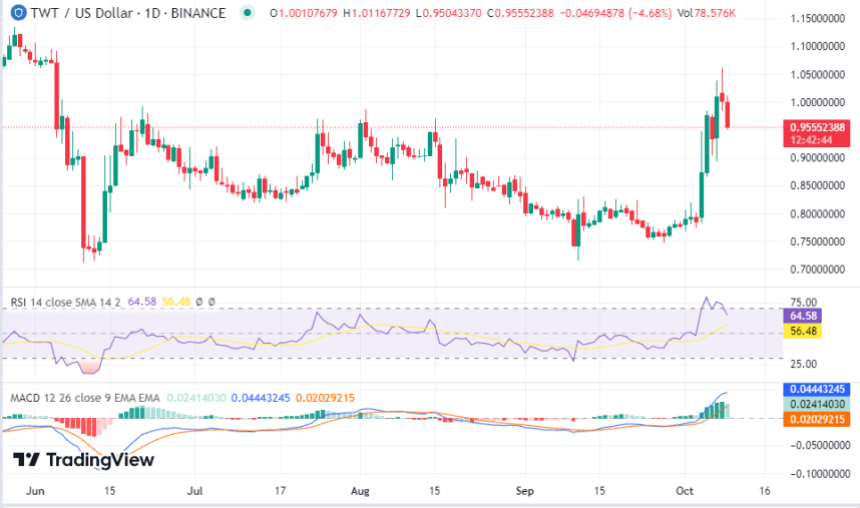
Trust Wallet Token (TWT) seems untouched by the crypto market decline, holding a nearly 20% seven-day gain while top coins recede. After finding support at $0.79, it rallied above the $0.94 resistance, flipping it to a new support level today. 

The Trust Wallet Extension update on Chrome might be driving its price gains in the past week. Due to the update, users can now enjoy the full features of Trust Wallet integrated with their Chrome browser. Such ease of access may have boosted the use of TWT, thereby pushing its demand and price. 

Recent Network-Related Developments Can Push TWT’s Price Further

The new Trust Wallet Extension update (V 1.9.1) on Chrome Store was announced on October 3. According to the announcement, users can enjoy native EVM swaps, Ledger and hardware support, and crypto purchases. 

Users can now access 15 different staking options across nine blockchains with the extension. This additional utility is likely driving more investors to the Trust Wallet ecosystem.  

Also, on October 5, Trust Wallet launched a Trust Wallet Testimonial Contest to reward its loyal community. According to a blog post, participants will share their testimonials and experiences using Trust Wallet. 

Trust Wallet will reward five lucky winners with mystery swag boxes once they complete certain tasks. This contest will likely boost investors’ interest in the ecosystem and lead to price gains for TWT tokens. 

TWT Declining On Daily Chart Despite Weekly Gains

Despite impressive weekly gains, TWT shows signs of price decline on the daily chart. Its decline could correlate to the retracement in BTC’s price from $28,000 to $27,770 today, October 9, at 5:36 am EST. After its rally from the $0.79 support level, TWT broke above the $0.94 resistance level. 

TWT daily chart

Looking at the daily chart, TWT has formed two consecutive red candles on the daily chart, confirming increased selling pressure. Also, today’s candle drops below the trendline, hinting at a slight retracement ahead for the token. 

TWT is retracing in the Donchian Channel (DC) and approaching the Median Band. A drop below this band will confirm that the sellers have reclaimed dominance on its price. 

Furthermore, the Relative Strength Index (RSI) indicator displays a value of 64.5 in the buy zone close to 70. A close look at this indicator and its downward motion reveals that it is retracing from the overbought zone. The RSI’s movement confirms the sentiment that the buyers are beginning to take profit and close long positions. 

Nevertheless, the price retracement for TWT will likely be brief due to its ecosystem developments. The daily chart analysis shows that TWT will likely decline to $0.94 in the next few days before resuming its rally. 

Also, the next rally may likely send TWT above the $1 resistance zone for more impressive gains. However, buyers must avoid bull traps if the $0.94 support level fails to hold. 

2024 Crypto Cliffhanger: VC Firm Co-Founder Warns of Bitcoin, Ethereum Collapse

In a recent post, investor Chris Burniske expressed the belief that a bottom is looming for the top cryptocurrencies. Burniske predicts that Bitcoin and Ethereum could dip as low as $20,000 and $1,000, respectively, with top altcoins, except Solana (SOL), hitting new lows.

Notably, BTC retraced from $28,000 to slightly above $27,600, with ETH seeing a similar decline in the past few days. 

Crypto Analysts Predicts Market Bottom Ahead Of Bull Run

According to the founder of Placeholder Capital, Chris Burniske, a bull market will likely begin soon. However, the analyst believes the upcoming bull run will be preceded by a bottom cycle in the present financial quarter (Q4 2023). Furthermore, Burniske believes that this bottom will lead to declining crypto prices. 

According to his analysis, fear is high but only temporarily, as sellers are exhausted. Burniske believes the predicted lows for the top cryptocurrencies will present attractive buying opportunities in preparation for the upcoming bull market.

The crypto analyst supported his predictions with Linear charts, stating that it is easy to spot tops and bottoms with such charts. For context, Linear charts show the change in the price of an asset. Burniske believes it is up to traders to choose their accumulation style with patience and persistence. 

What Lies Ahead For Bitcoin And Ethereum?

Bitcoin trades at $27,697, with a 0.56% price increase in the last 24 hours. Ethereum’s, on the other hand, is $1,639, with a 0.45% 24-hour decline.

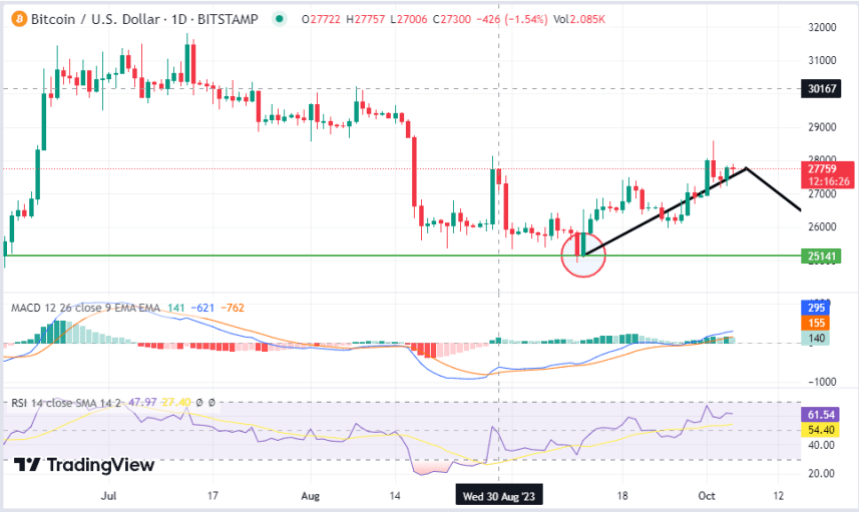
Meanwhile, BTC has encountered stiff resistance at $28,000, leading to a decline to $27,000 in the last few days. The asset formed a bottom on the daily chart on September 11 before the buyers forced a price recovery. 

Although BTC recovered slightly, the sellers have continued to re-enforce the $28,000 resistance. If the selling pressure increases, a decline to the $25,141 support level is possible in the coming days. 

Bitcoin chart

Moreover, the green MACD Histogram bars have faded, confirming a drop in buying pressure as sellers reclaim dominion. Also, the RSI is dropping from the buy zone and displays a value of 61.54. 

If the RSI drops below 50, BTC may resume the downtrend in the coming days. If Bitcoin drops further, a bottom cycle will likely begin in the crypto market. 

The potential decline to the $25,142 support level could facilitate a bull cycle. The reason is that it presents an attractive entry level for the accumulation phase. 

Ethereum To Follow Similar Trend As Bitcoin

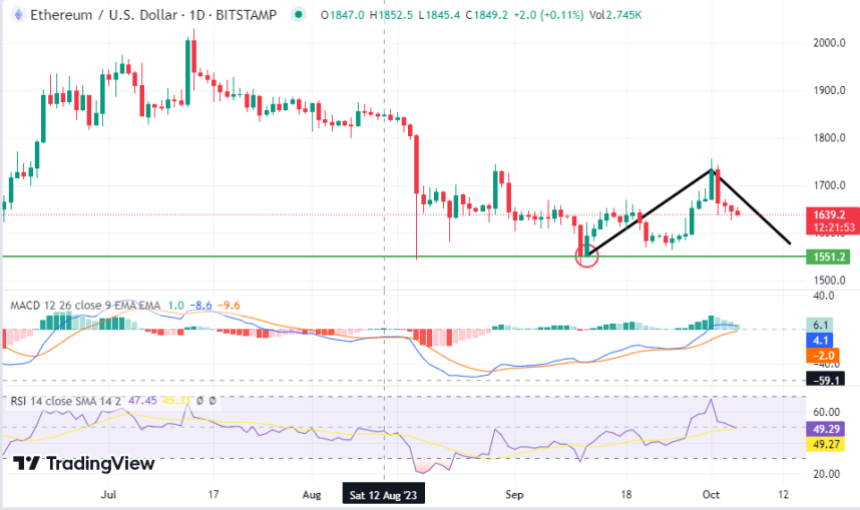
Also, ETH displays a similar price trend to Bitcoin, with a prominent dip likely to occur in the coming weeks. ETH is in a downtrend on the daily chart, forming lower lows as sellers continue to dominate the market. 

Ethereum chart

Based on its historical data, it formed a bottom on September 11, after a similar decline before rallying on September 12. Therefore, ETH will likely return to the $1551 support level to form a double-bottom pattern before another rally. 

Also, its Moving Average Convergence/Divergence (MACD) shows a weak buy signal with fading bullish histogram bars. Additionally, the Relative Strength Index (RSI) indicator displays a value of 49 and will likely drop to the oversold region. 

Based on ETH’s past price action, traders should expect further decline in the coming weeks before a recovery.

Chainlink Creator Expects Mass Crypto Adoption To Send Market Cap To $10 Trillion

In a recent interview, Chainlink’s co-founder, Sergey Nazarov, said the collapse of the banking industry will drive crypto mass adoption.

Chainlink’s Co-Founder Predicts Crypto And Blockchain Prospects Over The Next Decade

Sergey Nazarov believes that the collapse of the banking industry will favor crypto adoption and growth in the next decade.

Nazarov believes the crypto industry and its technological innovations might maintain the same slow growth pace. However, the industry player cited two possible crypto and blockchain adoption scenarios in the next ten years.

First, the Chainlink co-founder proposed a fast-case scenario where the collapse of the traditional finance system puts individuals in pain. This pain will force individuals to “acknowledge the relevance” of cryptographic financial systems. 

Further, Nazarov noted that the continued collapse of banks like Silicon Valley Bank could fast-track crypto adoption. 

Secondly, based on the first theory, the collapse of traditional finance systems will lead to political tension and international problems. Nazarov believes investors will favor crypto for financial operations if the pain of suffering losses becomes unbearable. 

Therefore, Nazarov insists that even in the slow case, the crypto market is likely on its way to a $10 trillion market cap. 

LINKUSD price chart

Chainlink’s Adoption By ANZ Banking Group Supports Nazarov’s Growth Theory

According to a new industry report, ANZ Bank has adopted Chainlink’s CCIP for cross-chain tokenized asset settlement. CCIP solution helps to transfer data and tokenized assets across blockchains in a decentralized and secure way, according to the crypto founder. 

Notably, ANZ Bank is one of the world’s largest banks, with over $1 trillion in total assets managed. Sergey Nazarov noted that Chainlink’s adoption by ANZ shows how large companies are now adopting Chainlink’s CCIP. 

Also, the co-founder stated that building on a global internet needs secure connectivity between private bank chains and public chains. 

The CCIP is an upgrade on the Chainlink Network that functions as a global Internet of Contracts. This upgrade aims to create the world’s largest liquidity layer across various regions and markets. 

Remarkably, Nazarov stated that CCIP can create a higher level of cross-chain security. It achieves this extra security with multiple layers of decentralization and advanced risk management techniques. 

Moreover, most cryptocurrencies offer users fast and secure cross-border transactions cheaply. However, some critics still insist that cryptocurrencies are unreliable based on their volatility and crisis in the sector. 

With innovations like the CCIP of Chainlink, more banks may integrate crypto and blockchain-based solutions. This drives crypto to mainstream adoption, increasing the market cap to $10 trillion, as Nazarov predicts.

Meanwhile, the collapse of banks such as Silicon Valley Bank (SVB) in 2023 has strained the global finance economy. If another banking crisis occurs, cryptocurrencies might become the preferred option for most investors based on their rising utility.

Bitcoin SV (BSV) Notches 8% In The Last Day as Top Coins Bleed

BSV has bucked a bearish trend amid the general crypto market downturn, posting notable gains over the past 24 hours. Bitcoin SV (BSV) recorded an 8% 24-hour price increase, while Bitcoin succumbed to bearish pressure, dipping nearly 3% today, October 3.

As a result of today’s uptick, BSV now trades at $40.4, representing an 8% increase in the last 24 hours. Also, the token has recorded over 31% seven-day increase, regaining over 34% of its past month’s gains. 

These prominent strides confirm buyers’ dominance in the BSV market today. However, given the bearish state of the general crypto market, how long can BSV sustain this rally? What factors triggered this dramatic surge? Let’s find out.

Bitcoin SV Price Surges Amidst Controversy Surrounding CEO’s Resignation

BSV price gains correlate with the sudden resignation of nChain’s CEO, Christen Ager-Hanssen, on September 29. nChain is a firm that offers blockchain-based services related to the BSV chain. Its former CEO, Ager-Hanssen, immediately announced his departure from the group on September 29. 

Ager-Hassen mentioned reporting several issues to the nChain board, which included a conspiracy to defraud shareholders. He also stated that a significant shareholder orchestrated the conspiracy. 

Further, he claimed to discover evidence that BSV creator Dr. Craig Wright manipulated documents to deceive the court that he was Satoshi. 

However, Bitcoin SV’s supporter Calvin Ayre reviewed Anger-Hanssen’s departure. According to Ayre, Anger-Hanssen has never run a successful company and lies to steal assets

Notably, Bitcoin SV sparked to life after nChain released a statement that Stefan Matthews would take over as acting CEO.

BSVUSD

Recent Tweet By Supposed Bitcoin Founder Boosts Investor Sentiment On BSV

Another event that occurred around BSV was an October 2, 2023, tweet from an account claiming to be Bitcoin’s founder, Satoshi Nakamoto. Interestingly, the last tweet from this account was on October 31, 2018. 

According to a recent tweet, Nakamoto stated that Bitcoin is a predicated machine. He revealed his desire to explore other aspects of the project not contained in the whitepaper. 

The tweet attracted positive reactions, with one user stating that the first post since 2018 has to mean something. Since Bitcoin BSV supposedly aligns with the original Bitcoin vision, it benefited from this sentiment. The reactions likely increased investor confidence, leading to massive token demand and today’s 8% uptick. 

Although the real identity of Satoshi Nakamoto and his involvement in this saga remains a mystery, these controversies positively affected BSV’s price.

What Next For BSV?

BSV has flipped the $32.6 resistance into support to form a large green candle on October 2. It faces the next resistance at the $40.4 price level. A break above this level will likely send BSV up to $42. 

Since the Relative Strength Index (RSI) indicator is in the overbought zone at 81.9, it confirms the strong buying pressure pushing BSV up. Nevertheless, traders should expect a slight retracement in the coming days once the buyers begin to make a profit.

Optimism (OP) Climbs 6% A Day As Crypto Market Rebounds, What’s Next?

Optimism (OP) has posted notable gains today, October 2, trading at $1.45, with a 5% increase in the last 24 hours. Furthermore, its price has gained 15% in the last seven days. 

OP’s rise coincides with the improvement in the general crypto market, which showed a remarkable recovery. However, whether OP will sustain the ongoing rally remains to be seen. But a close look at a few technical indicators may provide vital insights into its next price moves. 

OP Approaches Overbought Zone As Buyers Sustain Rally

OP continues to show positive price momentum as buyers dominate the market. Also, it has formed a fifth consecutive candle on the daily chart, confirming active accumulation by traders. Its rally became prominent on September 29, when it broke above the Donchian Channel (DC) median band.

OP flipped the $1.41 resistance level to support today and edges closer to the upper band of the Donchian Channel towards the $2.50 resistance level. If the buyers sustain the rally above the $1.50 resistance, OP will likely move into the overbought zone. 

Additionally, the Moving Average Convergence/Divergence (MACD) has risen above its signal line, displaying a strong buy signal. Also, the Histogram bars are green, confirming that the buyers are still active. More so, the Relative Strength Index (RSI) indicator displays a value of 64.2 and is rising to the overbought region of 70. 

Based on these indicators, OP will likely enter the overbought zone in the coming days, implying that accumulation will continue. However, traders should look out for bearish resistance at the $1.50 level that could serve as a potential entry point for sellers. 

OPUSD price chart

What Could Be Behind OP’s Recent Gains?

Besides the general recovery in the crypto market, Optimism records exciting developments in its ecosystem. One notable change is a September 29, 2023, proposal to change Optimism’s security model. 

According to the proposal, the OP team aims to hand over the admin key for the OP Mainnet to public and decentralized participants. These participants will be the Security Council held accountable for Optimism’s Governance. 

Although this proposal awaits approval, it creates engagement in the OP ecosystem, thus increasing investor interest and activity. And this increased activity exerts higher buy pressure on the token. 

Furthermore, the Optimism Superchain is another innovation driving ecosystem growth. According to blockchain data provider Covalent, the Superchain is an interlinked blockchain network of individual chains tagged “OP chains.” 

Interestingly, builders can use the Superchain to engage in on-chain development. However, they must comply with the Law of Chains, a set of community rules on how teams support public goods and decentralization. 

The OP Mainnet is the first member of the Superchain. Again, it has recorded increased daily active addresses, higher than Arbitrum, which is declining in on-chain activity. 

BuildOnBase, created by Coinbase, is the second member of the Superchain, aiming to attract billions of users. BuildOnBase ranked as one of the best-performing chains in 2023 and the fastest L2 to reach 100,000 users in 56 days. 

These developments are likely driving the growth in the Optimism ecosystem, evident in its recent price surge. 

Chainlink (LINK) Brushes Off Market Downtrend, Scores 11% In Last Week

Chainlink has remained bullish despite the bearish pressure in the broader crypto market. The crypto closed bullish at $7.4 yesterday, September 26, with over 7% increase. 

LINK remains bullish, with an 11% seven-day price increase and over 2% gain in the last 24 hours. But while the token’s price continues to increase, data shows the trading volume has declined 17% in the last 24 hours. What could be the reason behind this contradiction?

Chainlink Price Continues To Surge

In an X post on September 24, Chainlink network announced it had recorded multiple integrations across six blockchains. These include Arbitrum, Ethereum, Optimism, Avalanche, Polygon, and BNB Chain.

Also, yesterday, September 26, gaming platform BetSwirl announced that it integrated Chainlink’s CCIP across Ethereum, Polygon, Avalanche, and Arbitrum. According to the post, this CCIP integration will help “BetSwirl enable seamless, secure, and reliable cross-chain token transfers”

Related Reading: XRP Price Analysis: 4-Month Chart Dynamics Decoded By Crypto Analyst

This increased adoption across multiple chains expanded Chainlink’s user base, a plausible factor behind LINK’s resilience amid the prevailing bearish market.

Although LINK briefly slipped off the $7.5 level to $7.3 yesterday, it has since recovered momentum. Given the ongoing movement, the crypto asset could break the $7.8 resistance and record higher highs soon.

Meanwhile, Chainlink (LINK) is number 3 among the top weekly gainers after CRV and PEPE. It has also secured a position on the top daily gainers’ chart.

Although the price strides are bullish, the trading volume, down 17%, raises concern about whether LINK can sustain the rally. It indicates reduced trading activity, a possible sign that buyers have reached saturation and paused to weigh their next move. 

This setup bodes badly for LINK as it could signal the entrance of sellers, which will exert downward pressure on the token’s price.

LINKUSD price chart

Price Surge Drops Chainlink (LINK) Supply On Crypto Exchanges

According to Santiment’s report on September 24, Chainlink remains one of the best-performing cryptocurrencies in September. It outlined that, unlike most assets, LINK’s price often records an initial boost when holders move their tokens from exchanges.

Santiment noted that the asset’s price increased 23% in two weeks as the exchange supply flowed back to cold wallets. Also, the analytics platform reported that LINK exchange supply increased by 17.2%, reaching a 2023 high on September 14.

However, on September 24, 10 days later, the token’s exchange supply dropped to 16.4%. This observation is a plausible reason behind Chainlink’s declining trading volume. 

Meanwhile, as of the time of writing, LINK trades at $7.64, with a 2.88% price increase in the last 24 hours. The token trades above the simple moving averages of $6.494 and $6.719 and two key support levels. 

LINK is approaching the overbought area, forming a bullish candlestick as buyers vie to conquer the $7.823 resistance.

Maker (MKR) Price Continues to Climb Higher Level, Will It Surpass $1500?

Maker DAO’s MKR has recorded a big push amid the slight uptick in the broader cryptocurrency market. Yesterday, September 25, the token rose from a low of $1,265 to a high of $1,343. 

Although most tokens struggle to recover, MKR consolidated on its upswing with an impressive 5% 24-hour increase. MKR trades at $1335, striding to conquer the critical resistance at $1,350. 

Its latest strides show buyers are in control, and their activity could facilitate more gains for MKR. But is the bullish momentum strong enough to push MKR to the $1,500 price mark? Let’s find out.

Related Reading: Market Analysts Outline When The First Spot Bitcoin ETF Will Be Approved

MKR Stands Among Top-gaining Cryptocurrencies

MKR ranked number one among today’s top-gaining cryptocurrencies, gapping Chainlink and Bitcoin Cash by 2%. This comes while the overall crypto market cap recorded a slight uptick of 0.63%, with the trading volume down 4%, indicating a decline in trading activity. However, amid the sparse buying activities in the general market, MKR recorded a 47% increase in trading volume. 

This observation depicts increased buy action in the Maker market. But while this increased buying strength could fuel the coin’s price rally, it’s important to identify the factors behind it. 

The buzz around the new proposal to deploy Spark Protocol on zkSync Era Mainnet has boosted investor sentiment. This proposal will include wETH, rETH, wstETH, and DAI as initial collaterals for borrowing on the Spark Protocol. Also, if adopted, the proposal will set a 2 million liquidity goal to spur Spark Protocol’s growth on zkSync.

Already, 100% of the Maker community voted yes to launching Spark on Gnosis Chain. This development makes DAI, Maker DAO’s stablecoin, the native gas token of Gnosis Chain. In addition, it allows users to earn increased yield when lending their DAI tokens. 

Given this benefit, this development yielded positive sentiment in the Maker ecosystem. This positive sentiment must have translated into increased demand for MKR, the governance token of the Maker protocol, a plausible reason behind the surge in trading activities. 

MKRUSD price chart

MKR Strives To Conquer The Key Resistance Level: Is $1,500 Possible?

The daily chart shows that MKR has formed two consecutive bullish candlesticks around the $1,300 price. This set-up depicts high token demand and increased buying strength around this zone. 

The increased buy actions have pushed MKR above a key support level of $1,086 and a critical moving average of $1,166. But, the bulls met strong opposition at the $1,354. The sell activities from profit-taking traders, evident in forming two bearish candlesticks at this level, hinder further strides. Furthermore, MKR has remained a few pipes below $1,354 since opening today’s trading session at $1,338. 

However, the Relative Strength Index, which increased from 63 to 64.97, approaching the overbought area, signals rising buying strength. It suggests that more buyers are entering longer positions, ready to counter the selling pressure resisting rally. 

Suppose buyers maintain the ongoing momentum; a breakout above $1,354 and a move towards $1,500 before the day ends is possible.

Chainlink (LINK) Spikes 6% On The Weekly Chart As Market Sees Correction

The crypto market cap has declined over 1% in the last 24 hours, transmitting losses across the market. Top coins like Bitcoin and Ethereum have taken the hit, losing 3% and 4% of their past week’s gains, respectively. 

However, Chainlink (LINK) resisted the prevailing bearish market forces amid this onslaught, holding 6.51% gains on the weekly chart. Also, the token has recorded a 1.68% price increase in the last 24 hours. 

Amid the upturn, LINK has broken past the $7 price mark; could it ride the prevailing bullish waves to record new highs? Let’s find out.  

ChainLink’s Daily Active Addresses Hits A 2-Month High 

LINK’s price uptick comes amid a significant increase in active unique addresses on the network. Data from leading on-chain analytics firm Santiment shows that Chainlink’s unique addresses exceeded 3,900 for the first time since July 21. 

Furthermore, this uptick indicates increased network activity and engagement, reflecting the rising community interest and involvement. Moreover, increasing unique active addresses is often synonymous with increased usage and adoption of the network’s native token, LINK. And this could be seen in the increase in LINK’s market value over the past seven days. 

In addition, an update on Chainlink adoption shows four of the network’s services integrated across six different chains. These chains include Arbitrum, Avax, BNB Chain, Etherem, Optimism, and Polygon. 

Again, these integrations further reflect a wider usage of the LINK token and increased participation in the Chainlink ecosystem. It shows that more people are adopting Chainlink, exerting a higher buying pressure on LINK, a plausible explanation for the ongoing price uptick.

LINKUSD price chart

Chainlink (LINK) Breaks The $7 Resistance; What’s Next?

The daily LINKUSD chart below suggests that LINK is gearing up to hit $8 as it conquers critical barriers while buy pressure remains high.

After posting notable gains over the past eight days, LINK trades above two key support levels, $5.72 and $6.595. The token’s price oscillated between these key price levels from mid-August to September 18. 

Meanwhile, all this time, LINK traded below two critical points, the 200-day and 50-day moving averages ($6.488 and $6.706), before a sharp spike pushed it above $6.8. It maintained the momentum through the past few days, breaking the $7.00 barrier, and now targets the $7.8 resistance level.

LINK now trades above the 50 and 200-day price levels, indicating a strong bullish momentum in the market. If the ongoing buy frenzy continues, LINK could reclaim the year-high of $8.898, recorded on November 7, 2022. And if the buying strength continues to increase, the token could even set a new record high in the coming days.

However, while LINK has regained over 21% of its past month’s gains in the ongoing rally, the token remains 9% down from its year-high, and he bulls must increase momentum for the token to reclaim this level.

Featured image from Pixabay and chart from TradingView.com

Optimism To Sell 116 Million OP Tokens Via Private Sale: Will The Price React?

Optimism has revealed its plans to sell 116 million OP tokens to seven private buyers. According to the update, this sale is for treasury management tokens. 

Based on current prices, this sale will transfer approximately $159 million worth of OP tokens to the buyers. Given the sheer amount of the sale, some traders believe it will likely cause a decline in OP’s price.

Optimism Announces Sale OF 116 Million OP Tokens Following Third Airdrop Event 

In detail, Optimism posted a community update on September 20 on selling approximately 116 million OP tokens. The tokens are from the unallocated portion of the OP Token treasury, and these tokens are part of the Foundation’s original working budget of 30% of the initial OP supply.

According to the update, the tokens are subject to a two-year lockup. During the lockup period, the purchasers can delegate the tokens to third parties for on-chain governance.

Also, the announcement stated that from September 20, several transactions will take place with the released tokens. It noted that the transactions are pre-planned. 

It bears mentioning that this token sale comes a few days after Optimism announced its third OP airdrop to reward community members for participation in on-chain governance. Optimism released over 19 million OP tokens to over 31,000 unique addresses. 

Meanwhile, the OP community received the announcement with mixed reactions, with one user expressing disappointment. He expressed concerns that the token sale will increase Optimism’s circulating supply, impacting the price.

Optimism’s Private Token Sale: Will It Affect OP’s Price?

Some observers have expressed concern that the sale will affect OP’s price negatively, as the buyers may dump their tokens. However, there are a few reasons why this is unlikely to happen.

Firstly, the sale is private, meaning the buyers are not required to disclose their identities or intentions for the tokens. Therefore, it makes it difficult for traders to anticipate the buyers’ actions.

Secondly, the tokens are from the OP treasury’s unallocated portion and are not part of the circulating supply. It means that the sale will have a minimal impact on the availability of OP on the open market.

Furthermore, the tokens are subject to a two-year lockup period. The lockup prevents buyers from selling them on secondary markets until at least 2025, reducing the likelihood of a sell-off that could depress price.

Overall, Optimism can fund its development by raising capital from investors without relying on the public. Such action could lead to increased demand for OP from bullish investors on the project’s long-term prospects.

OPUSD price chart

Historical Data Suggests Private Sales Could Boost OP Price

Other projects have held similar private sales in the past. Recall that Polygon raised $450 million last year in a private token sale led by Sequoia Capital India. Also, in 2021, Arbitrum raised $120 million in a private token sale led by Lightspeed Venture Partners.

In both of these cases, the private token sales positively impacted the price of the respective tokens. The Polygon MATIC’s price increased by over 50% in the two weeks following the announcement of the private sale. 

Similarly, the price of AAVE increased by 20% in the two weeks following Arbitrum’s private sale announcement.

Therefore, based on this historical precedent, the private sale could benefit OP in the long run. However, note that the cryptocurrency market is volatile, and OP’s price is not guaranteed to increase.

Toncoin (TON) Continues To Shine, Is $3 Mark Possible?

TON has gained 1% today, September 20. It trades at $2.47 with a 30% seven-day price increase. Also, TON’s price gains confirm the entrance of buyers and an accumulation phase, which will likely continue to push the rally.

TON’s price gains in the past week are likely a result of its integration with Telegram. This integration exposes TON to approximately 800 million users on Telegram, leading to a spike in its price. 

TON Faces Resistance At $2.58; Will The Buyers Trigger A Breakout?

TON is on an uptrend today, building on its gains from September 19 to rally to the $2.58 resistance level. After briefly slipping off the $2.5 price on September 16, TON found support at $2.3, preventing a decline. And as the bull returned, the asset pushed closer to the $2.58 resistance level.

As buyers vie to surmount barriers to further uptick, TON trades near the upper band of the Donchian Channel (DC), expressing a strong bullish sentiment.

Additionally, the Relative Strength Index (RSI) is firmly in the overbought zone, displaying a value of 76.6. The RSI’s value implies that the buyers are not yet done with the accumulation phase and will likely rally above the closest resistance level. 

Moreover, the Moving Average Convergence Divergence (MACD) still displays a strong buy signal. The MACD is above its signal line, and its green Histogram bars confirm an ongoing massive accumulation. 

Based on past price action, TON will likely repeat its September 12-16 uptrend to record more gains. However, it is already in the overbought region, and a retracement for consolidation will likely occur in a few days. 

Nevertheless, the exciting developments in the Toncoin ecosystem will likely result in a bull run in the last quarter of 2023. 

TONUSD price chart

TON Records Massive Price Surge Following Telegram Update

Exciting ecosystem developments could be responsible for Toncoin’s performance over the past few days. According to a recent tweet, social media giant Telegram extended its support to Toncoin and introduced a new wallet called TON Space. 

According to sources, the unveiling happened last week at the Token 2049 conference in Singapore. Also, the CEO of Telegram, Pavel Durov, shared this exciting news on his official Telegram account, confirming that TON is the preferred blockchain network for their crypto integration. 

Durov said: “Starting this November, TON Wallet will be included in the settings and attachment menus for all our users outside the US and some other countries.” This integration helps them expand Telegram’s Web3 infrastructure.

Interestingly, users who installed the latest version of Telegram can access the wallet option from the app menu. Toncoin developers say the upgrade aims to integrate the token within Telegram Mini-Apps.

In addition, Toncoin projects could utilize these mini-apps to increase their reach and adoption. Moreover, TON-based users get priority access to Telegram Ads,  exposing the projects to over 37,000 communities and millions of Telegram users. 

Consequently, the TON wallet will operate The Open Network (TON) blockchain. Also, the wallet will be available to over 800 million Telegram worldwide users.

This development bodes well for Toncoin, which has been bullish since September 4, 2023, following the announcement. By riding on these bullish waves, the cryptocurrency will likely attain $3 in the coming weeks.

XEC Token Spikes Over 17% In The Last Week, Can It Sustain Rally?

XEC has continued its uptrend today, September 19, following a sharp spike from $0.000022 to a high of $0.000028 on September 18. This price move represents a nearly 23% increase.

Although there’s been a slight pullback, its price remains around $0.000027. In the early hours of today, XEC traded at $0.000027, with a 15% 24-hour price increase. 

But as of the time of writing, XEC traded at $0.000026, with a 4% decline in the last 24 hours. Nonetheless, its trading volume remains up by 311% in the last 24 hours, depicting increased network activity. 

Interestingly, the ongoing uptrend has persisted over the past seven days with an over 17% increase in its price. The bullish momentum has allowed XEC to retain most of its past month’s gain, with an 8% 30-day price increase. But what’s driving it, and how long can it last?

What Is Driving XEC’s Rally And How Long Will The Rally Last?

The eCash ecosystem has witnessed exciting developments that sparked massive investor interest in the past few weeks. These developments might be the driving force behind XEC’s impressive performance. 

One such innovation is the eCash Mainnet integration with RocketX, a crypto-swapping platform. This integration helps users easily swap several cryptocurrencies, including BTC, ETH, and Cosmos, with the XEC token, thus increasing network activity. 

Furthermore, on September 13, eCash developers announced that PayButton, an online vendor payment portal, now supports XEC. The upgraded PayButton, initially launched in February 2019, will make it easier for online vendors to monitor their payments. 

According to the developers, the goal is to increase eCash usage online. Also, they aim to achieve increased adoption by making eCash user-friendly. 

The upgrade has likely spiked the interest of investors, given the rise in the global relevance of e-commerce. According to Santiment data, eCash witnessed a 270% uptick in social volume in the last three days. Also, network development has increased by 120% over the past seven days.

While these developments boosted XEC’s price these past few days, the ongoing rally’s longevity remains uncertain, given the market’s unpredictable nature. However, the following analysis could provide hints.

XECUSD price chart

Buyers Show Dominance On The Daily Chart: Will Their Charge Sustain XEC’s Rally?

A close examination of the daily chart suggests the bulls are determined to facilitate more gains for XEC. Their strong market dominance is evident in the formation of the large green candle on the daily chart.

While the token’s price remains below the 200-day Simple Moving Average, the upper wick of today’s candle has a charge above this price level ($0.0000277). This suggests that the bulls intend to sustain the rally for longer.

Nonetheless, XEC is bullish on the short term as the buyers have sustained its price above the 50-day SMA. This observation also confirms an ongoing accumulation of the tokens, leading to the prevailing price surge. 

Given these technical indicators, the uptrend will continue if XEC closes above the 200-day SMA in the coming days. Moreover, the Relative Strength Index (RSI) at 64.2, approaching the overbought area, confirms buyers’ dominance.

Additionally, this setup depicts an accumulation phase as more traders open new long positions ahead of further price gains. The ongoing rally will likely persist until XEC attains an overbought condition when buyers reach saturation. However, a retracement after it enters the overbought zone is still possible.

Chainlink (LINK) Notches 9% In One Day As Market Rebounds, What’s Next?

Oracle service provider Chainlink native token LINK has surged today as the crypto market records a significant uptick. The cryptocurrency is up by 9.02%, trading at $6.80 with a trading volume of $198 million, representing an over 179% increase in the last 24 hours.

One of the factors likely to affect LINK’s price growth in the coming days is the massive movement of tokens from the network’s wallet to exchanges. On September 16, four wallets associated with Chainlink transferred 18.75 million LINK tokens across various platforms, amounting to $119 million. 

These wallets were originally intended for holding tokens that were not yet in circulation. But recently, around 15.7 million LINK tokens (approximately $100 million) left these wallets headed straight to Binance. Furthermore, 3.05 million LINK tokens (roughly $19 million) left the wallets in a multi-signature wallet identified as 0xD50f.

Following these significant on-chain activities and potential implications, investors are eager to see how LINK price will react.

LINK Breaks Above $6.3 Resistance Level

LINK is in an uptrend, forming a bullish engulfing pattern to break above the $6.3 resistance level. Although LINK is still below its 200-day Simple Moving Average (SMA), today’s green candle has broken above the 50-day SMA, showing increased pressure from buyers. 

The buyers at the $6.1 support level have forced the crypto coin to rally after the brief retracement between September 16-17. Also, the Relative Strength Index (RSI) displays a value of 58.00, rising from the neutral zone and approaching the overbought region of 70. 

LINK has overcome the $6.3 resistance level today. Therefore, the buyers will likely sustain the rally in the coming days. Furthermore, the Moving Average Convergence/Divergence displays a strong buy signal confirmed by its green Histogram bars. 

The cryptocurrency will likely record more price gains in the coming days if the buyers continue to accumulate the tokens. However, the unlock and transfer of 21 million LINK tokens on September 16 could lead to a brief retracement in the long term when the buyers relent.

LINKUSD price chart

Whales Increase Holdings After Swift Test

Since August 31, when Chainlink entered into a partnership with Swift and other companies, LINK has exhibited positive market moves. The interbank communication system Swift and Chainlink, successfully transferred tokenized value across various private and public blockchains in an experiment. 

The positive development boosted investors’ confidence in buying more LINK tokens, potentially pushing the token’s value up. On September 7, Santiment noticed that Chainlink’s top-tier holders, those with 10,000-100,000 LINK tokens, were actively increasing their holdings.

The number of wallets holding 10,000 to 100,000 LINK tokens increased to 3,127, the highest since December 3, 2022. These wallets collected $9.6 million worth of LINK in just three days, 0.154% of the total supply. Additionally, Santiment’s report showed that 98 new wallets in this category were created.

On September 9, a crypto expert, Ali, revealed that these whales bought more than 4 million LINK coins, amounting to $24 million in just 10 days.

These accumulations show heightened investor interest in Chainlink and will likely drive demand, thereby increasing the token’s price in the coming days.

Bitcoin Forecast: Analyst Who Predicted 2022 Bottom Unveils New Long Positions For BTC

In a recent YouTube interview with TechnicalRoundup, crypto Analyst DonAlt revealed he had purchased Bitcoin after the asset fell below the $25,000 level. According to the analyst also predicted the crypto market bottom in 2022, he had two choices before opening the new BTC position

DonAlt Shares Insights On Bitcoin’s Next Price Moves

Explaining the reasoning behind his decision to purchase Bitcoin, DonAlt told TechnicalRoundup:

We’re at the point where you could make an argument for buying here [around $26,000]. And if you’re wrong, you get stopped out, and you get to buy at $19,000. The problem with kind of not doing anything, and the reason why I took a trade – I bought like a little bit, not too much, but a little bit of Bitcoin – is, basically, because I’m just guessing that I will not get an entry otherwise.

Furthermore, DonAlt stated that if his prediction is correct, he will exit the trade after attaining a profit level of double-digit percentage points. According to him, his profit target is $30,000, but with a neutral sentiment on the trade. 

“I’m not too bullish. I’m not too bearish. The reason why I kind of think this is an interesting trade in general is, basically, because I think if this fails… if you break down here [below $24,900]. I think we’re going to start capitulating. And then we’re going to start capitulating proper. And we’re going to go to $20,000. So, you basically have an invalidation around $25,000 right now,” he added.

Meanwhile, bitcoin trades at $26,638 today, September 15, above the $24,900 capitulation zone. And according to another crypto analyst, Ali Charts, the TD sequential indicator has displayed a buy signal for BTC on the weekly chart.

However, he believes that for this sentiment to be confirmed, BTC must close this week above $25,600. If this happens, BTC could rally to $28,350 or up to $31,800. 

Crypto analyst Titan of Crypto, with over 44,000 Twitter followers, also chimed in on the asset, saying that past performance does not guarantee future results. However, he believes comparing the present price action to previous ones is important.

He said that if BTC follows its past price action and there is no negative event before its halving, it can attain $37,500 before a pullback. 

BTCUSD price chart

Will Bitcoin Hit The $30,000 Mark?

Bitcoin has entered an accumulation phase after breaking above the 38.2% Fibonacci Level ($26,406). The buyers control the market, as evidenced by the four consecutive green candles on the daily chart. 

However, it faces resistance at the 50% Fib level ($26,738). If the buyers continue to mount pressure, BTC will rise to the 61.8% Fib level ($27,069). 

Also, the Relative Strength Index (RSI) indicator displays a value of 52.11 and is rising from the neutral zone into the buy zone as more traders enter long positions. Furthermore, the Moving Average Convergence/Divergence (MACD) is above its signal liner and displays a strong buy signal. 

The green Histogram bars confirm that BTC is in a positive price trend. BTC will likely continue its rally in the coming weeks if the buyers sustain their pressure and break above the $26,738 resistance level. Although if traders begin to take profit, then a brief retracement will likely occur before a continuation of the uptrend.