Crypto Thunderstruck: THORChain (RUNE) 21% Charge Emerges As Top Weekly Gainer

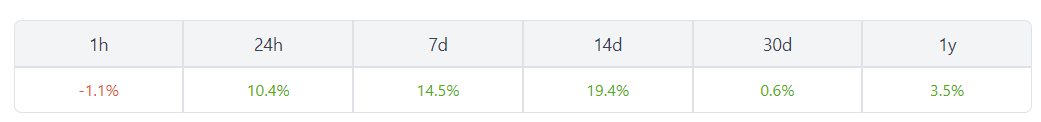
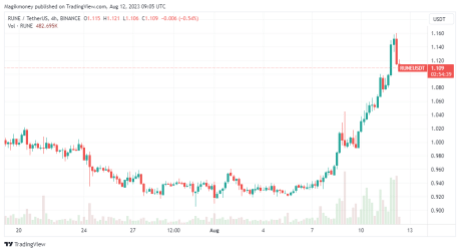
The dynamic world of cryptocurrencies has once again witnessed a fascinating turn of events, this time with THORChain (RUNE) taking center stage. Over the past seven days, THORChain has experienced a substantial surge in its price, marking an impressive increase of 20.19%. This resurgence has sparked intrigue and excitement among crypto enthusiasts and investors, prompting a closer examination of the factors contributing to this rapid upward movement.

THORChain (RUNE) Has experienced a significant spike in the past week: Source @Tradingview

The Catalysts Behind The Surge

RUNE has made a resurgence in recent months from its lows in June to its recent highs gaining 40% during this period. However, its price is still 10% down from the start of the year and there are expectations that this could be an extended bullrun. 

Related Reading: Shiba Inu Keeps Energy Alive, Snags 26% Gain – Here’s The Inside Scoop

The surge in THORChain’s price invites a deeper investigation into the underlying dynamics and catalysts that have propelled this substantial price rally. While a myriad of factors often influences the cryptocurrency market, several key drivers may have played a role in THORChain’s recent surge:

Substantial progress in THORChain’s underlying technology, protocol enhancements, and ecosystem expansion has triggered renewed interest and investment. Positive fundamental developments often align with price surges as investors anticipate potential long-term growth prospects. Cryptocurrency markets are renowned for their inherent volatility. While volatility can create risks, it allows traders to capitalize on price swings. The recent surge in THORChain’s price may be driven, in part, by heightened market volatility.

THORChain (RUNE): Forecasting Future Trajectories

Considering THORChain’s recent surge, attention naturally turns to the future prospects of this cryptocurrency. Various experts and analysts have offered their insights into THORChain’s potential trajectory.

Related Reading: GMX Drops 24% in 1 Month, Whales Rapidly Selling: What’s Going On?

According to short-term prediction, THORChain’s price could experience a minor retracement to $1.02 by August 16, followed by a recovery to $1.24 by September 9. This prediction underscores the inherent volatility of short-term price movements.

Looking ahead to 2023, divergent forecasts paint a range of possibilities. CaptainAltCoin suggests a potential dip to $0.6726 by October, with the year closing at $0.8817. However, if the bull run continues to persist there could be a spike to $2.12 by the year’s end. 

Navigating The Unpredictable Path Ahead

As THORChain continues its remarkable surge, the crypto community remains captivated by its price movement. The convergence of various factors, including market sentiment, technical indicators, fundamental developments, and overall market volatility, has likely contributed to this recent rally. However, the cryptocurrency landscape is known for its unpredictability, and the path ahead for THORChain remains uncertain.

(This site’s content should not be construed as investment advice. Investing involves risk. When you invest, your capital is subject to risk).

Featured image from iStock, chart from TradingView

Compound (COMP) Bears Take Full Control As Price Dips 20% In 7 Days

Compound (COMP), a leading player in the decentralized finance (DeFi) sector, has encountered a significant setback, witnessing a 20% decline in its price over the past week. The downward trend continued with a 3.06% decrease in the last 24 hours and an additional 0.79% shrinkage in the most recent hour, placing the current price at $55.62 per COMP. Moreover, COMP is now 93.90% below its all-time high of $911.20, a substantial drop from its previous peak.

Related Reading: Crypto Analyst Points To Bitcoin Price History Repeating Itself – Are The Signs Bullish?

Challenges Ahead For Compound

Currently priced at $56.69, Compound (COMP) holds the 85th spot among all cryptocurrencies based on market capitalization. With 7,792,894 COMP tokens in circulation, the token’s total market capitalization amounts to $440,641,903. The current rankings and market performance indicate that COMP faces significant challenges amid recent market conditions. 

Compound (COMP) has experienced a signifcant dip this week: Source @Tradingview

Recent price declines have resulted in COMP slipping down the rankings, indicating the need for cautious monitoring of market conditions. In the ever-changing landscape of cryptocurrencies, tokens must continuously adapt to market trends, technological developments, and regulatory changes to maintain and improve their positions. As investors and traders navigate this complex environment, they must exercise due diligence and stay informed about the factors affecting the performance and rankings of tokens like Compound.

COMP Price Analysis And Prediction

This persistent bearish movement is a cause for concern, and potential investors should exercise caution. The current market conditions suggest that COMP is in a downtrend, indicating that the token is experiencing a dip. Various factors, including market sentiment, external events, and regulatory developments can influence price declines of this magnitude.

Examining the situation from a broader perspective, the Compound cryptocurrency’s price trajectory is anticipated to maintain a bearish outlook as long as it remains below the $71 threshold. At present, the trading value rests at $58.28. Should the price break below $51, it is likely to head towards the midpoint of the established trading range, situated at $40. A more substantial retracement would lead to a reevaluation of the lower range boundary, potentially bringing it down to $26.

Related Reading: XRP Whales Trigger Price Decline With Large Selling

However, there is a silver lining for those considering investing in Compound. Over the past 90 days, the token recorded a 44.33% price increase, adding $17.41 to its previous value of $39.28. This demonstrates that Compound has displayed positive performance in the past, indicating the potential for a rebound once market conditions stabilize. The cryptocurrency market is characterized by cycles of ups and downs and historical data suggests that tokens like COMP can recover and experience growth after periods of decline.

(This site’s content should not be construed as investment advice. Investing involves risk. When you invest, your capital is subject to risk).

Featured image from iStock, chart from TradingView

Optimism (OP) Tallies 13% In 7 Days Despite High Profile DeFi Hack

In the midst of the ever-changing cryptocurrency landscape, Optimism (OP) has shown remarkable resilience, posting a notable price increase of 13.53% in the past seven days. Despite facing a slight decline of 1.80% in the last 24 hours and a further 1.35% shrinkage within the hour, Optimism remains on an upward trajectory.

With the current price sitting at $1.68 per OP and still 48.38% below its all-time high of $3.26, traders and investors are eager to uncover the reasons behind its recent gains. This article explores the factors contributing to Optimism’s recent surge and analyzes its prospects.

optimism (OP) price has enjoyed a steady spike in the past week: Source @Tradingview

High Profile Hack Could Stall Optimism (OP) Bullish Trajectory 

Optimism’s positive trajectory took an unexpected turn when Coinbase’s newly launched BASE network, built on the Optimism Stack, fell victim to a backdoor contract exploit. This unfortunate event resulted in the loss of 597 Ether, equivalent to approximately $1 million.

The exploit involved infiltrating a backdoor contract on the BASE Chain, which enabled the continuous minting of tokens that were subsequently sold for profit. The exploiters managed to mint 40 different tokens, generating significant profit, which was then moved out of the perpetrators’ address.

Related Reading: Curve Finance Exploiter Returns 61,000 ETH After Protocol’s Stern Warning

As BASE anchors the OP Stack, there are concerns that the recent exploit could have repercussions on all associated protocols, including the Optimism network. Furthermore, the hype surrounding BASE had attracted several new addresses to the Optimism network, potentially dampening investor sentiment and a subsequent impact on OP’s price.

The number of active addresses on the Optimism network increased following BASE’s launch in late February. However, the recent hack may stall this growth, as investors might exercise caution in the wake of the exploit.

Will The Bulls Sustain The Impressive Rally?

Despite the recent BASE exploit, Optimism (OP) has managed to maintain a sense of optimism in the market. The OP/USD daily chart displays promising signs of bullish momentum, with the bulls surpassing critical support levels. Short green candlesticks formed above the $1.631 support level indicate the market’s resilience and determination to keep the price afloat despite the challenges posed by the recent exploit.

The technical indicators further reinforce the bullish outlook for Optimism. The Moving Average Convergence/Divergence (MACD) remains above the signal line, characterized by green histogram bars that signify the asset’s bullish momentum. Additionally, the Relative Strength Index (RSI) has entered the overbought region, reaching a value of 75. This suggests a considerable increase in buying pressure on OP as investors show confidence in the token’s potential for future growth.

Related Reading: Coinbase Research Expert Decodes Latest Crypto And Finance Market Trends

However, while the market sentiment remains positive, traders and investors should exercise caution. The recent BASE exploit has raised concerns about the potential impact on Optimism’s network and the broader sentiment surrounding the token. 

The cryptocurrency market is known for its volatility, and external events can have significant implications for token prices. It is crucial for market participants to closely monitor developments related to the exploit and assess any potential consequences for Optimism’s price trajectory. Despite the positive indicators and bullish momentum, staying informed and vigilant in such a rapidly changing market is essential for making well-informed decisions.

(This site’s content should not be construed as investment advice. Investing involves risk. When you invest, your capital is subject to risk).

Featured image from iStock, chart from TradingView

Maker (MKR) Signals Bullish Price Formation – Is $1.300 Around The Corner?

Maker (MKR), one of the prominent players in the decentralized finance (DeFi) space, has experienced a remarkable 11% price surge in the past seven days. Despite a slight drop in the last hour, the token’s performance remains impressive. 

Maker (MKR) Bullish Price Sentiment

Maker’s recent price performance has been noteworthy, with a solid 11% increase over the past week. The token also recorded a 4.21% price increase in the last 24 hours, indicating strong momentum in the short term. However, a minor correction of 0.81% in the past hour highlights the market’s volatility.

Currently trading at $1,220.43 per MKR, the token remains 80.75% below its all-time high of $6,339.02. While the recent price surge is encouraging, it is essential to consider the historical context and the factors influencing the crypto market’s dynamics.

Maker (MKR) is up 11% in the past week: Source @Tradingview

The MakerDAO community recently voted in favor of a temporary increase to the interest rate paid to holders of the protocol’s decentralized stablecoin, DAI. This proposal introduced the Enhanced Dai Savings Rate (EDSR), a mechanism to temporarily boost the Dai Savings Rate (DSR) to users during periods of low utilization.

Proposed by Maker founder Rune Christensen, the EDSR could increase the effective DSR to 8% when the utilization ranges from 0% to 20%. The mechanism is designed to decrease the DSR as utilization increases gradually.

Related Reading: Shiba Inu Reclaims 14th Spot In Market After 5% Jump

This isn’t the first time Maker has adjusted the DSR. In the past few months, the protocol has raised the DSR thrice: first to 1% in November, then to 3.3% in May, and finally incorporating a marginal increase to 3.49% in June. The latest EDSR proposal aims to incentivize DAI holders and stimulate demand for the stablecoin.

Stimulating Demand For DAI

Despite the recent increase in the DSR, data from Dai Stats shows that investors have only deposited $307 million in the DSR, representing a modest 6.7% of the total supply of DAI. The amount of DAI in circulation decreased to $4.6 billion from over $6.9 billion in the previous year.

In response to the declining circulation of Maker’s dollar-pegged stablecoin, the protocol is taking proactive steps to spur demand for DAI. By enhancing the interest rate DAI holders can earn, the protocol aims to attract more users and create a favorable ecosystem for DAI utilization.

Related Reading: Tether (USDT) Market Cap Reaches New Peak, Edges Toward $84 Billion Mark

The broader stablecoin market has also experienced a downtrend, with the total market capitalization sinking to $127 billion from nearly $160 billion a year ago. The introduction of EDSR is seen as a strategic move to increase the appeal of DAI and strengthen its position in the competitive stablecoin landscape.

What’s Next For Maker (MKR)?

As Maker continues improving the DAI ecosystem, investors closely monitor its governance decisions and the market’s response to the enhanced interest rate mechanism. The success of the EDSR proposal could drive further adoption of DAI and contribute to its overall liquidity in the market.

Moreover, the broader crypto market’s performance and regulatory developments will determine Maker’s future trajectory. If the bullish sentiments continue, Maker could surpass the $1,300 resistance point but if the opposite occurs the next support levels are $1,200 and $1,180. 

(This site’s content should not be construed as investment advice. Investing involves risk. When you invest, your capital is subject to risk).

Featured image from iStock, chart from TradingView

Casper (CSPR) Spikes 15% Following Key Partnership – What’s Next?

Casper (CSPR) has been making significant strides in the cryptocurrency market, attracting attention with its aim to accelerate enterprise and developer adoption of blockchain technology. As a live proof-of-stake blockchain built off the Casper CBC specification, Casper offers unique features and growth potential, drawing interest from investors and enthusiasts alike.

In the past week, there has been a significant upturn in its on-chain volume. Casper has experienced a substantial price surge in the past 24 hours, with its value increasing by 4.62%. This surge has created excitement among investors, especially as the cryptocurrency has displayed steady growth over the past 7 days, gaining an impressive 14.58%. The positive price movement has generated enthusiasm and optimism among Casper investors, who are pleased with their returns during this period.

Casper (CSPR) price has spiked in the past few days: Source @Tradingview

As of the latest data, Casper (CSPR) is ranked 84th among all cryptocurrencies, with a current price of $0.04035. The circulating supply of Casper stands at 11,202,499,993, contributing to a total market capitalization of $456,309,769. The cryptocurrency’s recent performance has been particularly noteworthy, showcasing impressive short- and long-term growth.

Collaboration With INX Boosts Market Sentiment

A contributing factor to Casper’s recent growth can be attributed to its strategic partnership with INX, a United States-regulated broker-dealer. Casper’s equity was tokenized and listed through this collaboration, enhancing investor confidence and further supporting the cryptocurrency’s upward trajectory. This strategic move has enabled Casper to tap into new markets and expand its reach to a broader audience.

Related Reading: Cardano (ADA) Price Remains Muted Despite Significant Milestones, Why?

Casper’s price surge aligns with the optimistic market sentiment toward cryptocurrencies. The growing interest from institutional investors and the increasing mainstream adoption of digital assets has instilled confidence in crypto. Additionally, influential figures within the blockchain industry have shared positive views on cryptocurrencies, including Casper, contributing to the overall positive outlook.

Casper (CSPR) Price Analysis

Casper has experienced a consistent upward trend in July after it bottomed at $0.0365. Since then, its price has increased by 30% and has hit heights of $0.0405. This positive trend is likely to continue in the coming weeks with more developments expected to be deployed on Casper.

From a technical analysis standpoint, Casper exhibits promising signals. The daily chart reveals the formation of a bullish falling wedge pattern, indicating a potential trend reversal.
CSPR has also surpassed the 25-day exponential moving average and is currently testing the 50-day MA. If the bullish trend continues the next resistance point is $0.40 while a bearish downturn will see the support at $0.0397.

Related Reading: Why Worldcoin (WLD) And PEPE Dominate The Crypto Market Trends This Week

As Casper continues to gain visibility and traction in the market, its future growth potential remains promising. The cryptocurrency’s underlying technology, including its proof-of-stake consensus mechanism, offers scalability, security, and energy efficiency. These features position Casper as an attractive enterprise adoption and long-term development candidate. 

(This site’s content should not be construed as investment advice. Investing involves risk. When you invest, your capital is subject to risk).

Featured image from iStock, chart from TradingView

European Commission To Present Regulatory Framework For Digital Euro In June

Fabio Panetta, a member of the Executive Committee of the European Central Bank (ECB), recently announced that the European Commission would be presenting a legislative proposal for the digital euro in June. He further stated that the next steps would be decided in October.

Digital Euro Regulatory Framework In Progress

In an interview with the ECB’s official site, Panetta confirmed that the eurozone bank is in regular contact with the European Commission to establish a regulatory framework for the digital euro. The digital euro is set to become the official central bank digital currency (CBDC) for the 27 countries in the European Union.

Panetta stated, “We are studying the design of the digital euro, its distribution, and its impact on the financial sector.” He also mentioned that the proposal expected to be presented in June would receive a response from the Governing Council of the ECB in October.

Related Reading: Sui (SUI) Continues Downward Trend As Bears Maintain Control

The Governing Council will then decide whether to initiate a preparation phase to develop and test the digital euro. According to Panetta, the European CBDC testing phase could last two to three years.

If everything progresses smoothly and both the Governing Council of the ECB and the legislators of the European Parliament approve the proposal, the digital euro could be launched in approximately three to four years, estimated Panetta.

Will The Digital Euro Receive Significant Adoption?

During the interview, Panetta was asked about the benefits and potential risks of using the digital euro. In response, he emphasized the need to provide citizens with a risk-free digital means of payment that can be used freely throughout the euro area.

Panetta highlighted that such a solution currently does not exist, pointing out that the card payment market is dominated by non-European companies, specifically referring to Visa and Mastercard. He stated that this situation would be unthinkable in the United States and expressed concern about companies selling users’ personal data.

Related Reading: Shiba Inu Burn Rate Surges 1500% In 24 Hours, Yet Price Continues To Struggle In Red

Panetta also emphasized the importance of central bank money remaining at the financial system’s core. The increasing adoption of cryptocurrencies like Bitcoin (BTC) raises concerns for entities like the ECB.

Addressing concerns about privacy, Panetta clarified that the ECB would not have access to personal data. Financial intermediaries will handle the distribution of the digital euro, and a balance must be found between ensuring confidentiality and combating money laundering and terrorist financing. Panetta noted that the responsibility of finding this balance lies with the legislators.

CBDCs On The Rise 

Central Bank Digital Currencies (CBDCs) are indeed on the rise as countries worldwide explore the potential of digital currencies issued and regulated by central banks. Countries like the Bahamas and Nigeria have already launched their digital currencies, while China and Japan are in advanced pilot stages.

Bitcoin is trading at around $27,200: source @Tradingview

-Featured image from iStock.com, chart from Tradingview.com

Sui (SUI) Continues Downward Trend As Bears Maintain Control

The crypto market once again experienced a sell-off this week, leading to a plunge in the price of many crypto assets. The impact of this market downturn is not limited to Bitcoin alone, as it has affected various cryptocurrencies, including Sui (SUI), a Layer 1 smart contract platform. Sui has witnessed a significant decline of 15% in its value over the past seven days, reflecting the broader negative sentiment prevailing in the market.

Sui Dips Below $1 Support Levels

SUI experienced a significant setback this week, breaching its crucial support level at $1. This support had been maintained since early May, providing stability for the token during that period. However, after enduring two weeks of downward-sloping resistance from above, SUI finally succumbed to selling pressure.

Related Reading: Shiba Inu Burn Rate Surges 1500% In 24 Hours, Yet Price Continues To Struggle In Red

The token’s decline reached a low point of $0.95 on Wednesday, marking an all-time low for SUI since its launch at the beginning of the month. This sharp drop highlights the prevailing bearish sentiment surrounding the token and its challenges in the current market conditions.

Sui experienced a slight correction this week: source @Coinmarketcap

Technical Indicators Point To Potential Bearish Path

Sui, a layer 1 smart contract platform, distinguishes itself with its unique programming language called ‘Move.’ Developed by the lead executives of Meta’s now-defunct Diem stablecoin project, Sui aims to address common pain points of first-generation blockchains, such as scalability and programmability.

Despite its innovative approach, Sui has struggled to generate substantial gains since its inception in the trading market. In the short term, the coin may continue to experience lower lows. According to technical analysis on TradingView, the current conditions indicate that asset selling might be prudent. Seven of the 11 daily technical indicators are signaling a ‘strong sell,’ with no indicators displaying buy signals.

Related Reading: Aptos Hackathon, Partnerships Set APT Bulls Up For A Strong Run

Additionally, the relative strength index (RSI) for SUI is currently hovering slightly above 40. With the RSI above 40, it suggests that there is a moderate level of buying pressure, but the overall sentiment remains uncertain.

Sui is trading around the $1 mark amid bearish sentiments: source @tradingview

To counteract this bearish trend, Sui would need to reclaim the $1.05 level as support, which could provide a foothold for potential recovery. However, if Bitcoin fails to maintain its support at $26,000, Sui will likely face further downward pressure, potentially sinking as low as $0.90.

Given the current market conditions and technical indicators, investors and traders should exercise caution and closely monitor Sui’s performance. Evaluating factors such as market sentiment, trading volume, and overall market dynamics will be crucial in determining the future trajectory of Sui and whether it can reverse its bearish trend. At press time, SUI price was $0.987 $ with a 24-hour trading volume of $89,278,135 USD.

-Featured image from iStock, charts from CoinMarket and TradingView.com

NEO Token Surges 10% In The Past 24 Hours – Here’s Why

NEO emerged as the largest gainer among the top 100 cryptocurrencies by market cap in the past 24 hours. At the time of writing, NEO has been trading at $10.75 while managing $106.2 million in volume, according to Coinmarketcap.

The 59th largest crypto, with a market cap of $760.2 million, is also one of the top-performing coins in the past week, with more than 14% gains.

NEO Experiences A Resurgence In 2023

Much like the rest of the crypto market, after the brutal 2022, NEO price surged in value in 2023 to nearly $15 towards the end of February, only to drop under $10 in the second week of March. Over the next month, the price of NEO went upwards before topping at just above $13.50. And last week, NEO went back to around $9 before it started gaining traction this week.

NEO has experienced a positive rise in the past 7 days: source @Coingecko

While the exact reasons behind NEO’s current surge are not clear, it is worth considering the recent developments in the project. NEO has recently made a significant foray into the field of artificial intelligence (AI). As AI fever has gone mainstream and permeated the crypto industry, NEO’s integration of AI has sparked excitement and possibilities. 

Related Reading: Kava (KAVA) Price Rallies 10% In 7 Days – Here’s Why

This convergence of two rapidly evolving fields has the potential to introduce advancements in algorithmic trading, predictive models, forecasting tools, and enhanced security and fraud detection. However, it is worth noting that many crypto projects are leveraging the AI trend without substantial implementation or genuine value, which is a trend observed across various sectors due to the current hype surrounding AI technologies.

In the case of NEO, the project recently announced the winners of its NeoChat ChatGPT launch competition. This investment in AI is likely one of the contributing factors to the recent spike in NEO’s price.

While up 61% in 2023 so far, NEO is still down a whopping 95% from its all-time high (ATH) of almost $200 that was hit in Jan. 2018.

NEO Price Analysis 

The latest NEO price analysis shows the dominance of green candlesticks with slight resistance from the red ones. Yet, the latest chart shows bullish momentum, with the price approaching $10.88 for the second day today. The average of Bollinger bands is set at $10.07 at the time of writing.

Related Reading: Shiba Inu Burn Rate Surges 1500% In 24 Hours, Yet Price Continues To Struggle In Red

The short-term trend line and SMA 20 curve are upward, indicating a bullish uphold. The moving average indicator displays a value of $10.83, the highest value achieved in the past 24 hours.

Neo charts point to a bullish trend: source @Tradingview

From the given NEO price analysis, the bulls are taking over the cryptocurrency with a steep rise in price. This rise may take the current price levels and reach a new high above the $10.90 resistance. The RSI score detected from the hourly chart is 71, which has crossed the overbought threshold set for the coin value.

This affirms the upcoming rise in the price of the support level also continues to increase. The resistance level at $11.29 can be challenged if the buying momentum remains persistent.

-Featured image from iStcok.com, charts from Coingecko and Tradingview

Kava (KAVA) Price Rallies 10% In 7 Days – Here’s Why

KAVA, the native token associated with the Kava platform, has experienced a whirlwind week regarding its price swing. The token, which began the week trading around $1.03, surged to $1.23 on May 23, driven by positive news within its ecosystem. 

However, the bull momentum was short-lived, with the token recently experiencing a significant price correction. Nevertheless, at the time of writing, KAVA is up 10% and is one of the top gainers in the crypto market within this period. 

Kava has experienced a significant price correction this week; source @tradingview

What’s Behind The Recent Spike In Kava?

However, it is important to analyze the factors behind this rally to assess its sustainability. Cryptocurrencies are known for their price volatility, and sudden reversals are not uncommon. In the case of KAVA, the token experienced a swift downturn following the initial surge, raising concerns about the solidity of the upward movement. 

Related Reading: Bullish Case For Litecoin Grows Stronger As LTC Halving Draws Close

This pattern is often observed when a rapid rise lacks strong fundamental support, leading to a correction as the market adjusts itself. In terms of recent developments, it was reported that the Digital Asset Exchange Association (DAXA) in South Korea removed investment warnings on KAVA and WAVES, the latter being another digital asset associated with the Waves platform. 

The warnings had been issued due to concerns about stablecoins linked to these assets, which were found to be “not normally linked to 1 dollar”. However, after a thorough review, DAXA determined that the risks associated with KAVA and WAVES had been resolved, allowing South Korean exchanges to resume deposit services for these tokens. This news likely contributed to the positive sentiment surrounding KAVA and may have played a role in the recent price rally.

In addition, the launch of the Kava 13 mainnet and the introduction of GameFi (Game Finance) and non-fungible tokens (NFTs) to the Kava ecosystem have also contributed to the positive momentum for the KAVA token. These developments have attracted attention and interest from users, investors, and traders, potentially driving the token’s price higher.

What’s Next For KAVA?

The price surge experienced by KAVA stands out as an outlier within the broader context of the cryptocurrency market. Considering the overall outlook, such gains may not be sustainable, and a subsequent correction could erase the entirety of the upward movement.

Related Reading: Upcoming Interest Rate Hikes Could Be The Next Big Challenge For Bitcoin, Here’s Why

If the current levels near $1.20 fail to provide sufficient support, KAVA/USD might retreat towards the support level at $1.10 or even lower.

Kava currently trading below the $1.20 resistance mark: source @tradingview

However, on the other hand, if there is an overall uptick in the market sentiment or if there is fresh, positive news specific to KAVA, it could potentially lead to renewed buying interest and push the price toward a retest of the recent highs. At press time, KAVA sells at $1.134 per token with a slight 0.9% 24-hour increase.

-Featured image from Kava.io, charts from tradingview.com

Conflux Token (CFX) Retraces After 39% Gains In Seven Days

Conflux (CFX), the token powering Conflux’s high throughput, Tree-Graph powered layer-1 blockchain, experienced a rollercoaster ride in a whirlwind of price fluctuations. Last week, it tumbled to a low of $0.20 per token, leaving observers on edge. However, it managed to climb back up over the course of the week, reaching a level of $0.330.

However, the token has faced a downward trajectory in the past four days, resulting in a decrease of over 19% in price. CoinMarketCap data shows that CFX has dipped around 2% in the last 24 hours. Despite this recent dip, optimistic projections for its future price persist.

Conflux price has retraced in the past 24 hours: source @coinmarketcap

While it may have encountered some setbacks, Conflux has remained one of the top performers in the past seven days, impressively gaining over 30% during this period. Maintaining a position above the key support level of $0.295, which aligns with the previous week’s high, provides some stability amidst the turbulence.

What’s Driving Conflux (CFX) Growth?

Conflux (CFX) has been making waves with its remarkable on-the-year gains of approximately 1,700%. Naturally, observers are curious about the role of whales in this upward surge, speculating whether they are driving the buying and pumping of the token. While it’s a possibility, we can’t say for certain.

The impressive performance of Conflux coincides with the optimism surrounding China’s renewed interest in cryptocurrencies. As the country seemingly shifts its stance towards the crypto industry, there are hopes that Conflux will reap the benefits. The project has been actively fostering partnerships with various regional enterprises, positioning itself as a potential frontrunner in meeting regulatory requirements.

Related Reading: XRP Emerges As Top Performing Crypto With 55% Surge – Messari Report

Among its notable partnerships, Conflux has joined forces with Little Red Book, often called China’s equivalent of Instagram. This collaboration opens up exciting opportunities as Little Red Book’s massive user base of 180 million individuals can now showcase Conflux-based non-fungible tokens (NFTs) on their profiles. Additionally, Conflux has forged a partnership with China Telecom, further enhancing its presence and potential within the Chinese market.

Conflux, China Telecom Introduce Blockchain SIM Card

Conflux Network and China Telecom have unveiled the world’s first Blockchain SIM (BSIM) card, a mobile user identification card based on blockchain technology. The BSIM card, resembling traditional SIM cards, is compatible with Android and iOS systems and offers significantly larger storage space and computing power than traditional SIM cards.

The BSIM card goes beyond standard communication functions by generating and storing users’ public and private keys within the card itself. By employing a “private key never leaves the card” approach for digital signatures enhances security and reduces the risk of malware or virus attacks on mobile terminals. Additionally, the card provides encrypted storage and key recovery features and integrates traditional U-shield functions, making it a highly secure Web3 user terminal entry solution.

Related Reading: Injective (INJ) Surges By 19% Following ‘Surprise’ NFT Announcement

This collaboration between Conflux Network and China Telecom showcases their innovation in merging blockchain technology with mobile user identification, introducing a robust and efficient solution for users in the ever-evolving digital landscape.

What Next For Conflux (CFX)?

As long as renowned cryptocurrencies like Bitcoin and Ethereum continue to thrive in the face of global banking system concerns, Conflux (CFX) might also benefit from these favorable market conditions. Additionally, the prospects of significant financial easing from central banks, including the Federal Reserve, could further bolster CFX’s performance.

Hong Kong’s recent decision to legalize certain cryptocurrency trades is a noteworthy development to monitor. This move is seen by many as a testing ground for potential crypto legalization on the mainland. Considering Conflux’s growing popularity and adoption in China, CFX stands to gain as a key beneficiary of this trend. The recent collaboration with a Chinese SIM card company further strengthens the optimism within the crypto community.

These factors collectively contribute to the positive outlook for CFX, as it rides the coattails of established cryptocurrencies, anticipates favorable monetary policies, and capitalizes on potential crypto legalization in China. At press time, Conflux was trading at $0.2962.

Conflux trading below $0.3: source @tradingview

-Featured image from iStock.com, charts from CoinMarketCap and TradingView.com

Bitcoin SV Tallies 10% Gains On Weekly Chart, Nears $40 Mark

While the global crypto market capitalization has plunged in the past week, with most coins trading in the red, Bitcoin SV (BSV) bucked the bears. BSV has scored 10% price gains on the weekly chart. The coin gained 2.47% on the last day, showing a 0.57% price increase in the previous hour. With today’s performance, Bitcoin SV joined the list of top-performing coins over the past timeframe and might be nearing $40.

Bitcoin SV Back In The Spotlight

Bitcoin SV was created in 2018 due to a hard fork from Bitcoin Cash led by the controversial Craig Wright. The idea was to create a blockchain that could process transactions faster with a larger block size limit, a major bottleneck for Bitcoin Cash and Bitcoin. 

In addition, BSV has incorporated Ethereum-like capabilities such as native tokens, smart contracts, and other features to ensure interoperability within its blockchain. However, the token has failed to gain the sort of adoption it envisaged and hit an all-time low on May 8, bottoming at $29.17. But a series of events in the Bitcoin ecosystem has made the controversial token jump into the limelight. 

Related Reading: Coinbase Engages Legal And Political Aids In Battling SEC

Top among these is the congestion on the Bitcoin network caused by Ordinals NFT and BRC-20 tokens. Bitcoin SV supporters believe its high transaction throughput and low transaction fees make it a better blockchain than Bitcoin, and the numbers support it. Currently, the average transaction fee on BSV is about $0.035, while average Bitcoin fees have spiked to $31.50 as more users jump on the BRC-20 token trend. This has led to a debate in the Bitcoin community, with advocates for increasing the block size growing louder. 

This move has been rebuffed by core Bitcoin maximalists who believe that increasing this capacity would lead to greater centralization – As fewer people can run a node that operates using higher bandwidth. This could be Bitcoin SV’s gain as proponents believe it could provide an excellent alternative and fulfil llSatoshi Nakamoto’s dream of a peer-to-peer electronic money system as outlined in the original Bitcoin whitepaper. 

Related Reading: Ripple CTO Labels BEN Coin As Scam, Bitboy Reacts

Bitcoin SV Price Analysis 

At the time of writing, Bitcoin SV is trading at $35.98, and if the bullish momentum continues, BSV could target $40 in the coming days. However, before reaching the $40 target, Bitcoin SV bulls may encounter an intermediate hurdle in the $37-$39 range.  

BSV has experienced a bullish price swing this week: source @Tradingview

However, before reaching the $0.60 target, the bulls may encounter an intermediate hurdle in the $0.57 to $0.58 range. The SMA 20 is in the buy zone, which could indicate that investors are looking to accumulate more of the token, which is a bullish sign. In the event of a decline, substantial support is anticipated at $32. 

-Featured Image from iStock, charts from TradingView

BRC-20 Tokens Lose 40% Market Cap In 7 Days – Here’s Why

The crypto market has been looking to consolidate following a major price correction earlier in the week. One market that has felt the brunt of this correction is BRC-20 token which has suffered a major dip in its market cap. 

According to brc-20.io, which tracks the nascent market for tokens minted on the Bitcoin blockchain, the market cap of all BRC-20 tokens between May 8 and 11 went from $990,000,000 to $379,000,000, a 62% drop. At the time of writing, the market cap of BRC-20 tokens has rebounded and is around $570,000,000, making it a 40% dip within the seven-day trading period. 

Related Reading: Bakkt Streamlines Apex Crypto Platform By Removing 25 Tokens

The BRC-20 market is largely tied to the capitalization of ORDI token, which dominates more than 80% of the trading volumes. At the time of writing, it is currently trading around $15, down from its all-time high price of $28, achieved earlier in the month. The importance of ORDI in this market means that price variations directly and considerably affect the market cap of BRC-20 tokens. 


Ordi tokens dominates with more tha 80% of the BRC-20 MarketCap

A Deep Dive Into BRC-20 Token 

BRC-20 is an experimental standard for issuing and transferring fungible tokens on the Bitcoin network. The deployment, issuance, and transfer of these tokens is done via a JSON data entry. Hence its relationship with the NFT Ordinals of Bitcoin. 

The creation of this standard is credited to a developer known as Domo on Twitter. On March 8, the computer scientist announced his progress in this area and acknowledged that it would be difficult for him to take this test further. For this reason, he preferred to share the project with others to experiment with. Since then, the ecosystem has exploded, with more than 14.000 tokens launched, according to brc-20.io.

Although the name BRC-20 is a reference to Ethereum’s ERC-20 standard. However, both standards differ in several of their characteristics, especially due to the differences between the networks in which they work, Bitcoin and Ethereum.

First of all, Bitcoin’s BRC-20 tokens do not have the ability to interact with smart contracts, while ERC-20s do. Other limitations of the BRC-20 tokens compared to those of Ethereum is that they cannot have decimals, be burned or frozen, and have additional functions such as approval or delegation.

Related Reading: PayPal Plunging Despite Increasing Crypto Holdings

BRC-20 Tokens Not Without Controversy

Some Bitcoin maximalists have criticized the growing popularity of BRC-20 tokens due to their effect on the Bitcoin network. There has been growing congestion on the Bitcoin network, and it broke the record for the average number of transactions processed per block with an astonishing 4,373 transactions, marking an all-time high. Nevertheless, proponents of this token standard argue that it expands the Bitcoin blockchain to new possibilities and provides new use cases for the leading cryptocurrency. 

Bitcoin hovering close to the $27,000 mark

-Featured Image from iStock, charts from brc-20.io and Tradingview

Bitcoin Price Dip Could Be Linked To On-Chain Activity

Bitcoin (BTC) has experienced downward price pressure in May, with the token failing to surpass the $30,000 resistance mark. This development could be linked to on-chain activities that indicate an increase in the number of Bitcoins sold on exchanges during this period. 

300,000 Bitcoin Sold On Exchanges In May

According to CryptoQuant, a data explorer, over 300,000 bitcoins purchased between one to six months ago have been sold this month. It is worth noting that the majority of these sales were made by individuals who acquired the cryptocurrency between November of last year and January of this year.

According to the data explorer, 266,000 bitcoins were purchased between November and January, while 78,000 bitcoins purchased between January and March were sold in May. The motivation behind these sales could be to take profits due to the significant price increase that Bitcoin has experienced since the investors purchased it.

From November to April, the price of Bitcoin rose from $16,000 to $31,000. However, since April, the cryptocurrency has been making lower highs, possibly due to the selling activity of these investors in May.

Related Reading: PEPE Attempts Market Rebound, Surges By 28% In 24 Hours

Bitcoin Shows Strength At Around $27,000

Bitcoin’s price action in recent days was significant as it demonstrated the resilience of the cryptocurrency in the face of market volatility. As mentioned, Bitcoin had fallen to as low as $26,800 before quickly rebounding and testing support at its low of $27,000. This successful retest of support once again confirmed the strength of Bitcoin in this price zone. 

The market’s high volatility yesterday can be attributed to the United States’ inflation report, which revealed a higher-than-expected increase in prices. Additionally, false rumors that the US government was selling Bitcoin caused bearish pressure on the market. Despite these events, Bitcoin held strong and was able to retest support.

Related Reading: Polkadot (DOT) Price: The Bear Vs. Bull Battle Continues – Who’ll Take The Beating?

Bitcoin has tested the support around $27,000 several times in the past two months and has formed a solid bottom. In addition, the Fear & Greed Index has declined, putting the market back into neutral territory. While this level is not necessarily bad when taken at face value, the fact that the index has declined from greed back to neutral is concerning.

Nevertheless, despite some analysts predicting that the cryptocurrency could fall to lower levels, it has not dropped below this price zone. This is a positive sign for investors as it shows that there is a strong demand for Bitcoin at this level.  Bitcoin price has consolidated as the market seeks a new equilibrium after the recent price correction. 

Bitcoin Price

At the time of writing, Bitcoin is trading at $26,804 with a 24-hour price rise of 2%. It remains to be seen whether the token will make a renewed push toward the $30,000 resistance mark in the coming days.

Bitcoin price has been on a steady decline in the past week: source @tradingview

-Featured image from iStock, charts from TradingView.

Bitcoin Struggles To Break $30,000 Resistance Level: Here’s Why

The cryptocurrency market has been trading sideways in recent weeks, with the leading token, Bitcoin, following a similar pattern. Despite numerous attempts in April, Bitcoin has struggled to break the $31,000 mark. The price is blocked by its daily Kijun at around $29,100 and by its psychological resistance at $30,000.

A correction to around $25,000 could be preferred to prepare for an extended bull run as long as this zone blocks prices. This would correspond to a retest of the same resistance level at the beginning of the year and can be confirmed as the support level. 

Bitcoin struggling to surpass its resitance level: source@tradingview

In the event of a break through the $31,000 mark, then Bitcoin could continue to climb towards $33,500. This would provide the next resistance level ahead of a potential ascent to $40,000. However, if the bears persist below $25.000, Bitcoin risks breaking the price spread, which could cause the price to fall below the $18,000 mark.

Related reading: Polygon Bears Gain Ground As MATIC Continues To Retreat

Bullish Sentiment Based On External Factors

Bitcoin is in good stead and could make a major bull run due to the following factors. First, the banking crisis is plaguing the United States and other parts of the world. Secondly, there is the decoupling between BTC and traditional markets. Finally, we can mention the brake on interest rates the US Federal Reserve promised. 

The Silicon Valley Bank bankruptcy in early March is still wreaking havoc on the industry, with many Americans scared of placing their money in the Bank. Bitcoin’s recent price surge has coincided with this, showing its flexibility as digital gold. 

Related reading: UMA Token Surges By 28% Despite General Bearish Trend

There has been a surge among investors to diversify their assets into Bitcoin for good reasons. Bitcoin does not need intermediaries; anyone can store BTC in their wallets without trusting a centralized institution. Bitcoin is a unique asset due to its volatility. At times it shows a high correlation with stock indices. While sometimes, it diverges and forms its own course. The following graph shows the comparison with respect to gold, the S&P500, and the NASDAQ.

Pearson’s correlation shows how close BTC’s behavior is to that of certain traditional assets. If the shares of banking and fintech companies continue to fall, there’s likely to be a huge inflow of volume into the Bitcoin network leading to a price surge. 

Finally, the Fed raised interest rates to 5.25% annually. This is the maximum level since 1997. But the increase came with an extra announcement: no new increases (or reductions) are foreseen for the remainder of 2023. Generally, a stalemate or reduction of interest rates is a catalyst for the increase in the price of risky assets, such as Bitcoin. 

Bitcoin Price

At the time of writing, Bitcoin is down 2% in the past 24 hours and trading for $28,826. 

Bitcoin is trading below $29,000: source@tradingview

-Featured image iStock, charts from Tradingview

Floki Inu Rallies 40% In 24 Hours: Here’s Why

We’re officially in the meme coin season as Floki Inu becomes the latest meme-based token to experience a significant price pump. The cryptocurrency inspired by Elon Musk’s Shiba Inu pup has long been considered as the next big memecoin and it appears to be living up to its hype.  Floki Inu is currently up 40% in the past 24 hours and is the second-best performing crypto-asset during this period after the fast-rising Pepe token. 

Floki Inu Benefiting From High-Profile Listings

This latest price surge can be linked to a series of high-profile listings by exchanges in recent days. Bitfinex was the first to announce the listing of Floki on May 3rd in a move that came out of the blue and surprised many in the crypto community.  This was followed by Binance, the largest exchange in the world, disclosing on May 5th that it would be listing Floki alongside Pepe in its innovation zone, with users able to deposit as of May 5th. 

The exchange further noted that it would begin trading the tokens on May 6th across four pairs: PEPE/USDT, PEPE/TUSDT, FLOKI/USDT, and FLOKI/TUSD. Binance also intends to permit borrowing on both assets and plans to add new margin pairs for FLOKI and PEPE on Isolated Margin in the next 48 hours. The Isolated Margin pairs include FLOKI/USDT and PEPE/USDT.

Floki Inu Priced Spiked as high as 60% following Binance listing: source @Tradingview

News of this listing caused significant excitement to the crypto community, which led to a positive market movement for both assets. PEPE achieved a new market high of $0.0000028, surpassing the $1 billion market cap, while FLOKI also increased by 60% within a few hours.  During this period, Floki Inu has experienced increased trading volume as many investors look to purchase the token in anticipation of a bull run. The recent bull-run of PEPE, which has risen by 11,000% in less than a month, has spurred the hype for memecoins and Floki Inu appears to be the major beneficiary. 

Related Reading: Former DoJ Kennedy Jr, Laments on Global Financial Censorship, Shows Support For Bitcoin

What’s Next For Floki Inu?

Floki Inu has gained a substantial following as a community-driven cryptocurrency that is looking to adopt a unique approach to decentralization. Its low transaction fees and suite of products, including an NFT metaverse game, the FlokiFi Defi ecosystem, the Floki University, and the NFT marketplace, have placed it high among crypto enthusiasts. In addition, the Floki team has always positioned the project as community-first and has made high-profile partnerships with sports clubs to gain adoption among mainstream crypto users. 

Related Reading: BRC-20 Token Standard A Hotspot For New Memecoins As PEPE Soars

This latest price surge is expected to bring about renewed interest in the token that appeared to have stalled in recent months. It will be intriguing to see where this coin ends as the trend persists. Since Binance has already demonstrated support by listing it in the innovation zone, it won’t be long before other exchanges follow suit.

Featured Image From Zipmex, Charts From Tradingview

Bitcoin Miners Reap Profits As Mining Difficulty Hits 3-Month Low

Bitcoin miners have received a boost in profits after the scheduled difficulty level adjustment resulted in a positive balance. This is the first time since February that the difficulty, which controls the issuance of coins on the network, has decreased. Recent data from Braiins showed that Bitcoin computing power experienced a drop of over 45+ EH/s between April 20 and 28. However, this trend has been reversed with the increase in miner profits over the last week.

Despite the recovery of the hashrate to 350 EH/s, it was not sufficient to prevent a 1.45% difficulty adjustment retracement, as stated by Mempool.space. Currently, the mining difficulty level is at 48T (trillions).  This change in difficulty level affects the miners’ profitability, as less competition for the reward means increased estimated income for those still connected to the network.

Bitcoin Hashprice has experienced a rapid rise in the past 2-weeks: source braain

Bitcoin Miners Profit As Hashprice Increases

The current price for Bitcoin hashpower rose to 0.088 USD/TH/day (88 USD/PH/day), up from 0.077 USD/TH/day (77 USD/PH/day) on May 2. This 11.49% increase over three days is a positive development for Bitcoin miners, indicating increased profitability for their operations. The hashprice is a crucial metric for calculating the profitability of a mining operation, representing the value assigned to a unit of computation in dollars per terahash or petahash per day. While the cause of the significant hashrate drop last week is uncertain, the current state of the network justifies the quick reconnection of miners. 

Bitcoin transaction fees have spiked in recent days: source @braain

Recently, there has been increased interest in BRC-20 tokens, which are used to create memecoins, leading to network congestion in Bitcoin within a few days of their release. As recently reported, this could be a possible factor in the hashrate drop. As a result of this high activity on the network, the fees are now making up 12.4% of the miners’ revenue. 

Related Reading: Bitcoin Breaks Out: Experts Predict $36,000 Target As Market Outlook Remains Positive

Bitcoin Commissions Rise After New Ordinals Record 

In the wake of the rising interest in tokens that can be registered to Bitcoin through Ordinals, the value of transaction fees paid by Bitcoin users has surged. Within a single day, the average transaction fees have more than doubled. As per the data from Mempool.space, the current transaction fees range from 70 sat/vB to 100 sat/vB. This implies that a transaction of 140 vB (median) would require payment of almost $4 USD to get confirmed within the first few minutes.

Average Bitcoin transaction fees have increased due to surge in Ordinals: source @mempool

Note that the sudden interest in tokens registered through Ordinals is responsible for the backlog of transactions that need confirmation, leading to a surge in average commissions. According to Murch, a Bitcoin developer, the mempool depth has reached 104 blocks despite having 8 blocks per hour for the last six hours. The rise of Ordinals NFTs has not been without controversy, as some Bitcoin maximalists blame this trend for the increased transaction fees that have resurfaced in recent months. 

Related Reading: Former DoJ Kennedy Jr, Laments on Global Financial Censorship, Shows Support For Bitcoin

Bitcoin Price Analysis

At the time of writing, Bitcoin is trading around $29,000, up 2% in the last week.

Bitcoin has been trading sideways in recent days: Source @tradingview

Featured Image from iStock.com, charts from Braain.com, Mempool.space and Tradingview.com

Bitcoin Price Analysis: Is A Retracement To $25,000 Likely?

Despite the relative performance of altcoins in 2023, Bitcoin has seen a significant 75% bullish rally since the beginning of the year. However, Bitcoin’s price has been unable to surpass the resistance level of $30,000 for a week, and this has stirred a technical belief that there is a possibility of a retracement streak toward the medium-term support level of $25,000.

Is Bitcoin’s Rally Losing Steam At $30,000? 

The annual upward movement in the price of Bitcoin, fueled by the banking crisis in March, may be hitting a roadblock at the $30,000 resistance level. To assess the underlying dynamics of BTC, we need to look at an extended chart, which provides a longer-term perspective spanning several weeks.

Bitcoin weekly chart shows a steep decline from $30.000 to $27,000: source @TradingView

Historically, the bullish reversals in this time frame have shown a well-defined chart structure, with phases of bullish impulses followed by periods of sideways transitions.

Related Reading: Ethereum (ETH) Drops 11%, Sheds All Gains From Shanghai Rally

The recent bullish reversal in the last quarter of 2022, followed by the rebound from $20,000 that kickstarted the current rally, was preceded by a notable bullish momentum divergence (as indicated by the RSI technical indicator) from the oversold zone.

Bitcoin Could Hit The $25,000 Support Level In Coming Days

The RSI indicator has entered the technical overbought zone as BTC approached the $30,000 resistance level. The overall chart pattern resembles that of August 2020, which saw a retracement from $12,000 to $9,500 before the subsequent bull run starting in October 2020.

Bitcoin price appears to be heading for a major price correction: source @tradingview

Considering chartist probabilities, the scenario of a retracement towards the major support at $25,000 has gained in probability. Therefore, preserving the $25,000 support level would be a key factor in invalidating the bullish trend in 2023. This retracement scenario could be triggered by a break of the short-term support at $28,800; the upper part of the bearish gap opened on Monday, June 13, 2022.

Related Reading: China Is Fast Losing Money: Their Bitcoin Stash Just Fell By $388 Million

The market is on a precarious edge following a significant session of long position liquidations. To avoid a potential return to $25,000, the market would need to bounce convincingly off the $28,800 level and break above the intermediate resistance at $29,500 to signal renewed bullish momentum. The situation remains fluid, and further price action will provide more insights into the direction of BTC’s price movement.

The Impact Of Interest Rates And US Dollar On Bitcoin’s Technical Analysis 

Bitcoin is currently at a crucial chart juncture, and the market is expected to decide in the coming hours. This decision is likely to be influenced by two key factors from the inter-asset class dynamics: the trend of market interest rates and the behavior of the US dollar on the Forex, which has returned to its annual low and is acting as a support level. 

US Dollar Index is currently hovering around a yearly low price: source @TradingView

If there is a continuation of the rebound in rates and a breakout of support on the US dollar, it may negatively impact Bitcoin’s price and increase the likelihood of a decline toward $25,000. On the other hand, if there is a cessation of the rebound in rates and the US dollar support level holds, it may counter the scenario of a decline toward $25,000. The market will ultimately determine which direction Bitcoin takes.

(This is not financial advice and is the observation of the author. Featured Image from iStock, charts from TradingView.com)