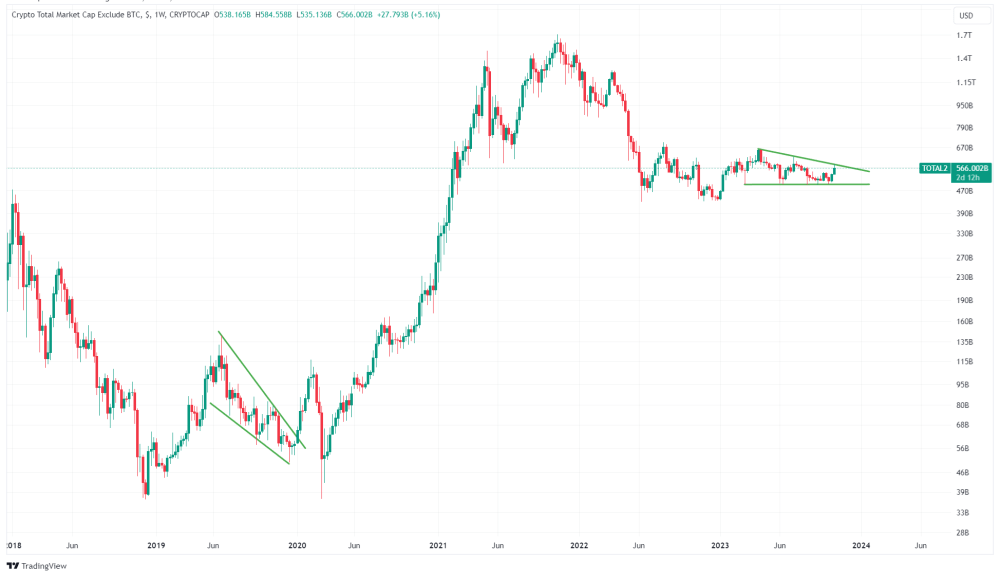
Altcoins have witnessed a significant surge recently, with their collective market capitalization rising from $575 billion to $615 billion in just a few days – an increase of 7%. This momentum hints at the potential for further growth in the Altcoin sector.
Breakout From Descending Triangle
The Altcoin market capitalization had been trading within a descending triangle pattern since its yearly peak in April. This technical pattern, characterized by a series of lower highs but consistent lows, typically signals a bearish sentiment – suggesting that each rally is met with increasing selling pressure, keeping upward price movements in check.
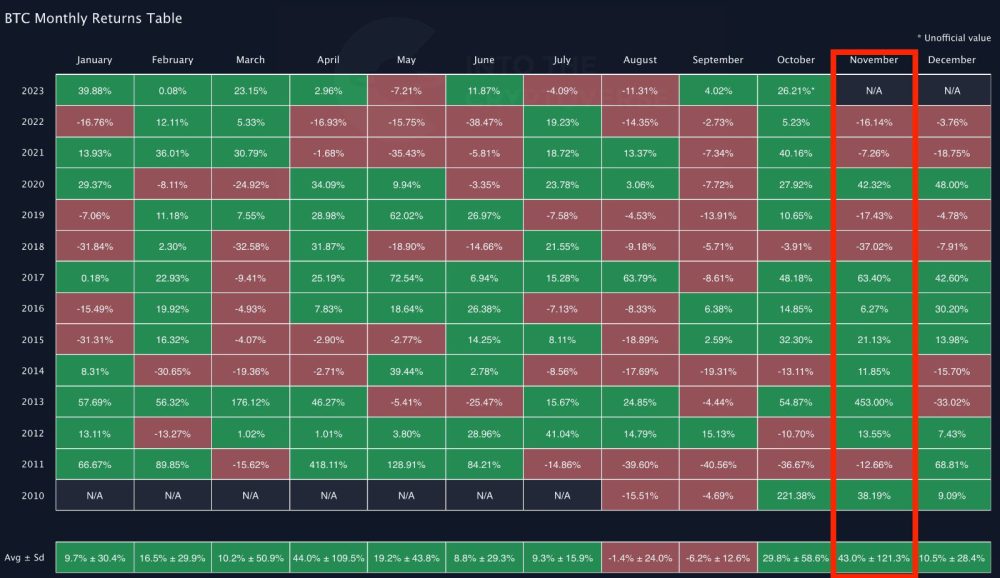
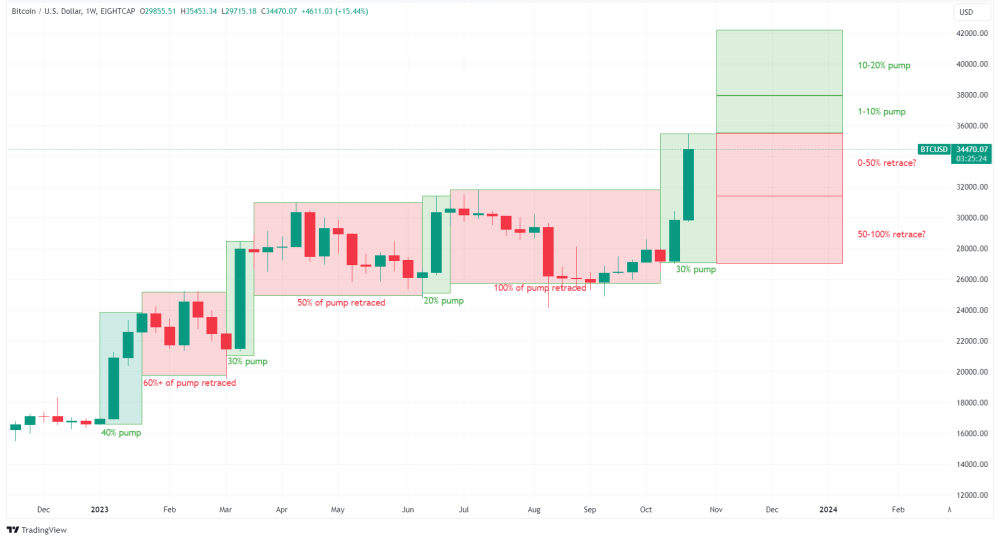
Related Reading: November Outlook For Bitcoin Price: Another Pump Or Retrace?
However, this past weekend marked a pivotal change. The market capitalization decisively broke through the pattern’s upper resistance line, surging by 7%. Such a breakout from a descending triangle is a bullish pattern, often indicating a reversal of the prior downtrend. With this breakout, the market cap is now eyeing the target set by the initial peak of the pattern, which could mean an additional increase of 7%.
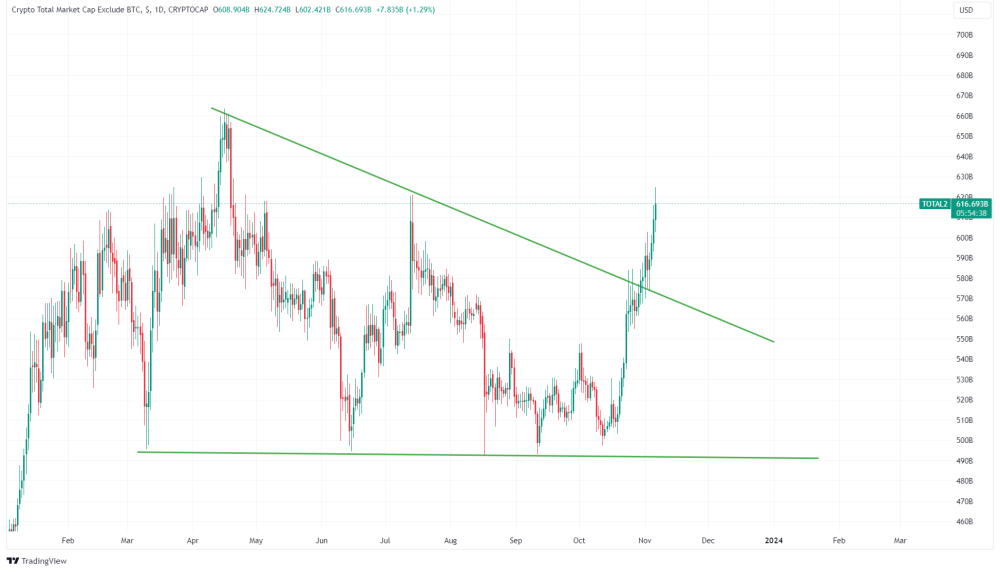
The significance of this breakout is further highlighted by the fact that the Altcoin market cap has not only broken through the resistance but also surpassed the previous high set in July. This breach could signal that the market is transitioning from a bear-dominated phase to a bullish one, where buyers are regaining control and pushing the market to new heights.
Bitcoin Decreasing Dominance
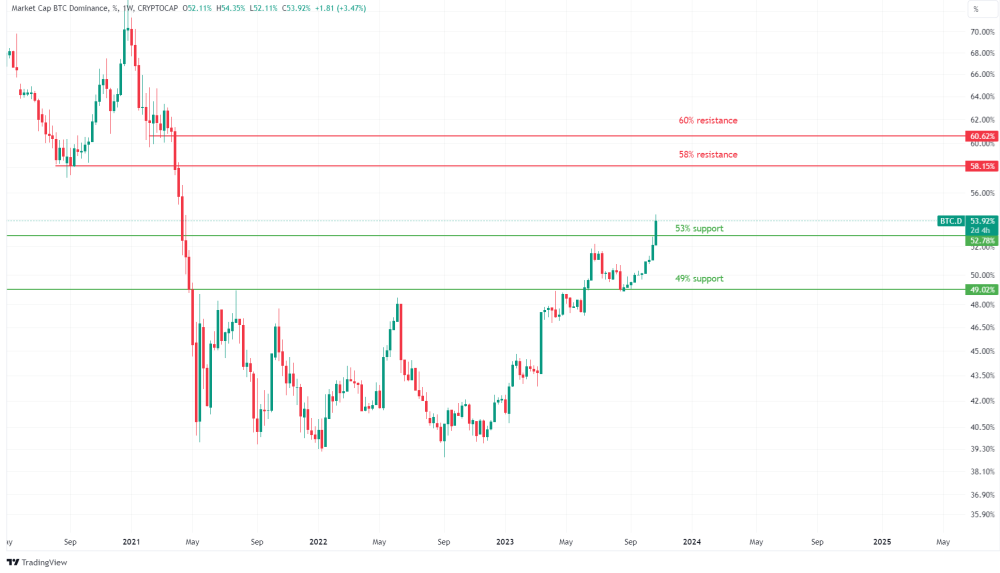
Bitcoin’s dominance on the market has recently slipped to 52.50%, down from its annual peak of 54%. This is a normal market fluctuation, considering Bitcoin had been on a ten-week streak of increasing dominance.
Related Reading: Bitcoin Season: Leading The Charge In The Crypto Market
Yet, it’s crucial to note that Bitcoin’s market share has dipped below the pivotal 53% support level. Should Bitcoin fail to reclaim dominance above this support level, we could anticipate a further decrease to the next support at 49%, opening the door for Altcoins to capture a greater portion of the cryptocurrency market cap.
In bear markets, Bitcoin’s dominance tends to increase as the market pulls back, which suggests that if Bitcoin manages to hold or increase its price, Altcoins could experience further rallies.
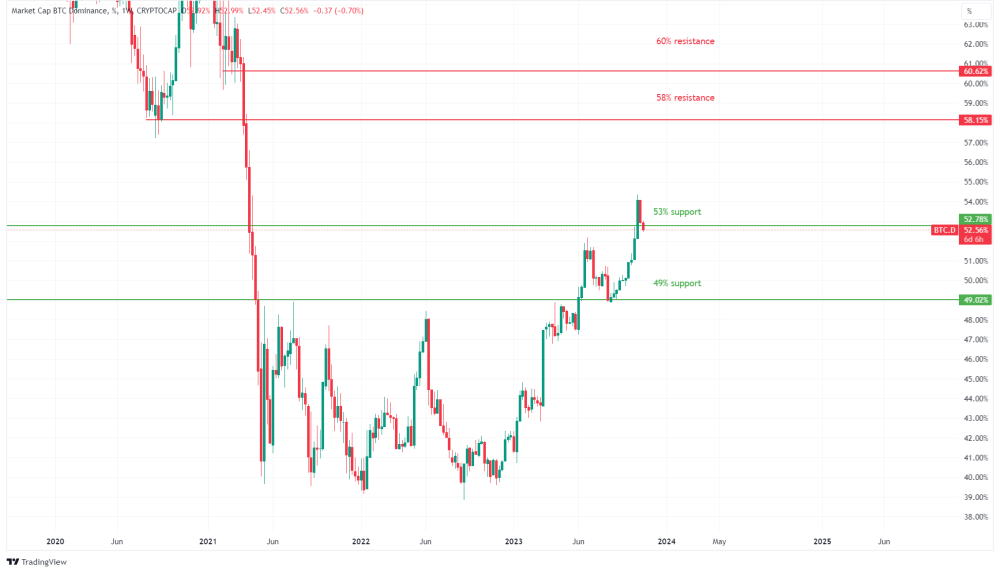
Conversely, an increase above the 53% support could set Bitcoin out for the next resistance at 58%, at the expense of Altcoins’ market share.
Historically, bull markets often begin with Bitcoin leading the way due to events like the halving event, which reduces the inflow of new Bitcoin.
Nonetheless, there are still phases when Altcoins rapidly gain momentum, experiencing significant and rapid price increases. The current market breakout, along with a reduction in Bitcoin’s dominance, hints that such a phase could potentially unfold now.
Top Altcoins Gains
In the past week, many Altcoins have witnessed remarkable gains. Here are the top performers:
- Pancake Swap: +95%
- Trust Wallet Token: +53%
- Neo: +48%
- MultiversX: +46%
- Blur: +45%
Predycto is the author of a cryptocurrency newsletter. Sign up for free. Follow @Predycto on Twitter.