Ethereum Whale Offloads Holdings Amidst Market Downturn

Ethereum (ETH) tumbled 6.45% in the past week, marking a rough stretch for the world’s second-largest cryptocurrency. Generally, Ether has left investors much to desire in recent times with a price decline of 16.57% over the last few months. Amidst this bearish market, a crypto whale has sold off all his Ethereum tokens drawing much attention from traders and market experts alike. 

ETH Whale Liquidates Holdings, Incurs Substantial Loss

In an X post on May 11, blockchain tracking platform Lookonchain reported that a crypto whale offloaded all its 6,714 ETH tokens at a market price of $19.5 million. While the profit looks quite massive, LookonChain states that the investor actually recorded a loss of $6.5 million based on the acquisition price of these tokens.

Generally, whale transactions gain much attention among investors as they are viewed as indicators of market trends. Thus, if a whale suddenly sells a large portion or all of their holdings it may be interpreted as a bearish signal prompting other investors to follow suit, resulting in a price dip.

However, that may not necessarily be the case with the ETH market following this recent whale sell-off. With the Bitcoin halving completed in April, the crypto bull run is expected to begin in the following months based on historical data. 

In previous times, Ethereum has proven as one of the most favorable assets for investors in this period. Notably, the altcoin gained by over 2000% in the months following the Bitcoin halving in 2020. Thus, most ETH investors are likely to hold on to their tokens. 

Aside from Ethereum, the whale also liquidated all its 428,047 Optimism (OP) and 901,685 Arbitrum (ARB) at a loss of $902, 000 and $1.08 million respectively. In total, they incurred a loss of $8.43 million in offloading their investments in the three prominent altcoins.

ETH Price Overview

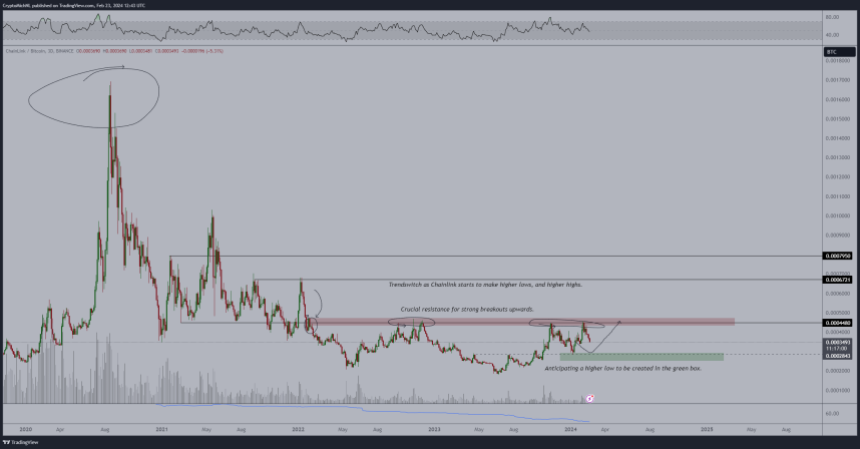
At the time of writing, ETH trades at $2,919 reflecting a slight price gain of 0.27% in the last day. The altcoin appears to be heading for the $,2940 resistance zone. With sufficient buying pressure, ETH could push through this region with the next resistance level set at the $3050 price zone. 

However, the altcoin’s daily trading volume has currently declined by 44.85% falling to a value of $6.71 billion. Ethereum, which ranks as a bigger altcoin remains 40.4% off its all-time high value of $4,891.70 achieved in November 2021z 

Ethereum

Why Bitcoin’s Post-Halving Rally Is Certain, Analyst Explains

Bitcoin experienced a price decline of 3.06% on Friday, falling as low as $60,372.36 based on data from CoinMarketCap. With the crypto market leader now in a consolidation phase, a trading analyst with X username Titan of Crypto has expressed resilient faith in Bitcoin’s ability to produce a post-halving price rally.

Bitcoin Rise Inevitable, Analyst Pinpoints $150,000 Price Target

In a series of X posts on Friday, Titan of Crypto shared some interesting bullish predictions on the Bitcoin market. Firstly, the analyst noted that amidst BTC’s price decline, the token’s price pattern on the daily timeframe had formed a bullish signal.

Titan of Crypto referred to this signal as the bullish engulfing candle which occurs when a larger bullish candle completely emerges from the previous smaller bearish candle, thus indicating a potential reversal from a downtrend to an uptrend.

Following these observations, the analyst also predicted Bitcoin to soon experience a massive post-halving price gain. Titan of Crypto described this forecast as “inevitable” citing data from Bitcoin’s price history.

The crypto analyst said: 

To understand the present you have to search in the past. And what the past is telling us is there is no occurrence of #BTC  not having a rally after the halving.

Titan of Crypto also acknowledged that short-term price movements may be “confusing” however he expects BTC to maintain an upward trajectory in the long room. Based on previous post-halving rallies, Titan of Crypto predicts Bitcoin to trade at $150,000 in 2025.

BTC Close To Bottom Price As Dip Buy Interest Drops

In other news, blockchain analytics website Santiment also predicts the recent downturn in Bitcoin’s price could soon end stating the token is near a “bottom” i.e. the lowest point in a market fall at which price stops falling and starts rising exponentially.

Interestingly, this prediction by Santiment is based on a decline in the dip-buying activity of Bitcoin investors. The analytics platform reports that the trading interest in Bitcoin following its most recent decline on Friday is far below levels associated with previous price falls.

At the time of writing, Bitcoin continues to trade around $60,968, with an overall price loss of 3.26% in the last week. On the monthly chart, the digital coin also remains in the red zone, reflecting a decline of $13.64%. However, Bitcoin’s daily trading volume remains positive by 9.73% and $27.88 billion. 

Bitcoin

Top Analyst Predicts Bitcoin To Reach $150,000 In 2025 – Here’s Why

In the last week, Bitcoin has shown much resilience bouncing back above the $60,000 zone after a significant decline to below the $57,000 price zone. As Bitcoin bulls gather momentum to possibly initiate the crypto bull run, top analyst and market expert Peter Brandt has backed BTC to attain a particular six-figure digit value by 2025.

No Other Market Like Bitcoin, Brandt Says

In a blog post on May 3, Peter Brandt shared some insights on Bitcoin in celebration of his 50th anniversary in future markets trading. The veteran analyst described his experience with the maiden cryptocurrency as a “once-in-a-lifetime trade, never to be equaled”.

Brandt states that Bitcoin is a unique asset in comparison to commodities such as gold, cattle, iron ore, copper,  and even other cryptocurrencies such as altcoins and meme coins. He claims that BTC owes this uniqueness to its operational nature as well as its price behavior.

Analyzing BTC price history, Brandt notes that the coin has repeatedly produced exponential gains in the past not seen with any other trading asset. And while these gains are followed by significant corrections, the overall price performance sets BTC apart from other assets. 

Another aspect of Bitcoin’s uniqueness as highlighted by Brandt is that the asset’s volatility is also evident in its downturns resulting in a decline of more than 50% and even 75%. Therefore, Bitcoin exerts a special ability to generate substantial profits while also causing significant losses.

Now, following BTC’s parabolic price nature, Brandt predicts the asset is on course to reach $150,000 by 2025. Interestingly, if the bulls maintain market control, the analyst believes Bitcoin could rise as high as $300,000 beyond 2026.

BTC Price Overview

At the time of writing, Bitcoin trades at $63,303 having encountered serious resistance in the $64,000 price zone. The maiden cryptocurrency currently looks to be in consolidation and could be preparing for another possible breakout. 

If Bitcoin embarks on a bull run, investors would be hoping for a return to its all-time high value of $73,750. However, in the advent of more selling pressure in the future, BTC could drop below $60,000 again. Nevertheless, Bitcoin remains the diamond of the crypto bull season with several analysts hyping the digital asset to trade above $100,000 within the next 12 to 15 months. 

BitcoinBTC trading at $63,405 on the daily chart | Source: BTCUSDT chart on Tradingview.com

Featured image from iStockphotos, chart from Tradingview

Injective (INJ) Price In Danger If It Falls To Crucial Support Level: Analyst

INJ, the native token of the Injective Network, commenced May with a fluctuating price action marked by a series of significant losses and gains. As INJ attempts to establish a stable price trajectory, popular market analyst with X handle Crypto Tony has highlighted a pivotal support zone for the altcoin in the coming weeks. 

INJ Must Not Fall Below $19.30 Level, Analyst Warns

In an X post on Friday, Crypto Tony shared a vital insight on the INJ market which could create a sentiment of caution among many traders. The renowned analyst stated that INJ must maintain a market price above the $19.30 price zone, warning that a dip below this support level could spell danger for investors.

While Crypto Tony did not say the extent of this danger, the possible loss seems to be likely massive as his statements implied the INJ bull traders could struggle to re-establish market control should the token’s price fall below the specified threshold. Furthermore, the analyst stated that early investors of INJ including himself would be immune to this potential downside. However, he still plans to pull out of the Injective market should the token lose its $19.30 support zone.

Currently, INJ trades around $24.70 reflecting a gain of 4.68% in the last day after a period of intense market volatility. The altcoin appears to be gathering momentum for a bullish trend following negative performances in recent weeks resulting in a decline of 24.07% in the last 30 days. 

What’s Next For Injective? 

With respect to a highly anticipated crypto bull run, INJ, which gained by over 3,000% in 2023, has been marked by several analysts as one potentially favorable altcoin for investment in the coming weeks.

Interestingly, these sentiments have been bolstered in recent weeks by a series of positive developments on the Injective network. For instance, Injective recorded 2.4 million transactions in a single day marking a new milestone in daily transactions for the Layer 1 network. 

In particular, the Injective 3.0 network upgrade has also been recently approved which is expected to tackle the inflationary problems of the INJ by decreasing the token’s minimum and maximum creation rate by 25% and 30%, respectively over the next two years on a uniform quarterly basis. 

Through these deflationary measures, it is expected that INJ would experience an increased scarcity which could, in turn, drive up the altcoin’s market value, thus contributing to a positive performance in the expected crypto bull run. However, investors are reminded that all cryptocurrencies are subject to varying levels of market volatility and are admonished to trade with all necessary caution.

InjectiveINJ trading at $24.66 on the daily chart | Source: INJUSDT chart on Tradingview.com

Optimism Soars By 17% Despite Recent Security Revelations

Optimism (OP) has grabbed investors’ attention in the last day following an intriguing positive price performance. Interestingly, OP’s market gain has occurred following a recent disclosure of certain security flaws associated with the popular layer-2 platform.

OP Bounces Back Amidst Optimism Security Concerns

On April 26, Offchain Labs, the initial developers of the prominent Ethereum L2 solution Arbitrum, highlighted certain security flaws found in the Optimism Stack fault-proof system. Via a blog post, the team at Offchain disclosed that they discovered two major systemic vulnerabilities in the newly released security program currently running on the Optimism testnet.

In communication with OP Labs, they stated that these security flaws could enable a bad actor to bypass the existing security measures of the Optimism network by enforcing the acceptance of a malicious claim or the rejection of a right claim. By exploiting these flaws, OffChain Labs stated these hackers could initiate a network dispute that is irresolvable.

The nature of these vulnerabilities is said to originate from the timers in the OP stack fault-proof system. If this program were introduced on the Optimism mainnet with such defects, users’ funds would be exposed to a “very high” level of risk. 

However, these vulnerabilities were revealed to OP Labs about a month ago, which has now updated the Optimism testnet to address these security flaws. Interestingly, following these revelations, OP’s price took a nosedive, falling by almost 5% to trade at $2.274 on April 27. However, in the last day, Investors expressed solid confidence in Optimism’s security and future sustainability.

According to data from CoinMarketCap, OP has gained by 17.16% in the past 24 hours attaining a market price of $2.69. In tandem, the token’s daily trading volume is up by 110.64% and is valued at $402.77 million.

Hold Your Altcoins, Analyst Says Why

In the week following the Bitcoin Halving event, popular crypto analyst Michaël van De Poppe has advised users to invest heavily in altcoins. Via an X post on April 27, van De Poppe stated that the catalyzing effect of the Halving and the introduction of spot ETFs on Bitcoin are likely over, with momentum now shifting to the altcoin market.

In comparison to BTC, the crypto analyst notes that most altcoins are undervalued and set for massive gains in the current bull cycle. Furthermore, van de Poppe predicted that the upcoming crypto bull run could last longer than the previous cycle, based on the current extended bear market.

Particularly, van de Poppe identified Optimism (OP) as a promising altcoin with the potential to achieve three times the market growth compared to Bitcoin in this bullish cycle. Additionally, the analyst highlighted other tokens, including Chainlink (LINK), Woo (WOO), Celestia (TIA), and Skale (SKL), as potentially profitable investments.

OptimismOP trading at $2.693 on the daily chart | Source: OPUSDT chart on Tradingview.com

Featured image from Moneycontrol, chart from Tradingview

Bitcoin Enters ‘Danger Zone’ Post-Halving, Analyst Warns Of Potential Downside

Following the halving event on April 19, the price of Bitcoin has displayed a puzzling performance. BTC initially gained nearly 10% to trade as high as $67,020 on April 24. However, in the last two days,  the digital asset’s price has declined by 6.49%, falling below the $63,000 price mark. 

As expected, such negative performance has drawn attention from investors and market speculators. In particular, renowned analyst with X handle Rekt Capital has provided a theory on Bitcoin’s price fall and perhaps an insight into the future price movements of the crypto market leader.

BTC Potential Price Decline Ahead?

In an X post on April 26, Rekt Capital stated that Bitcoin has now entered the Post-Halving “Danger Zone.” The analyst described this phenomenon as a period during which Bitcoin has historically experienced price corrections after the halving event. Rekt Capital noted that in 2016, Bitcoin recorded these price retraces in the three weeks following the Halving event. During this time, the token’s price declined by 11%. 

The analyst postulates that Bitcoin is now in the Post-Halving “Danger Zone” of the current bull cycle following its price fall over the last two days. It is worth stating that if Bitcoin mirrors past price movement in this phase, the token could be heading for $60,000. However, Rekt Capital states that if the crypto market leader experiences such a fate, it will be within the next two weeks. 

At the time of writing, Bitcoin trades around $62,672 with a decline of 2.44% in the last day. This price fall underscores BTC’s negative performance in the last month in which it has lost 11.16% of its market value. 

BitcoinBTC trades at $63,023 on the daily chart | Source: BTCUSD chart on Tradingview.com

Bitcoin ETFs Record Minor Inflow; Net Outflows Hit $217 Million

According to data from SoSoValue, the Bitcoin Spot ETF market recorded net outflows to the tune of $217 million on April 25. Unsurprisingly, Grayscale’s GBTC accounted for $138 million of these figures as its total outflows now approach $17 billion.

Notably, for the first time ever, Fidelity’s FBTC and Valkyrie’s BRRR  produced net outflows estimated at $22 million and $20 million, respectively. Meanwhile, ARK Invest’s ARKB and Bitwise’s BITB also experienced a loss in investment on Thursday.

Interestingly, all other Bitcoin Spot ETFs recorded zero net flows except Franklin Tempton’s EZBC, which saw a net inflow of $1.87 million. At the time of writing, the BTC spot ETFs have a combined value of $128 billion, reflecting a remarkable growth since their trading debut on January 11.

Bitcoin Tipped To Attain Six-Figure Value Following Fourth Halving – Details

With the Bitcoin halving event now completed, analysts and market experts turn their attention to a much-anticipated bull run based on historical trends in the BTC market. In particular, a crypto analyst with the X handle ecoinometrics has tipped the maiden cryptocurrency to at least achieve a six-figure in the current bull cycle.

How High Can Bitcoin Rise Post Halving? 

In an X post on Saturday, econometrics shared a strong bullish prediction of Bitcoin price following the fourth halving event on April 19. The crypto analyst stated that if  BTC produced a similar growth pattern seen in previous bull cycles, its market price would likely range between $140,000 – $4,500,000. 

For context, the bull run, which forms the latter part of the Bitcoin bull cycle, occurs in the months following the halving event, according to BTC’s price history. During this period, the market leader is known to record massive price gains, as seen after previous halvings in 2012 (7,592.30%), 2016 (1,818.8%), and 2020.

Econometrics stated that a repeat of such positive performance could see Bitcoin trade as high as $ 4,500,000 per unit. However, other speculators have attacked this prediction, believing BTC will likely soon experience some level of diminishing returns. Thus, such a high price level seems unfeasible.

In response, econometrics stated that Bitcoin currently operates similarly to “megacap tech stocks”, which have shown notable defiance to this economic theory. However, the analyst acknowledged that $4,500,000 may be an unrealistic price target for BTC, but there is much confidence that the digital asset will achieve a mid-six-figure value.

Bitcoin Price Overview

Bitcoin is currently trading at $65,043, with a modest 2.21% gain over the last 24 hours. However, its daily trading volume has declined massively, falling by 52.88% to a substantial $21.62 billion, underscoring decreased market activity and investor interest. 

Over the past week, Bitcoin has also shown fair improvement resulting in a total gain of 1.86%. However, despite these recent gains, the monthly chart reflects a decline of 4.16%, following some significant price dips and massive liquidations in the past week. 

On a larger scale, Bitcoin remains quite impressive, with its year-to-date growth percentage of 131.69%. With a market cap value of  $1.28 trillion, the premier cryptocurrency remains the largest digital asset in the world.

BitcoinBTC trading at $65,270.47 on the daily chart | Source: BTCUSDT chart on Tradingiew.com

Featured image from iStock, chart from Tradingview

Analyst Predicts Cardano (ADA) To Rally By 75% As MVRV Ratio Plummets

In recent weeks, ADA, the native token of the Cardano network. has drawn much speculation due to a rather turbulent price performance resulting in a decline of 18.77% in the past month. This negative price movement is similar to the majority of the cryptocurrency market following unprecedented massive dips in the price of Bitcoin. 

However, despite ADA’s troubles, popular crypto analyst Ali Martinez is backing the coin to pull off a remarkable rebound. Interestingly, Martinez’s prediction comes as the digital asset attempts to find its feet, gaining by 9.92% in the last day, according to data from CoinMarketCap.

ADA Tipped To Hit $0.80, Record Yearly High

In a post on X on April 19, Ali Martinez shared that ADA may soon record an impressive price surge. Martinez predicted the tenth largest cryptocurrency could soon record a 75% gain due to its MVRV Ratio being lower than -22%.

For context, the Market Value to Realized Value (MVRV) ratio is a metric used in crypto technical analysis to assess the valuation of a digital asset relative to its realized value. It is basically used to know if a token is overvalued or undervalued based on its market price compared to the average cost basis of its holders.


An MVRV ratio of -22% indicates that the market value of ADA  is significantly less than its realized value. However, Ali Martinez notes the last time the coin was this undervalued was in June 2023, after which it rose by 75% in the next month. 

Based on such historical price data, the crypto analyst predicts ADA could replicate a similar performance over the next few weeks, attaining a market price of $0.80, which would represent its highest value in the last year. At the time of writing, ADA trades at $0.46, with a 2.43% gain in the last hour. In a similar fashion, the token’s daily volume is up by 43.07% and $595.30 million.

Cardano Launches New Era Of Decentralized Governance 

In other news, the Cardano network is set to commence a new era in decentralized governance, according to an announcement by the CEO of the Cardano Foundation, Frederick Gregaard. In an X post on April 18, Gregaard stated the full constitution for this change in government “is on the horizon,” with an interim constitution now going into effect.

According to the Cardano Foundation boss, the interim constitution emphasizes core network values such as transparency, openness, and responsible decision-making. It aims to grant each ADA holder an influence in determining the future of the Cardano ecosystem via an inclusive government in which all stakeholders are privileged to certain rights and responsibilities as listed in the constitution. 

Bitcoin Drops As Iran Launches Missile Attack On Israel – What We Know So Far

The price of Bitcoin took a nose dive on Saturday following reports of Iran launching missile and drone attacks on Israel. Alongside the market leader, many other prominent cryptocurrencies also experienced a significant selloff as news of a brewing international conflict in the Middle East circulated on the internet.

Bitcoin Suffers Major Decline For Second Consecutive Day

According to multiple reports on April 13, Iran commenced a drone attack against Israel in retaliation to an attack on an Iranian diplomatic building in Syria on April 1 which claimed the lives of nine Iranian officers, including a highly ranked general in Iran’s Islamic Revolutionary Guards.

This incident marked Iran’s first-ever direct assault on the Jewish state following years of rising political tensions between both countries. With the Iranian forces confirming further missile attacks on “specific targets” in Israel, it is likely that both nations may be heading for a full-scale war.

Following reports of the drone attacks in the Middle East, Bitcoin’s price dropped by 8.07%, falling from $67,132.1 to $61,710.58, reflecting a high selling pressure. Interestingly, this price action marked the second consecutive day the maiden cryptocurrency suffered a significant loss following a 5% decline on Friday amidst minor turbulence in the US stock markets.

Generally, Bitcoin has shown an underwhelming performance in the past weeks, recording a 12.51% loss in the last month based on data from CoinMarketCap. The maiden cryptocurrency has struggled to replicate its bullish form seen at the beginning of 2024 when it achieved a new all time high price of $73,750.07. However, with the Halving event fast approaching, BTC investors are likely optimistic about a potentially massive price gain in the coming months based on historical price data. 

Currently, Bitcoin trades at $63,943, showing a 3.61% gain from its earlier slump on Saturday. In tandem, the token’s daily trading volume is up by 22.46% and valued at $57.37 billion.

Altcoins Not Spared From Market Crash

Alongside Bitcoin, the price of altcoins also decreased significantly due to the escalated geopolitical tension in the Middle East. Ethereum, the most popular altcoin and second largest cryptocurrency, suffered a loss of 10.89%, falling as low as $2,880.16

Meanwhile, other prominent tokens such as Solana (SOL), XRP, and Avalanche (AVAX) also recorded price dips to the tune of 12.68%,18.11%, and 16.00%, respectively. Generally, the total crypto market cap declined by 7.78%, falling to around $2.2 trillion.

Bitcoin, Altcoins Price Decline As Crypto Liquidations Near $900 Million In The Past Day

The crypto market took an unexpected hit on April 12 as a spontaneous decline in the price of Bitcoin and prominent altcoins resulted in massive liquidations. The origin of this widespread price dip remains largely unknown, among a plethora of plausible reasons, including a recent price correction in the US stock markets.

Almost $500 Million Liquidated In An Hour Amidst Crypto Flash Crash

According to data from CoinMarketCap, Bitcoin slipped by 4.49% in the last day, falling as low as $66,052. As expected, BTC’s decline reverberated through the market, with prominent altcoins Ethereum and Solana recording daily losses to the tune of 8.12% and 12.16%, respectively

As earlier stated, these losses translated into 277,843 traders losing their leverage positions as total crypto liquidations reached $877.21 million in the last 24 hours based on data from Coinglass. Of these figures, long positions accounted for $782.98 million, with short traders losing only $94.24 million.

Notably, $467 million in leverage positions were closed within an hour as a result of a general price decline. The highest amount of liquidations at $369.85 million was recorded on Binance, while the single largest liquidation order valued at $7.19 million occurred in the ETH-USD market on the OKX exchange.

Bitcoin
Source: Coinglass

Interestingly, Bitcoin’s price decline correlated with a dip in the US stock market as the S&P 500 index declined by 1.6% to trade as low as $5,108. This market crash was preceded by recent CPI data, which showed that the inflation rate rose to 3.5% year over year in March.

Such reports only indicate that the US Federal Reserve (Fed) could not be implementing any rate cuts soon as it aims to force inflation down to its annual target of 2%. This prediction is quite bearish for the crypto market generally as Fed rate cuts allow investors to comfortably seek risky assets such as BTC with a potential of high yields.

Bitcoin Experiences Network Growth As Halving Approaches 

On a more positive note, Bitcoin has recorded a rise in non-empty wallets on its network ahead of the Halving event on April 19. Blockchain analytics platform Santiment reported an increase of 370,000 BTC wallets holding active coins over the last six days. Interestingly, the analytic team is backing investors to maintain this accumulative trend all through the Bitcoin halving event.

At the time of writing, Bitcoin was trading at $66,882, with a 44.80% increase in its daily trading volume, which is currently valued at $43.80 billion. However, Bitcoin’s price has generally been unimpressive in recent times, with a decline of 1.33% and 6.20% in the last seven and 30 days, respectively. 

BitcoinBitcoin trading at $66,499.00 on the daily chart | Source: BTCUSDT chart on Tradingview.com

Featured image from The Independent, chart from Tradingview

Genesis Acquires Over 32,000 BTC After Offloading GBTC Shares

Embattled crypto lender Genesis Global Capital has continued to ramp up efforts to pay up creditors after filing for bankruptcy protection in January 2023. As part of these efforts, Genesis has now reportedly sold off the entirety of its Grayscale GBTC holdings to acquire a substantial amount of Bitcoin in order to implement its repayment strategy. 

Genesis Converts GBTC Shares To Bitcoin In Preparation For Debt Settlement

According to a Friday report by Bloomberg Law, Genesis finalized the sale of its 36 million GBTC shares, as revealed by the company’s lawyers in a court filing on April 2. Genesis had initially received legal approval to liquidate its GBTC holdings on February 2 with each unit share valued at $38.50. However, court documents showed that the current price of GBTC as at the time of sale on April 2 was $58.50 resulting in a total sale price of $2.1 billion. 

Bloomberg’s report disclosed that the bankrupt crypto lender then used these proceeds to purchase 32,041 Bitcoin at a market price of $65,685, which will be distributed to creditors as part of its repayment plan, especially those who were previously enrolled in the Gemini Earn program. 

These recent transactions align with Genesis’s bankruptcy plan which allows the conversion of GBTC shares to either Bitcoin or direct cash for the settlement of its existing debt. Currently, the crypto lender owes $3.5 billion to creditors and will commence repayment following court approval. 

However, Genesis faces fierce opposition from its parent company, Digital Currency Group (DCG), over its proposed repayment plan. In a petition filed in February, DCG argues that its bankrupt subsidiary looks to settle creditors’ claims at amounts higher than their respective entitlement. 

DCG believes such a repayment strategy violates the Bankruptcy Code and is “unfair” since it will only benefit senior creditors who will largely gain from an appreciation in Genesis’s crypto assets value while equity holders and company stakeholders are left in unfavorable positions.

Founded in 2013, Genesis is one of the prominent crypto firms to file for bankruptcy. Its insolvency is largely linked to the sudden collapse of the defunct crypto exchange FTX.

Bitcoin Price Overview

In other news, Bitcoin gained by 2.55% in the last day to reach a price of $69,339. Such price gain would be encouraging to investors especially following the token’s overall negative performance in the past week. On higher timeframes, BTC largely remains largely bullish as anticipation continues to build ahead of the halving event on April 19.  The fourth halving in Bitcoin’s history is expected to reduce the mining reward from 6.25 BTC to 3.125 BTC.

GenesisBTC trading at $69,314 on the daily chart | Source: BTCUSDT chart on Tradingview.com

Bitcoin Whales Maintain Positive Accumulation Behavior Ahead Of 2024 Halving: Report

Bitcoin began 2024 with a blast gaining by over 73% in the first quarter of the year to establish a new all-time high price of $73,750. And although BTC soon declined from this value following a turbulent price movement in the last month, its biggest stakeholders have shown a consistent accumulation trend throughout the first three months of 2024, indicating a high confidence in the asset’s profitability ahead of the upcoming halving event. 

Bitcoin Whales Acquire $21.6 Billion BTC, Boost Market Dominance By 1.4% As Halving Nears

In an X post on Friday, blockchain analytics platform Santiment shared that Bitcoin whales are still maintaining the “right direction” in regard to their accumulation pattern. Santiment reported that these whales, which represent holders of 100-100,000 BTC, purchased a total of 319,310 BTC (valued at $21.6 billion) in the last three months. 

This report also stated that a significant portion of the newly acquired tokens came from retail traders, i.e., holders of 0-100 BTC, who collectively offloaded 105,260 BTC, valued at $7.2 billion and 0.7% of BTC’s circulating supply, within the same time frame.

In general, BTC whales increased their market share by 1.4% in the last three months, which is interpreted as a rather positive sign ahead of the highly anticipated Bitcoin halving on April 19. For context, the Bitcoin halving, which occurs every four years, is a network-programmed event during which the amount of miners’ rewards on the Bitcoin blockchain is reduced by half. 

Generally, the Bitcoin halving is regarded as a positive event that results in asset scarcity, thus driving up demand and market price in the long term. This notion may just remain true as Santiment describes the increased accumulation by BTC whales heading into the final weeks before the next halving as a bullish signal, indicating high confidence in the asset’s future valuation.

BTC Price Overview 

According to data from CoinMarketCap, Bitcoin currently trades at $67,521, reflecting a decline of 0.01% and 3.51% in the last day and seven days, respectively. In tandem, the daily trading volume of the digital coin is also down by 6.80% and valued at $32.35 million.

However, BTC is up by 6.43% on its monthly chart adding to an impressive year-to-date increase of 140.65%. With a market cap of $1.33 trillion, the maiden cryptocurrency remains the largest digital asset in the world. 

BitcoinBTC trading at $67,504 on the daily chart | Source: BTCUSDT chart on Tradingview.com

Analyst: Avalanche (AVAX) In ‘Healthy’ Retreat, Potential Rebound Lies Ahead

AVAX, the native token of the Avalanche protocol, presented a mixed experience for investors in the month of March. The altcoin initially rose by over 64% to trade above $65 for the first time since May 2022 before declining by 18.44% in the last two weeks. 

Unsurprisingly, AVAX’s price movement has drawn much attention from investors and market experts alike. Notably, a popular crypto analyst with the X handle Rekt Capital has advised against panic, stating the recent decline of the altcoin could prove to be rather beneficial for investors.

AVAX To Return To $65-$70 Price Zone, Analyst Stands Confident

In a post on X on March 30, Rekt Capital shared that AVAX has suffered an overall decline since encountering the $65-$70 price zone in mid-March. However, the analyst has described this price drop as a “healthy dip,” which could result in the token returning to previously high levels.

Currently, AVAX trades in the range of $52-$54, but Rekt Capital predicts the altcoin is heading to the region of $44-$49, which represents its highest price points recorded in December 2023. On entering this price zone, Rekt Capital expects the token to find support and embark on an uptrend back to the $65-$70 region. 

However, in the presence of overwhelming bearish pressure, the analyst technical analysis revealed that AVAX could drop further to around $32.66, indicating a potential price decline of 39.62% and 49.9% from the coin’s current price and its peak price in March, respectively 

Avalanche (AVAX) Price Overview 

At the time of writing, AVAX trades around $53.50 with no significant price movement in the last day, while recording a 0.51% decline over the past week based on data from CoinMarketCap. Meanwhile, the crypto asset’s trading volume is down by 16.62% and valued at $370.86 million. 

However, AVAX has generally been one of best best-performing assets in the last six months boasting a market gain of 471.35% within this period. Notably, in December 2023, the altcoin rose by about 150% to move from $20.41 to a monthly high of $49.98.

Off the market, AVAX has also scored some positive strides. Most recently, the Avalanche network announced a collaboration with fellow blockchain Chainlink and the prestigious Australia and New Zealand Banking Group (ANZ) targeted at exploring the use of crypto assets in global financial settlement systems. The use of AVAX in such a project would largely amplify the token’s adoption, which would elicit a positive effect on its market price.

AVAXAVAX trading at $53.30 on the daily chart | Source: AVAXUSDT chart on Tradingview.com

Featured image from Zipmex, chart from Tradingview

Bitwise CEO Predicts $11 Billion Drop In Bitcoin Supply Post Halving

Over the last week, Bitcoin (BTC)  investors enjoyed much profit as the crypto asset gained 9.34% to trade above $71,000 based on data from CoinMarketCap. Currently, most of the BTC market is highly expectant of the potential large price gains that the current bull cycle could present. 

However, commenting on the immediate future, Bitwise CEO Hunter Horsley has stated that the upcoming halving event – a key part of the bull cycle – could be the most significant in Bitcoin’s trading history as a result of an impending massive decline in the token’s supply.

Bitcoin Price To Impact Supply Reduction And Token Demand – Bitwise CEO

In a post on X on March 29, Hunter Horsley shared that the Bitcoin Halving event slated for April 2024 could have the most profound supply and demand effects recorded ever in the asset’s history. For context, Bitcoin halving is a phenomenon that occurs every four years in which the block reward for BTC miners is reduced by half.

Horsley began his prediction by referencing the last Halving in 2020, during which BTC’s price was ~$9,000. The Bitwise CEO stated that Bitcoin experienced a significant decline in token supply following the Halving effect, to the tune of ~$9 million per day and ~ $3 billion per year.

Considering that Bitcoin’s price currently hovers around $70,000, Horsley believes that the expected supply reduction will likely be at least three times larger in dollars and is estimated to be $32 million per day and $11 billion. 

With a higher Bitcoin price, Horsley predicts that the expected massive decline in Bitcoin’s supply will be accompanied by a greater decrease in natural selling pressure by miners. In addition, the Bitwise CEO notes this development will concise with the current rise in institutional demand.

Generally, all factors highlighted by Hunter Horsley indicate that Bitcoin will likely experience a magnanimous price surge following the Halving event. Earlier in February, the Bitwise boss predicted BTC could attain $250,000 sooner as a result of investor demand driven by the introduction of the Bitcoin spot ETF.

BTC Price Overview

At the time of writing, BTC is exchanging hands at $70,000 with a 0.65% loss on the last day. The widely acclaimed “digital gold” is up now by 10.45% on its monthly chart  following the price correction in February,

Meanwhile, the BTC’s trading volume has declined by 23.16% and is valued at $24.67 billion. With a market of $1.1 trillion, Bitcoin ranks as the largest cryptocurrency in the world.


BTC trading at $69960 on the hourly chart | Source: BTCUSDT chart on Tradingview.com

Featured image from Forbes, chart from Tradingview

Incoming MATIC Surge: Analyst Predicts $15 Price Target

Digital asset analyst with X handle Crypto Patel has recently shared a bullish prediction on MATIC price movement in the coming weeks. This forecast comes amidst MATIC’s poor performance in the last seven days, during which it lost 6.68% of its market value, based on data from CoinMarketCap. 

The Polygon native token had been one of the best-performing assets in 2024 rising by over 76.38% between January to March. However, the altcoin has now recorded a 22.83% decline over the last two weeks, drawing much concern over its future price movement. 

$1.20 Price Level Critical For MATIC Price Surge, Analyst Says

In a post on X on March 23, Crypto Patel presented a bullish case for MATIC despite the token’s current downtrend, naming the forecast the “MATIC BULL RUN ROADMAP.”

Firstly, the analyst stated that a MATIC bullish pennant was being formed. For context, the bullish pennant represents a price pattern that typically follows a string of upward movement in price (the flagpole) followed by a period of consolidation (pennant).

A bullish pennant is characterized by converging trendlines, which indicates the continuation of the previous uptrend once the price breaks out of consolidation. Importantly, Crypto Patel emphasized that MATIC’s bullish pennant was being formed on a higher time frame (HTF), such as the weekly chart. 

Following historical trends, the complete formation of the bullish pennant could result in Polygon native asset experiencing a 100x price increase in the highly anticipated crypto bull run, as observed in 2021.

However, with a focus on short-term targets, Crypto Patel has stated that MATIC reaching the $1.20 price zone on the HTF could trigger a surge to a range of $10-$15, representing a potential 1500% gain on the asset’s current price.  Albeit, in the advent of an unexpected crash, the crypto analyst expects MATIC could be significantly affected but should find support around the $0.60-$0.70 price zone. 

MATIC Price Overview

At the time of writing, MATIC trades around $0.9817 with a 1.30% gain in the last 24 hours. Meanwhile, the token’s daily trading volume has declined by 31.82% and is valued at $291.65 million. With a market cap value of $9.7 billion, MATIC is ranked the 16th largest cryptocurrency and one of the world’s most prominent digital assets.

MATICMATIC trading at $0.9771 on the daily chart | Source: MATICUSDT chart on Tradingview.com

Bitcoin ETF Netflows May Experience Rebound If This Price Is Attained, Analyst Explains

In line with the decline in Bitcoin’s price, the spot Bitcoin ETF market has appeared rather gloomy in recent days. According to data from analytics firm BitMEX Research, these BTC ETFs have recorded a negative netflow for the last four trading sessions. 

This situation has been marked by large levels of Grayscale’s GBTC outflows and the record low inflows for the other ETFs, mainly the market leaders BlackRock’s IBIT and Fidelity’s FBTC. However, amidst these persistent declining netflows, Ki Young Ju, a prominent analyst and Chief Executive Officer at Cryptoquant, has predicted a possible resurgence in the spot Bitcoin ETF market.

Analyst Pinpoints $56,000 Level As Critical To Bitcoin ETF Recovery

In a post on X on March 22, Ki Young Ju shared that a rise in spot Bitcoin ETFs netflows could occur even as the BTC price decline continues. Using data from the historical netflow trends, the analyst noted that demand for Bitcoin ETFs usually kicks in when the cryptocurrency traces to certain support levels. 

Young Ju stated that, in particular, new BTC whales, especially ETF buyers, have shown to have a $56,000 on-chain cost basis. This suggests that the new significant holders of Bitcoin, particularly those invested in ETFs, usually purchased Bitcoin at an average price of $56,000.  Following this trend, the crypto quant boss believes the spot Bitcoin ETF market could experience massive inflows if BTC reached the specified price level.

For now, Bitcoin’s price has oscillated between $62,000 and $68,000, as seen in the last week. However, Young Ju believes that such a descent is quite feasible as price corrections usually see a maximum decline of 30%. Using BTC’s most recent high of $73,750, the analyst predicts the asset price could still trade as low as $51,000. 

BTC Price Overview

At press time, Bitcoin continues to trade at $64,065.74, representing a decline of 3.73% and 7.17% in the last one and seven days. Meanwhile, the asset’s daily trading volume is down 3.53% and valued at $39.62 billion. 

Following historical trends of the bull cycle, it is possible that BTC may have reached its price peak leading up to the halving event in April. If that is the case, Bitcoin may likely not return to previous high price levels soon and could experience further price drops in the coming weeks.  

Bitcoin

Introducing Book Of Meme (BOME), The Latest $1 Billion Crypto Sensation

Memecoin project Book of Meme (BOME) has emerged as the latest shining star in the crypto market over the last few days. Following its official launch this week, BOME has attracted much investor interest, acquiring a market cap of $1 billion within 48 hours of trading.

BOME’s sudden emergence can be regarded as a silver lining in the crypto space in the last week amidst Bitcoin’s 4% decline, which resulted in the maiden cryptocurrency falling to around $65,345.14. Meanwhile, Ethereum is also down by 10%, while prominent memecoins Dogecoin and Shiba Inu also recorded losses to the tune of 24.23% and 16.69% over the last seven days. 

What Is The Book Of Meme?

The Book of Meme was founded by DarkFarms, the creator of another popular memecoin Pepecoin. BOME functions as an experimental project aimed at incorporating memes, decentralized storage solutions, degen shitcoin trading, and gambling on a single platform in a bid to create a novel web3 experience. 

Following a successful presale that raised 10,131 SOL, BOME debuted in the crypto market on March 14 with an initial price of $0.0000496. Over the next two days, Book of Meme swiftly rose to a price region of $0.012 while achieving a market cap value of $1 billion. 

Unsurprisingly, BOME’s expeditious rise has earned the coin listings on major crypto platforms, including KuCoin, Gate.io, MEXC, HTX, Crypto.com and Binance. In particular, BOME’s listing on Binance on March 16 is believed to have spurred the token to a 243% price gain within a day, allowing the memecoin to gain a peak market cap of $1.55 billion. 

In a similar fashion with other highly successful memecoins, some investors have benefitted the most from BOME’s rise. Data from LookonChain reveals that a certain investor already sold all 347 million BOME for 34,647 SOL valued at $6.58 million, recording a 340x gain on 102 ($19,000) investment at the presale. Meanwhile, the largest BOME holding personal address known as sundayfunday.sol currently holds 1.242 billion BOME, valued at $29.8 million. 

BOME Price Overview

At the time of writing, Book of Meme currently trades at $0.02139 with a 58.08% gain on the last day. Meanwhile, the coin’s daily trading volume is up by 125.05% and is valued at $5.18 billion. BOME’s current market cap stands at $1.18 billion, allowing the memecoin to rank as the 85th largest cryptocurrency. 

Analyst Expects Bitcoin Price Correction To Persist, Targets $57,000 Support

Bitcoin (BTC) has drawn much attention in the last few weeks, with a stunning price surge leading to a new all-time high of $73,750. Largely defined as the pre-halving rally, BTC’s bolstering gains have been followed by significant price correction, with the crypto market leader trading as low as $65,630 on March 15. 

While the cryptocurrency may have picked up some minor gains in the last 12 hours as it attempts a market recovery, popular analyst Michaël van de Poppe has released a disturbing prediction that indicates Bitcoin price correction may be far from over.

Related Reading: Behind The Scenes Of Shiba Inu 12% Plunge: What On-Chain Analysis Tells Us

Bitcoin May Have Peaked Pre-Halving, Analyst Says

In a Friday post on X, van de Poppe shared a market forecast that Bitcoin could fall as low as $57,000, thus prolonging its current correction phase. The analyst began by highlighting that BTC still retained a valid bearish divergence which occurs when the price of an asset forms higher highs while the corresponding indicator forms lower highs. It usually indicates that the driving force behind a certain trend is attenuated with a reversal now on the horizon.

In the case of Bitcoin, the bearish divergence indicates the coin’s recent rally may be exhausted and is now likely to produce major negative price movements. Van de Poppe stated this theory was confirmed by BTC’s latest rejection at the $70,000 zone during its attempted market rebound. 

The prominent crypto analyst predicts Bitcoin to soon resume its price correction, falling to a price range of $57,000 to $61,000. If these speculations prove true, it could also indicate that in similar fashion, the BTC market may attain its highest value prior to the Bitcoin halving. 

For context, the Bitcoin Halving is historically preceded by a price rally followed by a significant price retrace ranging from 20% to 40%. With the next Halving event set for April 2024, van de Poppe believes that further retracement by Bitcoin could stamp the end of the pre-halving rally.

BTC Price Overview

According to data from CoinMarketCap, Bitcoin is currently trading at $69,027 with a 0.17% and 1.26% in the last hour and day, respectively. In tandem, the token’s daily trading volume is up by 1.20% and is valued at $69.58 million.

BitcoinBTC trading at $69,259 on the weekly chart | Source: BTCUSD chart on Tradingview.com

Analyst Forecasts $40 Target For Chainlink (LINK)

Chainlink (LINK) continues to remain among the headlines following a negative performance, which saw the token’s price decline by 7.63% in the last week based on data from CoinMarketCap. However, despite this discouraging price loss, investors and market experts appear to remain bullish on the altcoin. For instance, popular crypto analyst Michaël van de Poppe has recently released a price prediction that states LINK could double its market price in the coming months.

Chainlink (LINK) Poised To Notch 122% Gains, Analyst Says

In a Friday post on X, Michaël van de Poppe presented a bullish case for Chainlink using the LINK/BTC 3-day chart. The analyst began his prediction by noting LINK’s positive stint in the first two weeks of February, during which the token rose by 32.77% to trade above the $20 price mark.

However, despite this impressive price gain, the prominent altcoin failed to breach a crucial resistance zone at 0.00480 BTC, thus failing to initiate a breakout. Following this event, van de Poppe believes that Chainlink is now seeking a higher low to serve as its support level.  For context, a higher low In technical analysis refers to a pattern on a price chart in which a successive low point in a trend is higher than the previous low point. It is usually interpreted as a bullish signal indicating a potential trend reversal or continuation of an upward trend.Chainlink

After successfully finding its higher low, van de Poppe anticipates LINK to experience a price reversal, gaining by 4,500 satoshis, which is currently valued at $2.29 at the current Bitcoin price of $50,761. Thus, Chainlink could soon return above the $20 mark. Furthermore, the analyst believes this price gain could lead to LINK finally initiating a breakout, hitting a price in the range of $30-$40 within the next few months. If this prediction proves true, the altcoin could experience a potential maximum gain of 122.71% on its present market price.

LINK Price Overview

At press time, Chainlink continues to exchange hands at $17.96 with a 0.11% gain in the last day. Meanwhile, the token’s daily trading volume has experienced a slight decline of 0.70% and is now valued at $426.65 million. Based on market shares, Chainlink is ranked as the 12th largest cryptocurrency with a total market cap value of $10.55 billion.

Chainlink

LINK trading at $17.944 on the daily chart | Source: LINKUSDT chart on Tradingview.com

Filecoin (FIL) Notches 10% Gain Following Integration With Solana

Filecoin (FIL) continues to enjoy investors’ interest following a 10.28% gain in the last day, according to data from CoinMarketCap. The altcoin has recently been the center of attention following a gradual price rise in the past week culminating in a 15.34% price gain. Interestingly, the spike in FIL’s price over the 24 hours appears to be fueled by exciting developments in the project’s ecosystem.

Filecoin Meets Solana

In an X post on February 16, Filecoin announced an integration with the popular Ethereum rival, Solana. Launched in March 2020, Solana is regarded as one of the most prominent smart contract-compatible platforms offering fast transactions and almost non-existent fees.

Ranked as the fifth-largest crypto project with a market cap value of $47.97 billion, Solana’s integration with Filecoin is aimed at migrating from its widely criticized centralized storage system to decentralized storage solutions, with the aim of improving its existing scalability and integrity. 

Through this integration, Filecoin’s network will assist Solana in enhancing access to its blockchain history, which will be beneficial to developers, explorers, indexers, and other network users. In addition, Filecoin’s decentralized storage solutions will allow Solana to experience data redundancy, scalability, and a higher level of security while operating as a decentralized network. 

Interestingly, this development created much excitement in the Filecoin user community as FIL surged by over 10%, reaching a value of $6.36. Meanwhile, FIL’s daily trading volume stands at $497.78 million, having recorded an astounding 178.42% gain.

FIL Price Prediction

FIL began 2024 on a turbulent note losing about 40% of its value between January 1 and January 23. However, in the last few weeks, the token has experienced a steady price recovery which is further aided by its most recent boost in price.

If the bulls are able to sustain the current buying momentum, FIL may hit the $8 price mark representing a return to the levels seen at the start of 2024. However, according to the token’s daily chart, the relative strength index has now crossed into the overbought zone. This indicates that there might be an incoming trend reversal. In that case, FIL’s price may fall as low as $4.90, which represents its next support level and a 23.71% decline from the current market price. 

FilecoinFilecoin (FIL) trading at $6.341 on the daily chart | Source: FILUSDT chart on Tradingview.com