Bitcoin Weekly RSI Reaches Line Between Bear & Bull Market

Bitcoin price continues to push higher, leaving very few pullback opportunities thus far for those that failed to buy below $20,000.

Price action on BTCUSD the weekly timeframe, according to the Relative Strength Index, has reached a critical line that separates bear market from bull market. Any higher, and crypto could experience a full blown breakout. Let’s take a look.

What The Relative Strength Tells Us About Cryptocurrencies

The Relative Strength Index is a popular technical indicator used in cryptocurrencies, originally created by J. Welles Wilder in the 1970s.

The tool measures momentum through the “velocity and magnitude of price movements,” according to Wikipedia. Readings above 70 can indicate overbought conditions, and falling below 30 suggests an oversold market.

In rare instances, the RSI will remain overheated depicting an especially powerful trend. Most of the time it remains somewhere between 30 and 70 while prices consolidate or move sideways.

On higher timeframes, moving past the middle-zone on the RSI can send lower timeframes through the roof — or through the floor.

In the case of BTCUSD weekly charts, the RSI suggests this exact line in the sand is currently separating what could be a full breakout into a bull market – or a harsh rejection.

Bitcoin BTC RSI

Breaching this level on the RSI led to bullish rallies | BTCUSD on TradingView.com

Bitcoin Reaches Critical Line In The Sand Between Bear & Bull Market

Looking back throughout the history of Bitcoin, pushing above roughly 55-56 on the RSI has in the past led to extraordinarily bullish moves. Falling below it lead to the the deadliest declines and bear markets.

Even worse, as BTCUSD weekly finds itself at the key trigger level, rejection has resulted in some brutal moves. In 2014 a rejection from there kicked off the second phase of the bear market. In 2015, a bull market attempt was harshly rejected back to bear market lows.

The latest instance in 2020 a bull market was rejected and combined with the onset of COVID, resulted in the Black Thursday collapse. Considering the importance of the level and the fact some of the worst rejections ever have taken place when the RSI reached such a reading, it is no surprise investors remain skeptical and cautious.

If Bitcoin can make it above the current zone on the Relative Strength Index, the bull market could be back on in a flash. Currently, BTCUSD daily charts show a wildly elevated RSI, well into overbought conditions. However, extended phases of daily RSI levels support bull market behavior, and could indicate that the weekly RSI and further higher timeframes might also approach overbought levels at some point in the future.

Overbought Or Ready To Rip? Bitcoin Daily RSI Reaches Explosive Levels

Bitcoin price is showing signs of getting overheated on daily timeframes using the Relative Strength Index (RSI). The tool, typically used to spot overbought conditions, is at one of its highest levels ever historically.

However, an elevated RSI reading in BTCUSD is deceiving, leading to some of the most dramatic moves ever on the cryptocurrency’s price chart. Here is a closer look at what happens when Bitcoin price action gets this hot.

Bitcoin RSI Reaches Highest Level Since Early 2021

After breaching above $20,000, onlookers are wondering if a possible bottom is in for Bitcoin, but remain skeptical after such a long, arduous downtrend.

Bears have good reason to expect a pullback: Bitcoin has become extremely overbought according to the Relative Strength Index. In fact, the top cryptocurrency is more overbought than at any other point during the entire bear trend.

Bulls, on the other hand, could be ready to push prices higher. In the past, the RSI has only reached such an elevated level – a reading of 90 or above – during the most intense bullish movements of recent years.

BTCUSD_2023-01-18_14-13-23

Why Crypto Could Be Ready To Rip Higher Once Again

Bearish investors and traders might be quick to claim that this time is different, considering the Fed raising interest rates, the backdrop of war and recession, and more. But bulls have much more data on their side, and momentum at their backs.

In fact, bulls have the entire history of BTCUSD price action to prove that the Relative Strength Index reaching such highs have led to the greatest sustained gains in crypto.

BTCUSD_2023-01-18_14-22-35

Bull markets are characterized by recurring phases of extreme RSI readings. Bull markets also end at such extremes, but typically only after at least a series of three waves. Bear market peaks, throughout the entire lifetime of BTCUSD price action, always fail to reach such highly elevated RSI.

The Relative Strength Index was created by developed by J. Welles Wilder – who also developed the Parabolic SAR, Average Directional Index, and Average True. The technical tool measures the speed of the change of price movements.

Although readings above 70 and below 30 typically represent overbought or oversold conditions, a reading of 90 only occurs with an extremely fast and strong move. Such fast and strong moves tend to appear more often in a bull market than a bear market.

Cryptocurrencies can remain notoriously overbought during periods of FOMO. Is that exactly what we’ve seen in Bitcoin recently? And will the number one cryptocurrency by market cap rip higher, or ultimately see a rejection here due to such overbought conditions?

Why A Morning Star Reversal Could Awaken A Monster Bitcoin Rally

Bitcoin price is already turning heads after reclaiming $20,000 per coin, but if the current monthly candle closes on BTCUSD price charts, the top cryptocurrency will satisfy the conditions of a morning star reversal pattern. 

The last time the signal occurred at the bottom of a major downtrend, Bitcoin began a two-year-long bull run in cryptocurrencies and went on to climb more than 6,000% after the morning star confirmed.

Bitcoin Reclaims $20,000: A Wake Up Call For The Bull Market

Bitcoin is once again above $20,000, but a lot has changed since 2020 when it passed the key level for the first time. The number one cryptocurrency by market cap has declined by 78%, and altcoins have dramatically collapsed by as much as 99%. 

But markets are cyclical, and some signs are beginning to point to the end of a bearish phase in crypto and the possibility of a new bull trend blossoming. Top analysts are starting to wake up and take notice, and are now calling for a bottom and a cyclical low. 

Reaching above $21,000 has put BTCUSD above pre-FTX crash levels from two months prior. More importantly, the three-month period has resulted in a three-candlestick reversal pattern called a morning star. 

The morning star reversal pattern is a bullish Japanese candlestick reversal pattern, than when confirmed should result in three to five months worth of follow-through. A substantial shift from bearish to bullish would return Bitcoin to its previously bullish state.

A morning star reversal pattern has formed | BTCUSD on TradingView.com

What A Morning Star Reversal Could Mean For Crypto

According to Investopedia, “a morning star is a visual pattern made up of a tall black candlestick,” a black or white doji, “and a third tall white candlestick.” “The middle candle of the morning star captures a moment of market indecision where the bears begin to give way to bulls. The third candle confirms the reversal and can mark a new uptrend,” an excerpt reads.

Analysts and traders should look toward technical indicators to confirm the signal.  For example, the Fisher Transform is crossing bullish from extreme negative deviations, and could help provide confirmation of extended upside to follow. 

Historically, the Fisher Transform turning up combined with a 20% monthly bullish candle was enough to end each bear market in the past. The most direct comparison, took place in 2015, when another morning star reversal pattern helped trigger a new bull trend. 

In that instance, BTCUSD went on to climb by 6,000% in 24 months — after the signal appeared. Confirmation requires this month’s candle to engulf at least 50% of the black, November down candle. The more this month engulfs the November candle, the stronger the signal. Currently, the entire candle has been engulfed. 

Bitcoin Price Touches $20,000 For First Time Post-FTX Collapse

Bitcoin price has tapped $20,000 for the first time since the FTX. Not only was the level important support that broke down during the contagion, but it was also the former 2017 all-time high.

Here’s what the recent price move could mean for the cryptocurrency market.

Bitcoin Reaches Key Level And 2017 ATH

At approximately 6PM ET, Bitcoin price touched $20,000. Losing the level put stress on long-term holders by sending the price per coin tumbling to $15,800 and far below the former 2017 bull market peak.

After being rejected in 2017, cryptocurrencies fell into a long bear market. It wasn’t until December 2020 when Bitcoin once again made it above the critical level. And when it did, it blasted right through it to $60,000.

Once Bitcoin has reclaimed the level, what happens next?

bitcoin

BTCUSD Levels To Watch For Next 

Considering how bearish the sentiment was throughout 2022, crypto holders aren’t yet ready to FOMO into Bitcoin simply due to a break of $20,000. The top cryptocurrency may need to rally higher before the crowd begins to pile in.

Bitcoin above $28,000 could be a sign of a more sustainable recovery. Meanwhile, rejection at $20,000 again could be catastrophic for the crypto market and cause BTC to try for new lows.

Peter L. Brandt Claims Bitcoin Is Putting In Its Cycle Low “Now”

Career commodities trader Peter L. Brandt is now claiming that Bitcoin is putting in a “low for this cycle now,” according to a new TradingView post.

This call for a bear market bottom is already being met with skepticism, but given the chilling accuracy at which Brandt had made related to his cryptocurrency bets in the past, there could be more validity than investors are ready to accept.

Peter L. Brandt TradingView Post Calls For Cycle Low In BTC

In a new TradingView post currently trending on the charting platform’s editor’s picks section, career commodities trader Peter L. Brandt says that the cycle lows for the crypto market are taking place “now.”

Although Brandt doesn’t directly state that the bottom is already in, he does believe that Bitcoin’s behavior is “predictable” and should see a strong advance after the recent, nearly 80% decline.

Brandt famously called for an 80% decline in BTCUSD in late January 2018 after the 2017 parabolic advance was violated. Back then, Brandt called it a “general TA rule, eventually nailing his sub-$4,000 target some eleven months later in December of the same year.

Peter l brandt bitcoin

What The Career Trader Expects For Bitcoin In 2023 And Beyond

“I do not expect Bitcoin to run away to the upside, but rather work higher toward late 2023/early to mid 2024 when the ATHs are retested,” he explained, sharing the chart above to justify the analysis.

The Factor LLCCEO is a classical chartist, and in his TradingView post shares a 6-month timeframe bar chart. Other visual cues aiding his analysis include the largest sell volume ever on the BTCUSD index chart.

Peter L. Brandt has earned himself a polarizing reputation in the cryptocurrency community. The comments section is already taking jabs at the trader with 40 years experience.

According to the CMT Association, Brandt founded Factor LLC in 1980, but entered the commodities trading business beginning in 1976 with ContiCommodity Services.

He is also published author, releasing the book “Diary of a Professional Commodity Trader: Lessons from 21 Weeks of Real Trading” in 2011 – the same year he was named one of the 30 most influential persons in the world of finance by Barry Ritholtz.

Today, Brandt is one of the contributing analysts at Bitcoin.live along with Bob Loukas and other well-known traders.

“Parabolic” Signal That Triggered Past Bitcoin Bull Runs Reappears

Bitcoin price made a 5% move today, poking above $19,000 momentarily. It is currently the largest daily climb of 2023 and since the FTX collapse. 

More significantly, the sharp rally tagged a level that triggered a possible trend change according to the weekly Parabolic SAR. In the past, the technical indicator has lived up to its name. What could it mean this time?

Bitcoin Makes Biggest Move Of 2023

The start of 2023 has been positive for altcoins. But up until today, Bitcoin has been mild by comparison. 

Following today’s CPI data release coming in at 6.5% and Biden’s victory lap on inflation, Bitcoin price soared by $1,000, taking the top cryptocurrency above $19,000 briefly. 

More importantly than what happened today, was what occurred on the weekly timeframe. BTCUSDT (Binance) weekly tagged the Parabolic SAR for the first time since May 2022. The LUNA collapse pulled Bitcoin and other cryptocurrencies lower, beginning the second, more aggressive phase of the recent downtrend. 

The same Parabolic SAR signal was also triggered prior to the 2019 crypto rally, and the 2020 to 2021 bull run (pictured below). Both rallies also blossomed from the same exact trend line previously.

BTCUST Bitcoin price

BTCUSDT Weekly Triggers Parabolic SAR Buy Signal 

The Parabolic SAR is a technical indicator designed by J. Wells Wilder, Jr. and is used to detect changes in trend direction. The tool consists of a visual overlay of SAR dots that hover above or below price action, determining the direction of the trend. 

When the SAR dots are tagged, it suggests that a trend might “stop and reverse” — which is precisely what SAR stands for. Therefore, it’s especially effective in timing entire and exits. Because the SAR dots travel higher or lower alongside the trend, they can be used reliably to set trailing stop losses. 

On weekly timeframes, BTCUSDT (Binance) touched the Parabolic SAR, essentially telling short traders to get out of the position. If bears had used the PSAR for trailing stop losses, they’ve now been stopped out — purposely — in profit.  

While the signal isn’t a guarantee of continued upside, considering that the possible signal of a trend change has appeared alongside the coincidental timing of a long-term trend line touch, the recovery from this level could be more sustainable than many are ready for.

Currency Expert Explains Why Altcoins Experience More Carnage Than Bitcoin And Ethereum

As the current bear market in crypto continues to deepen, Bitcoin has fallen by 78%, and Ethereum by 82%. Yet elsewhere in the crypto market, many altcoins are down by as much as 96% or more

In a recent video, Elliott Wave International Currency & Crypto Analyst Jason Soni sheds some light on why this occurs and what this could mean for various cryptocurrencies. 

Breaking Down Why Some Crypto Assets Crash More Than Others

Bitcoin price has retraced by more than 78% from all-time highs set back in 2021. Ethereum, the second-largest cryptocurrency by market cap, saw an approximately 82% retracement from peak to trough thus far. 

As you move down the ranks of cryptocurrencies, the total drawdown figures deepen. Cardano, for example, suffered a 92% collapse compared to the top two cryptocurrencies. Solana, once pegged to disrupt Ethereum, dropped by a staggering 96%

In a new video entitled “Looking at Opportunities for the Next Crypto Bull Market,” Elliott Wave International Currency & Crypto Analyst Jason Soni touches on why – theoretically – this discrepancy exists. 

According to Soni, newer altcoins in their first cycle will see the deepest retracement. As cryptocurrencies mature, and go through more boom and bust cycles, retracements are less steep, like we’ve seen with Bitcoin and Ethereum. 

Ethereum versus ADA

Bitcoin Sets The Standard For Bear Market Corrections

In the video, Jason Soni used a comparison between many newer altcoins today following a similar trajectory and total drawdown as 2018 Ethereum. With each new cycle, new participants join and liquidity in each asset increases, reducing volatility over time and resulting in less and less in terms of max drawdown.

This is perhaps the most visible with Bitcoin. Following Bitcoin’s first major bull market, the first ever crypto asset retraced by 96%. In the second bear market ever in crypto, BTC retraced by 86%. During the 2018 bear market, Bitcoin sank by a grand total of 84%. A softer landing yet might still be possible during this bear market.

Considering the severity of the drawdowns in most cryptocurrencies and the extreme negative sentiment, it could mean that the end of the bear market is near. At this point, Soni recommends avoiding “social media sentiment” at all costs and says to instead “focus on the patterns.” 

The video, “Looking at Opportunities for the Next Crypto Bull Market,” is offered  exclusively through Elliott Wave International’s Crypto Trader’s Classroom, which delivers three new in-depth lessons each week from top Elliott Wave analysts. Many instructional videos include specific crypto charts and trading setups, using Elliott Wave Theory. You can learn more about Elliott Wave International’s Crypto Trader’s Classroom by clicking here

Bitcoin Santa Claus Rally: How Often Does The Christmas Miracle Occur In Crypto?

With Christmas almost here, hopes for a Santa Claus rally in Bitcoin and the rest of crypto are fading fast. But what exactly is the phenomenon, and how often has the Christmas miracle occurred in the past?

What’s A Santa Claus Rally? The Most-Wished For Gift By Bitcoin Bulls

A Santa Claus rally is defined as a “calendar effect” that occurs right around the holidays. According to Investopedia, there’s some slight disagreement over the exact timing of a Santa Claus rally. One camp claims its the lead up to Christmas where stock holders get an early present, while the other side states its the post-Christmas week leading into January 2nd.

The idea behind the rally is the same: investors are suddenly euphoric due to the joyfulness of the holiday season, are considering year-end tax-related repositioning, and often have fresh Christmas bonuses to spend. The low-volume and liquidity holiday market conditions allow prices to move more swiftly, like Dasher, Dancer, Prancer, and Vixen through the snowy night sky.

Investopedia further concludes that there isn’t much validity to the idea behind the Santa Claus rally when analyzing S&P 500 returns during this period. But what about Bitcoin and crypto, where retail investors dominate the market and trade 24/7 – even on Christmas Day?

BTCUSD_2022-12-22_10-10-55

The Scrooge Effect: Bears Say Bah Humbug To Possible Crypto Rally

The above chart depicts the crypto version of the Santa Claus rally, taking into consideration both the weeks before and after the annual holiday.

At only a mere few cents, a breakout Christmas rally sustained until Bitcoin reached $40 for the first time. In 2011, December price action was more red than green.

The next Santa Claus rally kept delivering gifts for crypto holders for nearly an entire year, until December 2013 struck and one of the worst downtrends on record followed all the way through until December 2014. Bitcoin reached its final bear market bottom back then only days away from Christmas.

The following two Christmases in 2015 and 2016 were merry and bright for Bitcoin bulls. But December 2017 euphoria around Christmas-time turned out to be the top, resulting in yet another bear market.

In 2018, we’ve marked December in blue as the most neutral of all holiday price action. Although Bitcoin had fallen prior, it had already bottomed, and in the months following began a new bull run. It’s tough to call this price action bullish or bearish.

Much like the bull market in 2015 and 2016 saw back to back green seasons, so did crypto investors in December 2019 and December 2020. In fact, December 2020 gave BTC a new all-time high – the first since December 2017. More all-time highs were made in 2021, but by December, it was back to a brutal downtrend for crypto.

Here we are one year later, and the chart above does give us some clues about what might happen next. During the two largest bear markets, Bitcoin suffered from Scrooge-like behavior in the crypto industry two Decembers in a row. While we dubbed the second December in the second bear market neutral, it also wasn’t bullish by any stretch.

Considering this pattern, this December has a cyclical rhythm that could suggest yet another lump of coal for investors this year. However, when looking at the data alone, there’s roughly a 50/50 chance that this holiday season is something to celebrate across crypto.

Could A Litecoin Fractal Foretell A New Bull Trend In Crypto?

The cryptocurrency market continues to feel the darkness of crypto winter, but it could be Litecoin bringing the blossom of a new bull trend, according to a an eerily similar fractal found in LTCUSD daily price charts. 

The fractal pattern developed following the most recent pullback, and appears to have a similar structure to a major bull market breakout. Could this be the light at the end of the tunnel for cryptocurrencies?

Hawkish Fed Dims Litecoin Rally, But A Fractal Gives Hope

After a stellar month leading the market with 40% returns for November, Litecoin has given back nearly half of that thus far in December. 

LTC had been on a tear, outperforming top coins like Bitcoin and Ethereum, and clawed its way closer toward making it back into the top ten cryptocurrencies ranked by market cap. 

But the greater market pullback stemming from a hawkish Fed meeting this month, caused a failure to liftoff in Litecoin.  

However, the discovery of a price action fractal in LTCUSD could suggest this recent pullback wasn’t necessarily a failure, but a refueling of sorts — before taking off in an even stronger rally. 

2022-12-20 17.33.24

Comparing Price Action Then Vs Now: Will Bulls Get A Break?

The fractal begins on Black Thursday in March 2020 — a black swan event few saw coming. Litecoin rebounded and the fractal formed. 

Unlike Bitcoin, which made a lower low during the FTX, LTCUSD hasn’t, and instead has followed the same pattern from 2020 almost flawlessly. 

Price following the fractal further could lead to some minor continued downside, but ultimately holds at resistance turned support. If the current pullback proves to be a retest and holds, a more obvious rally could materialize.

Failure would almost certainly send Litecoin back toward 2018 lows and potentially beyond, making the fractal among one of Litecoin bulls’ best hope for a redemption rally.

Importantly, a concurrent reversal taking place in the LTCBTC and LTCETH trading pairs appear to indicate strength in the altcoin relative to the top two crypto assets. However, there is no telling what this might mean for the overall market at this time.

Bitcoin Bear Market Monthly Momentum Reaches Worst On Record

For many Bitcoin investors who lived it, this crypto winter feels more painful than the 2018 bear market, despite making a shallower fall from peak to through. From a monthly momentum perspective, the bearish trend is now the strongest on record. Let’s take a look at what this means and where the market is at by comparison.

Log MACD Points To Worst Crypto Winter In History

As a speculative asset class, cryptocurrencies are volatile – wildly driven by speculation and polar opposite ends of greed and fear. There is no denying the current market is some of the most fearful since Bitcoin’s inception. It was born in wake of the 2008 financial crisis and the top cryptocurrency is now facing its first potential recession.

Previous monetary policy allowed the asset class to flourish and grow, while the current policy has caused prices to contract significantly in short order. The result, is quite possibly the worst bear market in Bitcoin’s history, according to the LMACD.

BTCUSD_2022-12-19_14-43-19

LMACD is the logarithmic version of the Moving Average Convergence Divergence indicator. The original tool was created by Gerald Appel in the late 1970s, while this version is best used to compare historical momentum.

When viewing the monthly LMACD for BTCUSD, the dashed zero line shows that in 2018, Bitcoin never even made it into bear territory. During this bear market, the MACD line in blue is also at the lowest point ever historically. The signal line in orange has never moved below the zero line, and could very well do so in this cycle.

Has The Bitcoin Bull Trend Officially Ended?

According to the Average Directional Index and each Direction Movement Indicator, bears are stronger than ever before, and have had the upper hand in crypto for the longest stretch ever.

Falling below a reading of 20 suggests the end of a trend, potentially indicating that the trend that started in 2015 is only now truly concluding. Rising back above a reading of 20 after falling below it, should help confirm a new bullish trend.

BTCUSD_2022-12-19_14-53-08

Although the ADX shows the bull trend never quite concluded in 2018, the weaker trend strength overall explains why the returns stemming from the 2018 bottom, weren’t anywhere near the same as the rally from the 2015 bottom, which had significant strength at its back.

With the bullish trend fizzling out, when bulls regain control and a new trend blossoms, it could be far more sustainable than what we have witnessed the last several years in crypto.

Bitcoin Volatility Explodes Around $18K Level, As Fed Reveals 50 Basis Point Rate Increase

Bitcoin price touched a high of nearly $18,400 in anticipation of today’s Federal Reserve meeting, where the US central bank was expected to raise interest rates by 50 basis points.

Volatility picked up as the Fed meeting commenced, with Bitcoin suffering a sudden pullback to $17,700. Here’s what you need to know about the last Fed meeting of the year. 

No Pivot: Fed Hikes Rates 50 Basis Points

All eyes were on today’s Fed meeting and if Fed Chair Jerome Powell would follow through and soften interest rate hikes from the previously aggressive 75-basis points, to a more tolerable 50-basis points increase. 

Although Powell’s speech was the most dovish in nearly twelve months of meetings, the end result was still an increase in rates, with no true pivot in sight.  What this means for risk assets like crypto or the stock market, remains to be seen. 

BTCUSDT_2022-12-14_15-52-03

Bitcoin Pulls Back Promptly As FOMC Meeting Begins

November CPI data came in lower than expected yesterday, prompting Bitcoin to front run today’s Fed meeting slightly. 

In the hours leading up to the meeting. Bitcoin climbed to close to $18,400 at the daily high. The moment the meeting began the top brass cryptocurrency by market cap plunged by $700 in one five-minute candle. 

The move could have been investors in slight profit selling the news, or potentially a shakeout ahead of a larger breakout.

Bitcoin has been entrenched in an arduous downtrend for more than a year and counting and sellers could also be taking an opportunity to exit at each sign of a rally. 

Bitcoin will need to reclaim today’s high of $18,400 and push through the $20,000 range before considering a potential bottom in the crypto market. 

A slightly softer Fed stance is certainly a good sign. 

Bitcoin Price Prediction: What Elliott Wave Theory Suggests Is Next For BTC

Any Bitcoin price prediction is just a guess without a basis to make the forecast. The stock-to-flow model that was once the most cited reason for expectations of higher prices has failed, leaving technical analysis, on-chain signals, and statistics as the best chance of finding future price targets.

Elliott Wave Theory is a technical analysis forecasting methodology discovered in the 1930s, which is based on identifying extremes in investor psychology combined with distinctive price behavior. With Bitcoin and other cryptocurrencies being so susceptible to the ebb and flow of investor sentiment, here is what Elliott Wave Theory suggests about what is to come for Bitcoin price.

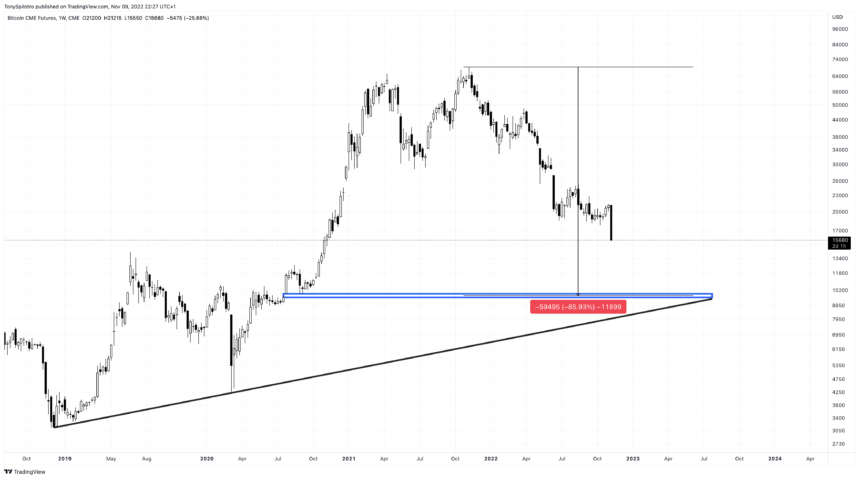
A Brief History Of BTC Price Action

The Bitcoin price index chart begins in late 2010, with the first-ever cryptocurrency trading at only pennies on the dollar. By the end of 2011, the price per BTC grew by more than 60,000%. Before the year came to a close, it has lost 94% of its value.

From the low of approximately $2, another bullish impulse added yet another 60,000% ROI by the 2013 peak. Yet another steep corrective phase followed, cutting the cryptocurrency down by 86%.

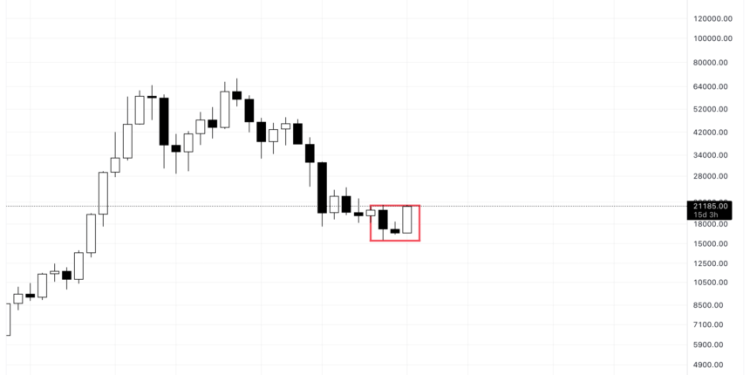
What followed was arguably the most talked about bull run since the dot com bubble, when in 2017 Bitcoin reached nearly $20,000 per coin. By now, we can see that extreme price swings and pivots in investors sentiment lead to boom and bust cycles across crypto. Bitcoin once again found a bottom at $3,000 in 2018, which will be the basis of the remainder of the analysis.

BTCUSD_2022-12-08_12-06-50

The first wave ever and the history of Bitcoin price | Source: BTCUSD on TradingView.com

An Introduction To Elliott Wave Theory

First discovered by Ralph Nelson Elliott in the 1930s, Elliott Wave Theory is a basis for explaining how markets grow over time. The motive wave in EWT is an example of markets moving three steps forward, and two steps back.

These steps alternate back and forth between growth and corrective phases. Motive waves consist of five waves in total – with odd numbered waves moving in the direction of the primary trend, and even numbered waves moving against it.

Although corrective phases do result in a drastic decline in value, incremental growth always remains in the primary trend direction. Waves, both impulsive and corrective both appear in varying degrees and timescales.

For example, a five-wave impulse on the daily timeframe could only be a tiny portion of a multi-century Grand Supercycle. Figuring out where Bitcoin is along in its various wave cycles and degrees can help to predict future price action.

BTCUSD_2022-12-08_12-05-12

Bitcoin price prediction scenarios based on possible wave counts | Source: BTCUSD on TradingView.com

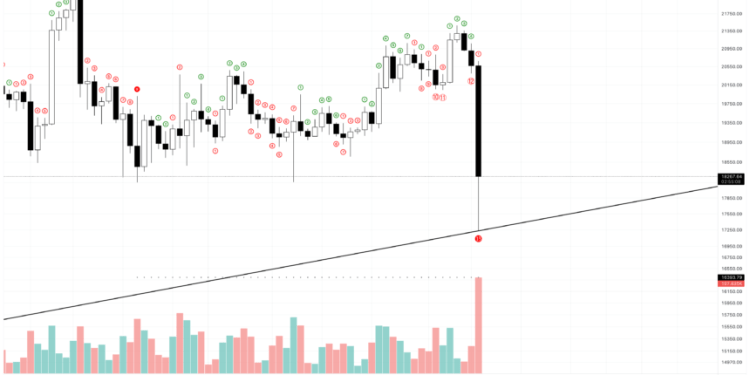
Reviewing The Current Market Cycle, According To EWT

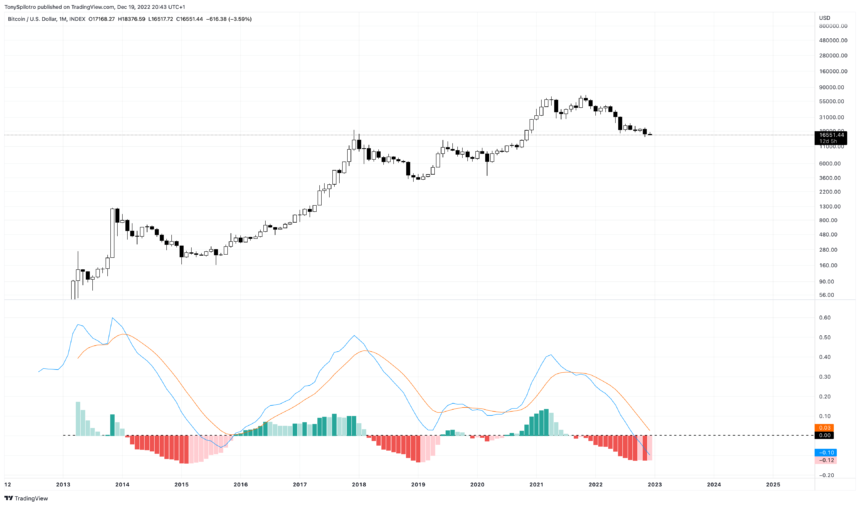
Each wave in an impulse has unique characteristics which can help an analysis decipher where an asset is in an overall motive wave. Following the 2018 bear market bottom, crypto had a clean slate to move up from. In 2019, Bitcoin rallied to $13,800, showing the market there was still life in the speculative asset.

Nearly the entire rally retraced, which is a common characteristic of a wave 2 correction. Corrections tend to alternate between sharp and flat-style corrections. Sharp corrections are represented by zig-zags. Wave 2 behaved like a zig-zag and there is no denying that the March 2020 Black Thursday collapse was a sharp correction.

Wave 3 in Elliott Wave is typically the longest and strongest wave, marked by much wider participation than wave 1. The crowd begins piling at this point. Bitcoin gained national media attention as it reached new all-times during this wave. From there, things get more confusing.

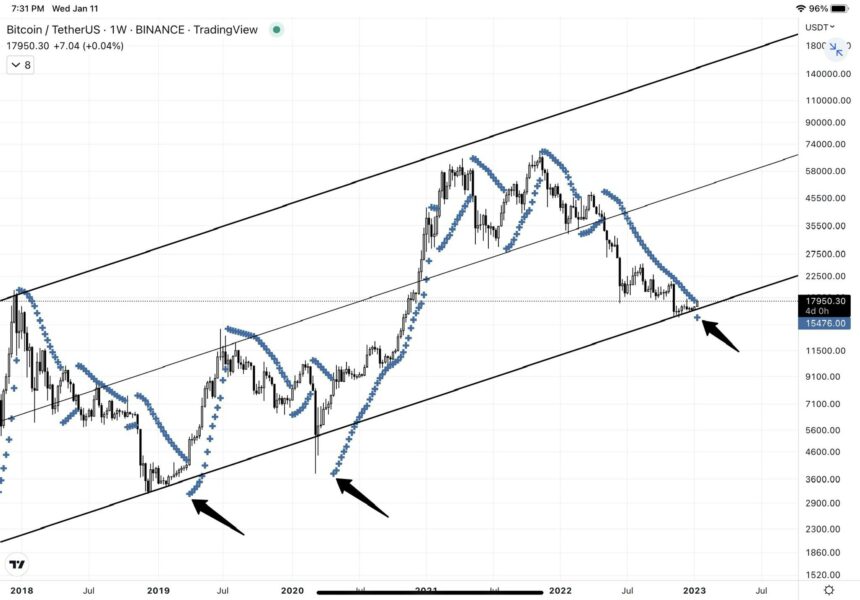
Elliott Wave practitioners are divided among if BTCUSD completed its wave 4 and wave 5 phases already, or if wave 4 is still in progress and wave 5 is yet to come. Using these two scenarios, some targets can be considered.

BTCUSD_2022-12-08_12-00-34

Things could get extremely bearish for Bitcoin if the cycle has ended | Source: BTCUSD on TradingView.com

The Bearish And Bullish Scenarios And Targets

In the bearish scenario, a truncated wave 5 ended the Bitcoin bull run and sent the crypto market into its first true bear phase, with wave 5 of V finished and done, ending the primary cycle (pictured above).

Completed bull markets often retrace back into wave 3/4 territory when the motive wave is completed. Bearish price targets put the negative Bitcoin price prediction from anywhere between $9,000 to as low as $2,000 in a complete collapse of the market. A larger catastrophe in the stock market and housing could ultimately do the trick by pulling whatever capital that’s left out of crypto.

The bullish scenario is much more positive, and better fits with what Elliott Wave Theory calls “the right look” and proper counting. In the bullish scenario, Bitcoin is in the final stages of an expanded flat correction, and once the sentiment and price extremes are finished, the top cryptocurrency will be fast off to setting another bullish price extreme and sentiment switch, much faster than anyone is prepared for.

BTCUSD_2022-12-08_11-58-00

BTC appears to be in the final stages of an expanded flat wave 4 correction | Source: BTCUSD on TradingView.com

Using EWT To Make A Bitcoin Price Prediction

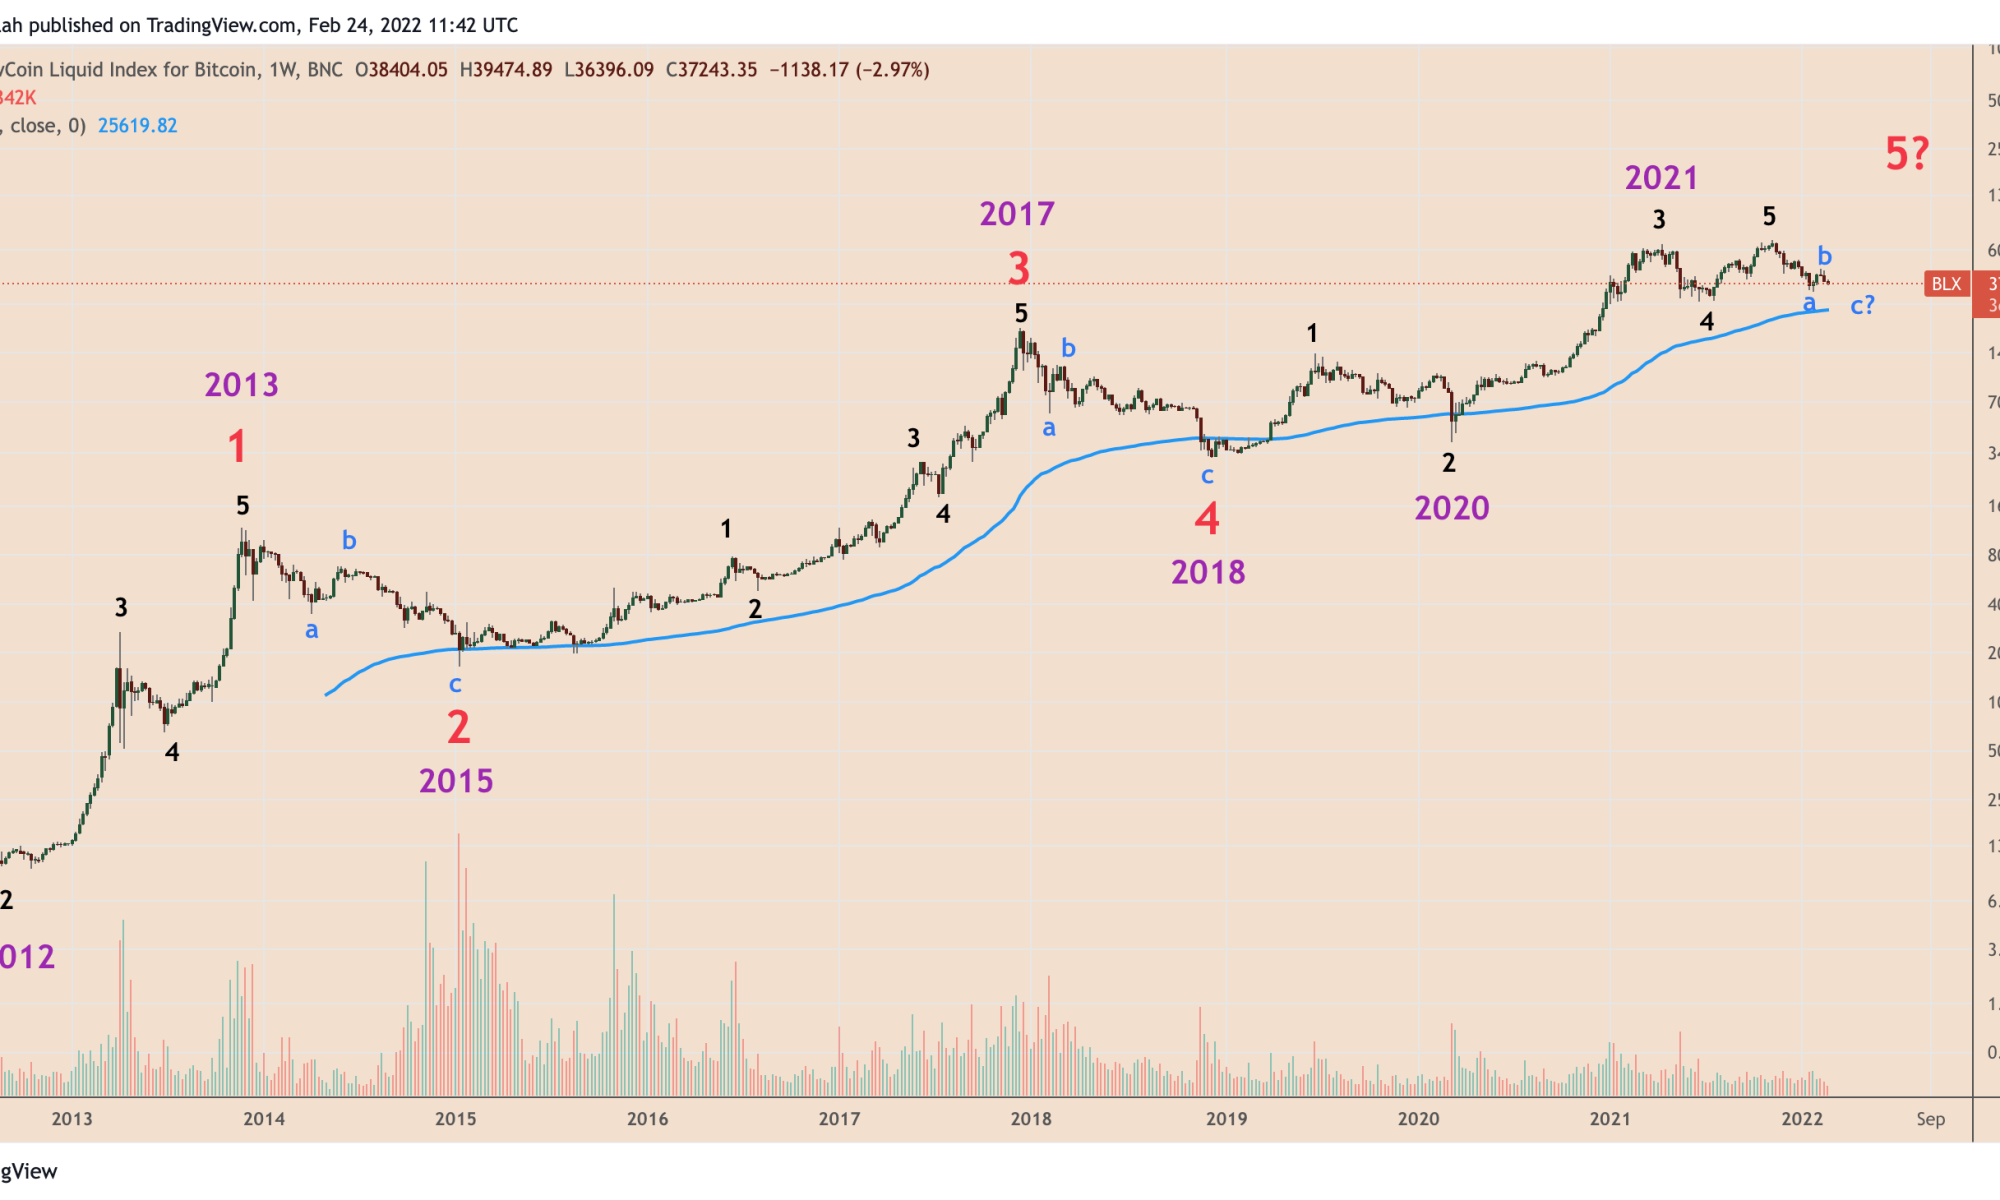
The magic behind Elliott Wave Theory and why it influences growth in financial markets is due to its relationships with Fibonacci numbers. Fibonacci numbers are based on the Fibonacci sequence, which is related to the golden ratio. The Fibonacci sequence reads 0, 1, 1, 2, 3, 5, 8, 13, 21 and so on.

In Elliott Wave Theory, there are 21 corrective patterns ranging from simple to complex. A motive wave is 5 waves up, while corrective waves are 3 waves down, creating a total of 8 when added them up. A full realized impulse wave with all sub-waves is 21 waves up, while corrective phases are up to 13 waves down. Every Fibonacci number from the sequence is included in some capacity.

Corrections also stop at Fibonacci retracement levels, and impulses reach Fibonacci extensions as price targets. Wave 5 is usually equal to wave 1 or wave 3 in terms of magnitude. If wave 5 is extended, and it often is in crypto, wave 5’s target could fall somewhere between 1.618 of wave 3, or 1.618 of the sum of wave 1 and wave 3.

Bitcoin price reached the 3.618 extension from the bear market bottom, making it possible that the top cryptocurrency overshoots once again. On the lowest end, a 1.618 price target would put the peak of BTC for this cycle somewhere close to $96,000 per coin, while another 3.618 extension could take the top cryptocurrency all the way to $194,000 per BTC.

This makes the Bitcoin price prediction using EWT anywhere between $100K to $200K before the cycle is over. You can watch this Bitcoin price prediction unfold in real-time by bookmarking the idea on TradingView.

BTCUSD_2022-12-08_11-53-56

A possible Bitcoin price prediction based on Fibonacci extensions | Source: BTCUSD on TradingView.com

Featured image from iStockPhoto, Charts from TradingView.com

Bitcoin Fundamental Expert Breaks Down Why The Bottom Is In

Calling the bottom in Bitcoin is no easy task. Prices tend to fall more dramatically and faster than anyone is prepared for and is the investing equivalent of catching a falling knife.

Yet if anyone is equipped to accurately call the bottom in crypto, it would be Charles Edwards, fund manager and Bitcoin fundamental expert, responsible for creating some of the most famous tools in crypto. 

Meet The Creator Of The Most Profitable Bitcoin Buy Signal

Although you might not know Charles Edwards by name, you might have heard of some of his tools before. The Hash Ribbons, once known as the most profitable signal in Bitcoin ever, is among his custom toolset of crypto-specific indicators. 

In a recent Twitter thread, Edward unveils a series of on-chain signals that present a strong case as to why the bear market bottom in crypto could be in. 

Among the arguments made include the price per BTC dropping below the electrical cost of generating each coin, plus MVRV-Z score and long-term NUPL are at previous bear market lows. 

bitcoin electrical cost

Bitcoin briefly traded below its electrical cost | Source: BTCUSD on TradingView.com

On-Chain Cases For The Bear Market Bottom Being In

Entity-adjusted dormancy flow is at an all-time low, and we’ve reached the third-highest BTC miner stress event ever. Past events were back when BTC traded at $290 and $2. Bitcoin Energy Value is also at the deepest price discount it’s ever seen. 

btc

Entity-adjusted dormancy flow is at the lowest level ever | Source: Glassnode

Edwards also cites that stablecoin capital is sidelined in USDT and USDC and hasn’t left the industry due to FTX — its just waiting for a reversal to reenter safely.  He also points to miner capitulation in the Hash Ribbons. 

The only problem is that the last time the tool fired, the previously profitable signal failed to yield any positive results for the first time since it was created. Will this signal redeem the indicator?

hash

Will this coming buy signal do the trick? | Source: BTCUSD on TradingView.com

Bitcoin price is trading at approximately $17,000 per coin, or roughly 77% down from all-time highs. Past drawdowns concluded at 96%, 86%, and 84%. What will the final number be for this market cycle?

Featured image from iStockPhoto, Charts from TradingView.com

Bitcoin At $1,000: Looking Back At Nine Years Of Bull Run

If the first part of the above headline about Bitcoin price had your heart pumping, it might be time to reduce the amount of leverage you are using.

No, we aren’t calling for BTC to reach a target of $1,000 – we are instead looking back and celebrating the nine-year anniversary of the first time Bitcoin breached above $1,000.

Nine Years Ago: BTC Breaks Above $1,000

Bitcoin is now in the midst of its fourth ever bear market and currently trading at a price of around $16,000 per coin. After the dramatic fall from $69,000 in late 2021 to current levels, sentiment has taken a beating. It isn’t unusual to see targets on crypto Twitter for $1,000 BTC in the days ahead.

Today, however, we aren’t as focused on future targets for the top cryptocurrency, but the long journey Bitcoin has had from when it first passed $1,000.

Nine years ago from yesterday, on November 27, 2013, BTC breached above $1,000. The level proved to be significant at the time, with BTCUSD trading above $1,000 for less than ten days before the 2014-2015 bear market started.

From that point on, it was more than 1000 days before Bitcoin passed $1,000 again. But when it passed it again, Bitcoin became a household name.

BTCUSD_2022-11-28_08-33-32

Bitcoin breached $1,000 exactly nine years ago yesterday | Source: BTCUSD on TradingView.com

Where To Next: $1K or $1M Per Bitcoin?

$1,000 per BTC was significant for several reasons. It was a large, rounded number in US dollars, but 1 BTC was almost exactly the same price of an ounce of gold at the time.

After breaching above $1,000 a second time, Bitcoin went on to climb just under 2,000% to nearly $20,000 per coin. Today, five years later, BTC is below the 2017 bull market peak.

Related Reading: Bitcoin At $1M By 2030: Why Cathie Wood Remains Confident In Bold Bet

From the $1,000 milestone to current prices at around $16,000 per BTC, the top cryptocurrency still has more than 16,000% ROI its held onto. From its inception, it has gained more than 150,000,000% cumulatively.

Despite this, there are equal calls for a revisit to the $1,000 level as there are for Bitcoin reaching $1 million per coin, making BTC the most interesting speculative asset of all-time.

Follow @TonySpilotroBTC on Twitter or join the TonyTradesBTC Telegram for exclusive daily market insights and technical analysis education. Please note: Content is educational and should not be considered investment advice.

Featured image from iStockPhoto, Charts from TradingView.com

Bitcoin At $1M By 2030: Why Cathie Wood Remains Confident In Bold Bet

Following news that Ark Invest has made investments into Grayscale’s heavily discounted Bitcoin fund, CEO Cathie Wood is doubling down on a bold bet that the top cryptocurrency will reach $1M per coin by 2030.

Is such a lofty price prediction realistic, considering the recent collapse of the crypto market? And can Wood’s call be trusted after the ARK Innovation ETF’s decline that is on par with Bitcoin? Here are all the factors behind the $1M per BTC target in less than a decade.

Cathie Wood: Yes, Bitcoin Will Hit $1M By 2030

In an interview with Bloomberg, Ark Invest CEO Cathie Wood was asked about her past prediction that Bitcoin would make it to a price of $1M per coin by the year 2030. Wood, undeterred by the recent bear market in crypto and equities, recommitted to the bet.

Wood says that the recent fallout from FTX and other top crypto firms only helps to “battle test” the “infrastructure and the thesis” of the first-ever cryptocurrency. She adds that Bitcoin comes out of this “smelling like roses.”

The comment is perhaps in reference to how third parties were heavily at fault in the recent collapse, while the thesis for a decentralized future sans any intermediaries has only been further proven.

While Wood herself isn’t skeptical about Bitcoin, she says the situation may cause institutions to hesitate before entering, but ultimately could be “more comfortable” investing in BTC.

BTCUSD_2022-11-22_19-44-31

Bitcoin reaching $1M by 2030 would be 6,000% | Source: BTCUSD on TradingView.com

Is 6,000% ROI Within 8 Years Possible From Here?

Take the Ark Invest CEO’s comments with a grain of salt. While her idea that bear markets battle-test Bitcoin and proves the network more resilient and therefore more valuable in each cycle, her picks haven’t been winners as of late.

The ARK Invest Innovation ETF is down roughly 79% from its peak. But Bitcoin is also down 79% from its all-time high set in late 2021 and has bounced back several times from worse drawdowns.

At a price of $1M per BTC, the top crypto asset by market cap would have to climb more than 6,000% from the current bear market low in less than eight years. Bitcoin has grown by nearly 60,000% in the last eight years, so anything is possible — despite being improbable.

Follow @TonySpilotroBTC on Twitter or join the TonyTradesBTC Telegram for exclusive daily market insights and technical analysis education. Please note: Content is educational and should not be considered investment advice.

Featured image from iStockPhoto, Charts from TradingView.com

Bitcoin Bounces On Lower Than Expected CPI Data | BTCUSD November 10, 2022

Bitcoin has taken 10% back in a dramatic move following the announcement of October CPI data. CPI came in below expectations, causing a melt up in risk assets including cryptocurrencies.

Take a look at the video below:

VIDEO: Bitcoin Price Analysis (BTCUSD): November 10, 2022

Before suggesting any type of bottom is in, more downside could still be ahead, with this recent movement being nothing more than a bearish retest.

Did The Drop Fill Out A Bullish Wedge Pattern?

The downward move might have filled out a massive bullish wedge, making for the third touch and daily close at the bottom trend line. There is also a daily bullish divergence on the Relative Strength Index, so long as BTCUSD doesn’t make new lows again today. But given all the panic out there, more collapse could be ahead.

BTCUSD_2022-11-10_13-35-53

Does the bull div support a bullish wedge pattern? | Source: BTCUSD on TradingView.com

Related Reading: Bitcoin Bloodbath Takes Crypto To New Bear Market Lows | BTCUSD November 8, 2022

Bitcoin RSI Reaches Most Oversold Monthly Level Ever

On two different timeframes, Bitcoin is working on some record-breaking signals. Weekly timeframes shows a possible bullish divergence. This would be the first in the history of Bitcoin after reaching oversold conditions on the RSI. 

The monthly Relative Strength Index is also the most oversold in the entire history of the cryptocurrency market.

BTCUSD_2022-11-10_13-34-16

Weekly and monthly RSI are giving history-making signals | Source: BTCUSD on TradingView.com

Related Reading: Bitcoin Price: Can Cyclical Tools Predict The Next Bubble? | BTCUSD November 7, 2022

The Bottom Is Near According To Cyclical Perfection

After this latest collapse, each past bear market bottom now lines up accurately down to the one-week timeframe. The bottom will be between now and November 16th if the tool remains accurate down to the daily timeframe. The bottom could already be in, but there are still three whole days remaining in this weekly candle to finish.

Bitcoin also could be working on holding onto the drawn trendline on a closing basis only. If the top cryptocurrency holds at this level, we could potentially get a fifth impulse according to Elliott Wave Theory.

BTCUSD_2022-11-10_13-33-04

Could this be the last wave in Bitcoin for some time? | Source: BTCUSD on TradingView.com

Learn crypto technical analysis yourself with the NewsBTC Trading Course. Click here to access the free educational program.

Follow @TonySpilotroBTC on Twitter or join the TonyTradesBTC Telegram for exclusive daily market insights and technical analysis education. Please note: Content is educational and should not be considered investment advice.

Featured image from iStockPhoto, Charts from TradingView.co

Bitcoin Bear Markets Compared: How Much Longer Till The Bottom? | BTCUSD November 9, 2022

In this episode of NewsBTC’s daily crypto technical analysis videos, we are examining past Bitcoin bear markets to see how much further we could have before a bottom is in.

Take a look at the video below:

VIDEO: Bitcoin Price Analysis (BTCUSD): November 9, 2022

Bitcoin price continues to set new low after low now that support has been decisively broken. 

Expanded Flat Corrective Pattern Fills Out Further

The market is clearly bearish, but on the brighter side we have what could be the final wave in an expanded flat pattern. The push to new lows continues to fill out what could be a large falling wedge pattern. But considering the price action and sentiment out there, it is challenging to consider any bullish thesis.

Bitcoin price is now at the 0.5 retracement using Fibonacci on log settings. But that isn’t very reassuring. Given the expectations for the $14K and $13K area, either Bitcoin price action stops short of that level, or slices right through it.

BTCUSD_2022-11-09_16-27-20

Has the corrective pattern completed? | Source: BTCUSD on TradingView.com

Related Reading: Bitcoin Price: Can Cyclical Tools Predict The Next Bubble? | BTCUSD November 7, 2022

Bitcoin Bear Market Worst-Case Scenario

In these next charts, the worst case scenario would involve filling a BTC CME gap at under $10,000. Not only is there confluence there with diagonal uptrend support, but that is roughly 85% retracement from the peak. 

This is notable, because during the 2018 bear market, BTC fell by 84%, and in the 2015 bear market it dropped 86%. If you average out those two samples, you get an 85% retracement on average.

Much like the top cryptocurrency peaked well below the ROI levels of past bull runs, bear markets won’t see as much of a decline either. The idea is that Bitcoin volatility is disappearing over time.

BTC1!_2022-11-09_16-27-40

BTC Futures gap presents worst-case scenario | Source: BTCUSD on TradingView.com

Related Reading: Litecoin Recovery To End Ongoing Crypto Darkness? LTCUSD November 2, 2022

When Will BTC Put In a Bottom?

On the topic of time, time is most certainly a factor in bear markets. The 2018 bear market took roughly 12 months to reach a bottom, or the same amount of time since the second peak of the BTC double top through now. 

The 2015 bear market took 14 months to find a bottom. If we count the first peak in Bitcoin, the bear market has been the longest ever at 19 months before reaching a bottom.

BTCUSD_2022-11-09_16-33-51

How much longer can the bear market last? | Source: BTCUSD on TradingView.com

Learn crypto technical analysis yourself with the NewsBTC Trading Course. Click here to access the free educational program.

Follow @TonySpilotroBTC on Twitter or join the TonyTradesBTC Telegram for exclusive daily market insights and technical analysis education. Please note: Content is educational and should not be considered investment advice.

Featured image from iStockPhoto, Charts from TradingView.co

Bitcoin Bloodbath Takes Crypto To New Bear Market Lows | BTCUSD November 8, 2022

In this episode of NewsBTC’s daily technical analysis videos, we examine the bloodbath across crypto today and the new record low for this Bitcoin bear market.

Take a look at the video below:

VIDEO: Bitcoin Price Analysis (BTCUSD): November 8, 2022

It was a highly volatile day in crypto markets, led by a battle between FTX and Binance that ultimately might end with Binance owning FTX.com. The two company’s CEO’s public spat caused the already fearful crypto market to collapse further. As a result, Bitcoin price made a new bear market lower low, setting a new record low for all of 2022 at the same time. 

Bulls Demoralized, Bound To Ignore Exhaustion Signal

It is hard to imagine much hope for bulls at this very moment. After months of consolidation and a failed attempt at a breakout, bears appear to have regained control. Of the few notable bullish signals – if any remain at all – the TD sequential on daily timeframes has triggered a perfected TD 13 countdown setup, which could indicate that today’s massacre was a buy and the bear trend has been exhausted.

Today’s uptick in trading volume seems to confirm more downside – or is the heavy volume the capitulation we have been waiting for instead?

BTCUSD_2022-11-08_16-04-52

Will bulls ignore these exhaustion signs? | Source: BTCUSD on TradingView.com

Related Reading: MATIC On The Move After Polygon Tapped By META | MATICUSD November 3, 2022

Bitcoin Futures Goes Back In Time To Beginning Of 2018 Bear Market

On BTC CME Futures, Bitcoin price touched down on the only weekly support that exists on the way down. Because CME futures launched after the top cryptocurrency’s 2017 peak, the price chart began with a bear market in Bitcoin.

On the yearly timeframe, we can see that the price candle touched exactly at the tip top of the wick representing the 2018 yearly high.

BTC1!_2022-11-08_16-03-20

BTC Futures returns to 2018 yearly high | Source: BTCUSD on TradingView.com

Related Reading: Litecoin Recovery To End Ongoing Crypto Darkness? LTCUSD November 2, 2022

Why The Log Curve Is The Last Hope For Crypto Bulls

For bulls looking for something – anything – to find solace in after today’s bloodbath in crypto, there is a chance that this is the bottom based on nothing more than the log growth curve.

Drawn from wick to wick, there is no further room for BTCUSD to go downward much further. Only a few times in history has the exact bottom line been touched and each time has turned into the greatest bull runs on record.

With no room left at the bottom of the log growth curve, what in the world will happen next?

BTCUSD_2022-11-08_16-02-04

There is no room left below the log growth curve | Source: BTCUSD on TradingView.com

Learn crypto technical analysis yourself with the NewsBTC Trading Course. Click here to access the free educational program.

Follow @TonySpilotroBTC on Twitter or join the TonyTradesBTC Telegram for exclusive daily market insights and technical analysis education. Please note: Content is educational and should not be considered investment advice.

Featured image from iStockPhoto, Charts from TradingView.co

Bitcoin Price: Can Cyclical Tools Predict The Next Bubble? | BTCUSD November 7, 2022

In this episode of NewsBTC’s daily technical analysis videos, we examine major Bitcoin price troughs with Hurst Cycle Theory and cyclical tools to consider if the bottom could be in and if another bubble is coming.

Take a look at the video below:

VIDEO: Bitcoin Price Analysis (BTCUSD): November 7, 2022

In this video, we use Hurst Cycle Theory and its several key principles to go through the process of phasing out Bitcoin market cycles to predict when the cryptocurrency will begin to rise again. Cycle analysis consists of visual analysis, using a spectrogram, phasing the dominant cycle, phasing any internal wave harmonics, then completing the phasing process on the chart. Here is a closer look at that process:

Bitcoin Cyclical Behavior Analyzed

To assist with the visual analysis, each Bitcoin halving has been included. The halving has been a widely-discussed driver of internal supply and demand mechanics. We know that Bitcoin bottoms out visually prior to each halving. The log growth curve has also been included for visual assistance.

The next step is to turn on a spectrogram. A spectrogram is a visual heatmap of the spectrum of frequencies of a signal as it varies with time. The more green heat, the stronger the bullish intensity. In contrast, the more purple heat on the map, the stronger the bearish intensity is and that’s where we would look for a cyclical bottom. Within each purple zone we would find our cyclical trough for dominant cycle phasing.

BTCUSD_2022-11-07_14-15-49

Is a new Bitcoin cycle about to begin? | Source: BTCUSD on TradingView.com

Related Reading: Litecoin Recovery To End Ongoing Crypto Darkness? LTCUSD November 2, 2022

Why This Bear Market Felt So Extreme

The next step would be to confirm the dominant cycle by phasing out any harmonics. According to Hurst Cycle Theory, harmonics in cycles come in twos and threes. Essentially, from each major trough to trough, there should be one to two mid-cycle dips. 

Not only does defining the mid-cycle harmonics assist in confirming dominant cycle phasing, but it does also help prove Hurst cycle theory to be accurate. Notice that cyclical troughs tend to bottom in tandem, while the principle of summation explains why the recent selloff felt so long and extreme – it was the sum of a larger composite wave and a smaller harmonic wave combined.

BTCUSD_2022-11-07_14-36-07

Each correction was in near-perfect harmony | Source: BTCUSD on TradingView.com

Related Reading: Bitcoin And The Dollar Reach Inverse Inflection Points | BTCUSD November 1, 2022

Why BTC Is Gearing Up For Another Bubble Cycle

The final step is completing the phasing. For added confirmation, the Fisher Transform is used, which helps to pinpoint precise turning points in markets, as well as the Stochastic RSI. In this system, the Fisher Transform highlights the potential turning point, while the Stoch RSI rising from oversold levels confirms the new bull run.

BTCUSD_2022-11-07_14-16-32

Is this the turning point in the bear market? | Source: BTCUSD on TradingView.com

A Comparison With The Last Crypto Market Bottom

Considering the potential of a bottom in this area, it is worth examining past bottom behavior. Comparing the current Adam and Eve bottom setup to the 2018 bear market bottom is strikingly similar, albeit on a much grander scale. When compared using the three-day timeframe and a set of three slow, moderate, and fast moving averages, the fractal could take Bitcoin price to around $100,000 per coin by the end of Q1 2023.

BTCUSD_2022-11-07_08-14-27

Will BTC close 2022 headed towards new highs? | Source: BTCUSD on TradingView.com

Learn crypto technical analysis yourself with the NewsBTC Trading Course. Click here to access the free educational program.

Follow @TonySpilotroBTC on Twitter or join the TonyTradesBTC Telegram for exclusive daily market insights and technical analysis education. Please note: Content is educational and should not be considered investment advice.

Featured image from iStockPhoto, Charts from TradingView.co

MATIC On The Move After Polygon Tapped By META | MATICUSD November 3, 2022

In this episode of NewsBTC’s daily technical analysis videos we are looking at MATIC following a more than 10% intraday move on the back of the announcement that META would use Polygon for Instagram NFTs.

Take a look at the video below:

VIDEO: Polygon Price Analysis (MATICUSD): November 3, 2022

The continued strength from MATIC has the altcoin’s momentum turning up yet again on the daily, strengthening on weekly timeframes, and only three days away from the 2-week timeframe crossing bullish.

MATIC Gives Golden Cross Signal On Daily

Technical indicators on the daily chart exhibit strength relative to the rest of the crypto market. For example, price is above the mid-Bollinger Band and tagging the upper band; it is well above the Ichimoku cloud, the tenkan-sen and kijun-sen; it has struck the Parabolic SAR; and pushed above the 50, 100, and 200-day moving averages.

Most importantly, there is a golden cross on the daily. The last time there was a daily golden cross on MATICUSD, the cryptocurrency rallied by more than 13,000%.

MATICUSD_2022-11-03_16-50-50

The Bollinger Bands are the tightest in five years | Source: MATICUSD on TradingView.com

Related Reading: Bitcoin And The Dollar Reach Inverse Inflection Points | BTCUSD November 1, 2022

Elliott Wave Theory Hints At Coming Polygon Rally

Low timeframe Elliott Wave Theory counting could suggest that MATIC has finished its wave 1 impulse and possibly a wave 2 correction, before it begins a larger move higher for a wave 3, 4, and 5. Adding in a channel shows that if this is the start of wave 3 of 5, the end of the 5th wave could terminate at the mid-point of the channel.

The channel appears valid throughout a series of different timeframes. On monthly timeframes, turning on the Fisher Transform shows a bullish crossover in the months past that could begin to pick up steam.

MATICUSD_2022-11-03_16-50-00

The Fisher Transform highlights a possible turning point | Source: MATICUSD on TradingView.com

Related Reading: Trick Or Treat For Bitcoin On Halloween Night? | BTCUSD Analysis October 31, 2022

Altcoin Could Dominate Bitcoin And Ethereum

Although the MATICUSD pair looks strong, MATIC versus BTC looks even better, and is close to setting new all-time highs. 

Even the MATIC versus Ethereum pair suggests that MATIC will outperform both Ether and Bitcoin in the months ahead, with the only thing holding it back is this current level.

MATICETH_2022-11-03_16-52-24

MATIC might outperform both BTC and ETH | Source: MATICUSD on TradingView.com

Learn crypto technical analysis yourself with the NewsBTC Trading Course. Click here to access the free educational program.

Follow @TonySpilotroBTC on Twitter or join the TonyTradesBTC Telegram for exclusive daily market insights and technical analysis education. Please note: Content is educational and should not be considered investment advice.

Featured image from iStockPhoto, Charts from TradingView.c