Litecoin Recovery To End Ongoing Crypto Darkness? LTCUSD November 2, 2022

In today’s episode of NewsBTC’s daily technical analysis videos we are examining Litecoin after a 10% intraday move to see if it will turn into a broader crypto market rally.

Take a look at the video below:

VIDEO: Litecoin Price Analysis (LTCUSD): November 2, 2022

Litecoin has been an altcoin that once regularly led the start of new crypto market bull runs. We are looking to find out if LTC will once again lead the way.

Weekly LTCUSD Chart Shows Tightest Bollinger Bands In Five Years

On daily timeframes (shown only in the video), Litecoin is outside of the upper Bollinger Bands, above the Ichimoku cloud, has tagged the Parabolic SAR, and given buy signal on the SuperTrend. LTCUSD daily also took out the 50– day and 100-day moving average and is flirting with the 200-day moving average.

Weekly technical indicators also support a larger bullish move. Litecoin has reclaimed the middle-Bollinger Band and then the Tenkan-sen on the Ichimoku.

How tight the Bollinger Bands are are especially notable, as they are the tightest in over five years, and the tightest since the last time Litecoin vastly outperformed Bitcoin.

LTCUSD_2022-11-02_08-44-28

The Bollinger Bands are the tightest in five years | Source: LTCUSD on TradingView.com

Related Reading: Trick Or Treat For Bitcoin On Halloween Night? | BTCUSD Analysis October 31, 2022

Litecoin Bottoms In Phase With Past Cycle Troughs

On monthly timeframes, LTCUSD is flipping bullish and turning green on the Fisher Transform. Pictured is the iFish Smoothed version, created by  MoeMentum on TradingView. The Fisher Transform helps to pinpoint cyclical turning points in markets. Adding in cyclical timing tools shows that the cycle troughs are nearly perfectly in phase.

LTCUSD_2022-11-02_12-03-14

The Fisher Transform highlights a possible turning point | Source: LTCUSD on TradingView.com
Comparing LTC With Dogecoin: The Other Scrypt Altcoin

The LTCBTC trading pair looks very similar to the DOGE versus BTC trading pair, which saw an enormous breakout against Bitcoin already. Both LTC and Dogecoin utilize the Scrypt mining algorithm and the two coins can be merge-minded at the same time.

DOGEBTC_2022-11-02_08-19-10

Will Litecoin experience a DOGE-like move? | Source: BTCUSD on TradingView.com

Related Reading: The Inverted Bitcoin Chart Bears Don’t Wanna See | BTCUSD Analysis October 27, 2022

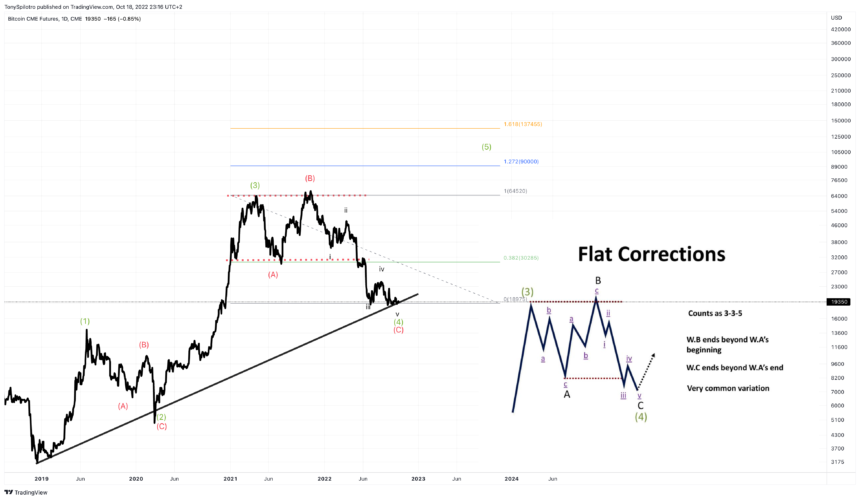
Elliott Wave Points To Grand Finale In Crypto Bull Market

The once top-ten cryptocurrency appears to have formed a long-term channel, and is bouncing from the very bottom of the upward sloping trend line.

Elliott Wave counting suggests that Litecoin could be about to embark on impulse Wave 5 of an expanding diagonal, after completing a Wave 4 correction back down to the lower trend line. Expanding diagonals alternate between impulse waves and corrective waves from the zig-zag family. Zig-zags are typical ABC corrections. Wave 2 would be more simple in structure, while Wave 4 was complex. 

The last final wave up in Litecoin produced more than 9,000% ROI. It happened just as the Bollinger Bands on weekly timeframes were as tight as they are right now. While 9,000% won’t be possible again, the peak of Wave 5 could be somewhere around $1,500, or roughly 3,000% in ROI.

LTCUSD_2022-11-02_12-09-26

Is this the final wave up in crypto? | Source: BTCUSD on TradingView.com

Learn crypto technical analysis yourself with the NewsBTC Trading Course. Click here to access the free educational program.

Follow @TonySpilotroBTC on Twitter or join the TonyTradesBTC Telegram for exclusive daily market insights and technical analysis education. Please note: Content is educational and should not be considered investment advice.

Featured image from iStockPhoto, Charts from TradingView.c

Bitcoin And The Dollar Reach Inverse Inflection Points | BTCUSD November 1, 2022

In this episode of NewsBTC’s daily technical analysis videos, we examine Bitcoin price following the October monthly close and new November candle open.

Take a look at the video below:

VIDEO: Bitcoin Price Analysis (BTCUSD): November 1, 2022

Last night on Halloween we also had the October monthly BTCUSD candle close, which brought with it the start of a new November monthly candle and a reset of technical indicators.

BTC Cost of Production On Par With 2018 Bear Market

To start, we are looking at the cost to produce each BTC. Bitcoin is now just about on par with the 2018 bear market for the longest time below the cost of production metric. But this also could suggest at least another month of sideways price action.

BTCUSD_2022-11-01_13-46-12

Bitcoin is below the cost to produce each coin for most miners | Source: BTCUSD on TradingView.com

Related Reading: The Inverted Bitcoin Chart Bears Don’t Wanna See | BTCUSD Analysis October 27, 2022

Bitcoin Momentum Is Building Up From Lows

Monthly momentum isn’t turning over as fast as it did during the 2018 bear market, leaving some risk remaining that more lows are possible. If the currently pink histogram closes red again, expect a bigger drop.

Monthly stochastic is also flipping bullish. Past crossovers have pin-pointed previous bottoms, but there won’t be any bull run until the tool rises out of oversold territory.

BTCUSD_2022-11-01_13-45-39

When will momentum flip bullish once again? | Source: BTCUSD on TradingView.com

Related Reading: Bitcoin Bollinger Band Breakout Starts To Squeeze Shorts | BTCUSD Analysis October 26, 2022

Will We See A Cyclical Conclusion In The Dollar?

On the left, we have BTCUSD monthly using the Fisher Transform. The statistics-based technical indicator is used to find exact turning points in market cycles. Not only is the monthly Fisher on Bitcoin at a level where its price action bottomed in the past, but each bottom has also recurred cyclically with stunning precision.

To the right, the Dollar Currency Index is showing a topping signal inverse of Bitcoin’s bottoming signal, all while at the most extreme deviation in the entire history of the index on monthly timeframes.

If the DXY pauses or reverses from here, Bitcoin could see a resumption of its bull market. If the dollar finds the momentum to keep climbing, the cryptocurrency market could see new lows.  DXY_2022-11-01_13-44-56

Is this the turning point in the bear market? | Source: BTCUSD on TradingView.com

Learn crypto technical analysis yourself with the NewsBTC Trading Course. Click here to access the free educational program.

Follow @TonySpilotroBTC on Twitter or join the TonyTradesBTC Telegram for exclusive daily market insights and technical analysis education. Please note: Content is educational and should not be considered investment advice.

Featured image from iStockPhoto, Charts from TradingView.co

Trick Or Treat For Bitcoin On Halloween Night? | BTCUSD Analysis October 31, 2022

In this episode of NewsBTC’s daily technical analysis videos, we examine Bitcoin price action on Halloween night to see if the market is in for any tricks or treats.

Take a look at the video below:

VIDEO: Bitcoin Price Analysis (BTCUSD): October 31, 2022

The forecast for Halloween night is cloudy with a chance of consolidation, according to the Ichimoku. As long as BTCUSD remains inside the cloud we shouldn’t expect many tricks, nor treats. The most recent rally took pause at the 100-moving average and could return to the 50-day MA for a retest before moving further. Losing both moving averages would send Bitcoin to goblin town.

Bulls Run Into Resistance, But Bears Have Yet To Scare

Last night was a weekly close in Bitcoin, but the top cryptocurrency narrowly missed closing above the mid-Bollinger Band –– a sign that a bullish trend might be brewing that is now at risk of rejection.

During the 2018 bear market, closing directly below the mid-BB led to further consolidation before a larger breakout and it could happen again. Rejection would lead to nightmarish results.

BTCUSD_2022-10-31_15-17-39

Bitcoin bulls could be in danger | Source: BTCUSD on TradingView.com

Related Reading: Bitcoin Bollinger Band Breakout Starts To Squeeze Shorts | BTCUSD Analysis October 26, 2022

Bitcoin Readies Final Nail In Crypto Winter Coffin

Bitcoin did manage to escape beyond the Tenkan-sen using the Ichimoku, which during the last bear market was enough to put the final nail in bear’s coffins. 

If crypto bulls are indeed out for blood, pushing prices to the Kijun-sen near $30,000 would inflict serious pain on the short side of the market –– which is currently a crowded trade.

BTCUSD_2022-10-31_15-21-19

Will Bitcoin price make shorts bleed? | Source: BTCUSD on TradingView.com

Related Reading: Are Bitcoin Bulls Ready To Stampede? | BTCUSD Analysis October 25, 2022

Will BTC Survive All Hallows’ Eve?

Only hours remain for the October month candle to close with a potential tweezer bottom –– similar to the candle structure from back in December 2018.

Bitcoin will also close the month with weakening bearish monthly momentum for the first time in nearly one full year. While the LMACD histogram has been bearish for its 14th month, momentum shows it will stay that way for at least a couple more months.

We are also looking ahead toward next month for the Fisher Transform to cross. The tool is used for finding precise turning points in markets, and in the past has accurately predicted tops and bottoms on the highest timeframes. Cyclical tools show that the turning point could arrive before the end of the year, but it isn’t quite here yet. 

BTCUSD_2022-10-31_15-29-33

Is this the turning point in the bear market? | Source: BTCUSD on TradingView.com

Learn crypto technical analysis yourself with the NewsBTC Trading Course. Click here to access the free educational program.

Follow @TonySpilotroBTC on Twitter or join the TonyTradesBTC Telegram for exclusive daily market insights and technical analysis education. Please note: Content is educational and should not be considered investment advice.

Featured image from iStockPhoto, Charts from TradingView.com

The Inverted Bitcoin Chart Bears Don’t Wanna See | BTCUSD Analysis October 27, 2022

In this episode of NewsBTC’s daily technical analysis videos, we flip the Bitcoin price chart upside down to get a unique perspective on the market.

Take a look at the video below:

VIDEO: Bitcoin Price Analysis (BTCUSD): October 27, 2022

Inverted Bitcoin Price Chart Could Suggest Bear Market Is Over

When price action seems confusing, inverting the chart of any asset can help to remove bias and provide a clearer picture. Looking at BTCUSD from this perspective, it sure looks like a retest of horizontal support turned resistance. There is also an ongoing breakdown of an uptrend line. But remember, everything is upside down.

On higher timeframes, diagonal downtrend resistance remains intact. We can also clearly see very similar price action across the last major “top” which is actually the 2018 bear market bottom. When you flip things right side up again, does Bitcoin really look all that bearish?

BTCUSD_2022-10-27_16-07-50

Bitcoin bulls can turn that frown upside down | Source: BTCUSD on TradingView.com

Related Reading: Are Bitcoin Bulls Ready To Stampede? | BTCUSD Analysis October 25, 2022

BTCUSD Weekly RSI Buy Signal Days Away From Confirming

Moving along, we also have a potential buy signal on the weekly Relative Strength Index. This one is particularly important, as this is how the tool’s creator intended it to work. The buy signal happens when a higher high is made on the RSI, after reaching oversold conditions and holding above oversold territory on a subsequent bounce. 

It does help that BTCUSD weekly is also working on breaking out of downtrend RSI resistance also at the very same time. Looking back at past Bitcoin bottoms, we can see that it was this exact buy signal that put in each bottom on weekly timeframes. We can also see there is a cyclical rhythm to when each downtrend has come to its conclusion.

BTCUSD_2022-10-27_16-00-20

Cyclical timing could suggest crypto winter is over | Source: BTCUSD on TradingView.com

Related Reading: Can Bitcoin Bring An End To Crypto Winter? | BTCUSD Analysis October 24, 2022

The End Of The Dollar Rally Could Conclude Crypto Winter

If that was a RSI buy signal on the BTCUSD weekly, what we are about to see is a sell signal on the RSI via the DXY weekly. The sell signal on the Dollar Currency Index is beginning to break down from a diagonal RSI support line, and break down from its ongoing parabola. 

Putting the DXY and Bitcoin chart side to side, we can see that there are directly opposing signals on each chart. Watch the full video for the complete analysis and more comparisons.

DXY_2022-10-27_16-01-02

The dollar and BTC are giving opposite signals | Source: BTCUSD on TradingView.com

Learn crypto technical analysis yourself with the NewsBTC Trading Course. Click here to access the free educational program.

Follow @TonySpilotroBTC on Twitter or join the TonyTradesBTC Telegram for exclusive daily market insights and technical analysis education. Please note: Content is educational and should not be considered investment advice.

Featured image from iStockPhoto, Charts from TradingView.com

Bitcoin Bollinger Band Breakout Starts To Squeeze Shorts | BTCUSD Analysis October 26, 2022

In this episode of NewsBTC’s daily technical analysis videos, we take a look at the ongoing Bitcoin price breakout above the upper Bollinger Band on daily BTCUSD charts and provide some insight into what the next targets might be.

Take a look at the video below:

VIDEO: Bitcoin Price Analysis (BTCUSD): October 26, 2022

The breakout across crypto has already resulted in a substantial amount of shorts liquidated. How far could this Bitcoin rally run?

Bitcoin Rally Approaches Middle Of Trading Range

Bitcoin price is now at the middle-point of a horizontal trading range, making for a natural stopping point for profit-taking and to draw in a fresh set of short positions. Busting through the range median will result in another attempt at around $25K. 

More importantly, the Bitcoin price is continuing to make a strong push outside of the Bollinger Bands on daily timeframes. After tightening for so long, and now starting to expand, the rally could have more legs than bears expect.

BTCUSD_2022-10-26_13-55-09

BTC is attempting to break through the median of a the trading range | Source: BTCUSD on TradingView.com

Related Reading: Can Bitcoin Bring An End To Crypto Winter? | BTCUSD Analysis October 24, 2022

BTCUSD Weekly Hits Resistance At Middle Bollinger Band

That is because Bitcoin price has already found and met resistance at the mid-Bollinger Band on weekly timeframes. The key resistance level at the 20-week SMA, was where I placed a hedge short entry today in case the rally is rejected instead.

If there is no rejection and Bitcoin keeps rising, we could be looking at a full-blown return to a crypto bull run. Zooming out shows just how significant a weekly close above the middle Bollinger Band would be.

Turning on Bollinger Band Width shows that the bands are some of the tightest ever. The last two instances were prior to the 50% breakdown to the 2018 bear market bottom. Before that was prior to the epic 2017 Bitcoin bull run that made the cryptocurrency a household name.

Importantly, in 2018, Bitcoin price was below the mid-Bollinger Band, while in 2016 it was above the mid-BB. The trend is more likely to continue on whatever side of the mid-BB price is on. If the weekly BTCUSD chart closes above the middle band and holds, it could be off to the races once again for Bitcoin bulls.

BTCUSD_2022-10-26_13-56-17

The crypto bull run could be back in with a weekly close above the mid-BB | Source: BTCUSD on TradingView.com

Related Reading: Bitcoin Dominance To Regain Control Over Crypto? | BTC.D Analysis October 20, 2022

Crypto Profit Targets To Watch For Using The Ichimoku

Back to those weekly Bollinger Bands, for a sense of what happens if BTCUSD were to get through the mid-BB. The upper band would become the next logical target, located at $23,800. Much like Bitcoin has done on daily timeframes, pushing outside of the upper band is possible given the abundance of short interest in the market.

Replacing the Bollinger Bands with the Ichimoku on the same weekly timeframe, also tells us a lot about what could happen next. Bitcoin price is pushing above the Tenkan-sen, making the next major resistance level the Kijun-sen located at $32,000. In 2018, we can see that the two lines were much closer together, but anything is possible with so much energy built up in the market.

During the first bounce from the 2018 bear market bottom, Bitcoin price pushed all the way outside of the top of the cloud, only to make it out of it, but ultimately lose it once again on Black Thursday 2020. If Bitcoin price were to reach the top of the cloud, the rally could be stopped at $43,000. Once above the cloud, all that’s left for Bitcoin is the moon. 

BTCUSD_2022-10-26_14-00-00

Bitcoin price is stuck at former ATH resistance | Source: BTCUSD on TradingView.com

Learn crypto technical analysis yourself with the NewsBTC Trading Course. Click here to access the free educational program.

Follow @TonySpilotroBTC on Twitter or join the TonyTradesBTC Telegram for exclusive daily market insights and technical analysis education. Please note: Content is educational and should not be considered investment advice.

Featured image from iStockPhoto, Charts from TradingView.com

Are Bitcoin Bulls Ready To Stampede? | BTCUSD Analysis October 25, 2022

In this episode of NewsBTC’s daily technical analysis videos, we take a look at the Bitcoin price rally to see if it can turn into something much bigger. Are bulls ready to stampede all over bears?

Take a look at the video below:

VIDEO: Bitcoin Price (BTCUSD): October 25, 2022 Crypto Winter

Finally, some action in Bitcoin, and so far it is to the upside. Bitcoin price is testing just below $20,000 currently.

BTCUSD Daily Begins Potential Bollinger Band Squeeze

This is particularly important for a variety of reasons, first and foremost being the daily Bollinger Bands. The tool is at the tightest levels since prior to the October 2020 bull impulse. Bitcoin price must close above the upper Bollinger Band on high enough volume to spark a sustainable trend. This is called riding the bands and volume should be roughly two thirds what it has been during the recent sideways phase.

Just above the upper Bollinger Band, is the Ichimoku cloud. The last time Bitcoin daily price action touched the cloud, it was rejected, but this time could be different. BTCUSD is also above the Tenkan-sen and Kijun-sen which are crossed bullish at the moment. At almost exactly the same levels, is the daily Parabolic SAR. The tool is used to set trailing stop losses, so a short squeeze could begin after pushing through there.

BTCUSD_2022-10-25_13-19-31

Dynamic indicator resistance is piled up | Source: BTCUSD on TradingView.com

Related Reading: Bitcoin Dominance To Regain Control Over Crypto? | BTC.D Analysis October 20, 2022

Bitcoin Price Targets $21K And $25K Next

Bitcoin price action has also made it through the 50-day moving average, making the 100-day and 200-day moving averages the next logical price targets. These targets are located at roughly $21,000 and $25,000 give or take a couple hundred dollars.

All of the bullish signals are occurring just as momentum begins to approach the zero line on the LMACD. Passing through it could confirm a change in the trend in the short term. The medium term trend could also be about to chance, according to the same tool on the weekly timeframe. Momentum is beginning to turn upward and strengthen after reaching levels from the last bear market bottom.

BTCUSD_2022-10-25_13-19-55

The 100-day and 200-day moving averages could be next targets | Source: BTCUSD on TradingView.com

Related Reading: Is The Final Wave In Ethereum Up Next? | ETHUSD Analysis October 19, 2022

The Pixel Perfect Line For Crypto To Cross

At the moment, Bitcoin price on the daily timeframe is still struggling with an important resistance level –– perhaps one of the most important levels it has ever faced as resistance: Former all-time high resistance set nearly five years earlier. 

In combination with all of the dynamic indicator resistance above, price action is taking a pause to struggle with this exact level, down to a one-pixel line of resistance.

Update: Bitcoin price has broke above this level and is now trading above $20,000.

BTCUSD_2022-10-25_13-12-12

Bitcoin price is stuck at former ATH resistance | Source: BTCUSD on TradingView.com

Learn crypto technical analysis yourself with the NewsBTC Trading Course. Click here to access the free educational program.

Follow @TonySpilotroBTC on Twitter or join the TonyTradesBTC Telegram for exclusive daily market insights and technical analysis education. Please note: Content is educational and should not be considered investment advice.

Featured image from iStockPhoto, Charts from TradingView.com

Can Bitcoin Bring An End To Crypto Winter? | BTCUSD Analysis October 24, 2022

In this episode of NewsBTC’s daily technical analysis videos, we use the Fisher Transform and other tools to see how close Bitcoin is to putting an end to crypto winter.

Take a look at the video below:

VIDEO: Bitcoin Price (BTCUSD): October 24, 2022 Crypto Winter

Bitcoin continues to be boring, but the theme of this video is all about what happens when the notoriously volatile cryptocurrency gets dull. All downside and no rallies makes Bitcoin a dull boy.

“Here’s Johnny:” What Happens When Bitcoin Becomes A Dull Boy

The Bollinger Bands are getting even tighter, showing that explosiveness is coming soon enough and this ongoing lull is just the calm before the storm. Daily Bollinger Band Width is now at the lowest point since October 2020 right before the bull breakout in 2020. Prior to that, the bands got that tight just ahead of the collapse to the bear market bottom in 2018.

On weekly timeframes, Bollinger Band Width is the tightest since the November 2018 breakdown, where Bitcoin dropped another 50% to its eventual bottom. All instances before that when the bands got this tight led to an enormous rally.

The monthly timeframe shows a very unusual phenomenon. The Bollinger Bands are actually now expanding after being some of their tightest ever. Rising after such a lull in volatility has in the past always triggered a trendmous bull run. Is the third time the charm?

BTCUSD_2022-10-24_14-42-45

The Bollinger Bands are some of the tightest ever | Source: BTCUSD on TradingView.com

Related Reading: Is The Final Wave In Ethereum Up Next? | ETHUSD Analysis October 19, 2022

Why We Could Have Several More Weeks Of Crypto Winter

After this weekend’s weekly close, Bitcoin bulls have now closed three full weeks with a confirmed bullish crossover on the LMACD. Compared to the 2018 bear market bottom, we would only be a week or so away from making a larger move upward.

However, a comparison with the 2015 bear market bottom shows that although new lows might not arrive, there could be twice as long to wait before the bottom is confirmed as in and the range is left behind.

Other possible signals on weekly timeframes that could suggest we’ve seen the bottom already, is that Heiken Ashi candles are starting to turn green. 

BTCUSD_2022-10-24_14-46-03

How much longer will crypto winter last? | Source: BTCUSD on TradingView.com

Related Reading: Bitcoin Price Action Falls Flat | BTCUSD Analysis October 18, 2022

Cyclical Timing Tools Suggest Spring Is Almost Here

The two-week Fisher Transform has also started to flip bullish (pictured right). But it will take another 14 days to confirm the signal. The Fisher Transform is used to find major turning points in markets, but works best on the highest timeframes. 

Moving to the monthly timeframe (pictured left), we can see that even here the Fisher has very little room left and if Bitcoin hands around here for another week or so, the monthly should begin to flatten, signaling a possible turnaround in price action. The Fisher Transform is based on a standard deviation formula, and with Bitcoin monthly at a -3.0 standard deviation, there is only a limited 0.1% chance the bear market will continue.

BTCUSD_2022-10-24_14-40-02

Will the Fisher flip and confirm the bottom? | Source: BTCUSD on TradingView.com

Learn crypto technical analysis yourself with the NewsBTC Trading Course. Click here to access the free educational program.

Follow @TonySpilotroBTC on Twitter or join the TonyTradesBTC Telegram for exclusive daily market insights and technical analysis education. Please note: Content is educational and should not be considered investment advice.

Featured image from iStockPhoto, Charts from TradingView.com

Bitcoin Dominance To Regain Control Over Crypto? | BTC.D Analysis October 20, 2022

In this episode of NewsBTC’s daily technical analysis videos, we are analyzing Bitcoin dominance (BTC.D) and how the top cryptocurrency might perform in the near term against altcoins.

Take a look at the video below:

VIDEO: Bitcoin Dominance Versus Altcoins (BTC.D): October 20, 2022

In addition to the video highlights listed below the video, we also analyze BTC.D using the Ichimoku, Average Directional Index, LMACD, and other technical tools.

Bitcoin Outperforms Altcoins During Sideways Phase

On daily timeframes, BTC.D is taking a short pause, but is mostly still bullish according to price action and technical indicators. Dominance is above the Tenkan-sen and Kijun-sen on the Ichimoku, while flipped bullish on the LMACD. The Average Directional Index at the bottom shows that trend strength is weakening on daily timeframes and bulls have the upper hand

Bitcoin is has been outperforming altcoins | Source: ETHUSD on TradingView.com

Related Reading: Bitcoin Price Action Falls Flat | BTCUSD Analysis October 18, 2022

Why Altcoin Season Could Be Over For Some Time

On weekly timeframes using the same tools, we can see that dominance has only just turned bullish against altcoins, and the Average Directional Index is hinting that this trend could soon strengthen. On the Ichimoku, dominance is above the Tenkan-sen, but not the Kijun-sen, making it the next logical target.

Moving to monthly timeframes, Bitcoin dominance is also bullish against alts on the LMACD, and the ADX shows that altcoin season could be cooling off for some time. The Ichimoku isn’t very telling, but much like weekly timeframes, the Kijun-sen above could make for a possible next target.

But the trend could just be beginning | Source: ETHUSD on TradingView.com

Related Reading: A Bullish Week In Bitcoin On The Way? BTCUSD Analysis October 17, 2022

Can Alts Hold Onto 50% Of Crypto Dominance?

Additional trend line TA shows that BTC dominance possibly retested the neckline of a years old inverse head and shoulders pattern, which includes the early 2018 alt season peak that came shortly after Bitcoin topped in December 2017 at $20,000. Shockingly, Bitcoin is trading below that level some five years later.

If Bitcoin dominance does reverse hard against altcoins, the line in the sand to watch for is around 52% dominance. Above there would trigger the first ever monthly buy signal of Bitcoin against altcoins. 

Will BTC recapture 50% of crypto market share? | Source: ETHUSD on TradingView.com

Learn crypto technical analysis yourself with the NewsBTC Trading Course. Click here to access the free educational program.

Follow @TonySpilotroBTC on Twitter or join the TonyTradesBTC Telegram for exclusive daily market insights and technical analysis education. Please note: Content is educational and should not be considered investment advice.

Featured image from iStockPhoto, Charts from TradingView.com

Is The Final Wave In Ethereum Up Next? | ETHUSD Analysis October 19, 2022

In this episode of NewsBTC’s daily technical analysis videos, we are examining Ethereum due to how boring Bitcoin price action is. Here is an update on the top ranked altcoin.

Take a look at the video below:

VIDEO: Ethereum Price Analysis (ETHUSD): October 19, 2022

In addition to the video highlights listed below the video, we also analyze ETHUSD using the Ichimoku, Bollinger Bands, Moving Averages, and other technical tools.

Top Altcoin Tightens Up Ahead Of Huge Move

If you thought the Bollinger Bands on BTCUSD were tight, check out Ethereum on daily timeframes. This is highly unusual for the volatile altcoin, only happening two times in the past according to Bollinger Band Width. One time was prior to the final plunge during the 2018 bear market, and the second time was right before a breakout from the bottom lows.

Comparing the 2018 bear market with the current price action better aligns with the bullish move, but it is worth preparing for a final move down.

The Bollinger Bands are some of the tightest ever | Source: ETHUSD on TradingView.com
Weekly ETHUSD Signals Could Suggest A Bottom Is In

The weekly Ichimoku gives us a bit more information to compare. During the past bear market, the cloud twisted after the bottom was in. That twist of the cloud takes place next week this time around. 

Coincidentally, the bottom was also already in when the 50 and the 100-week moving average death crossed. This also triggers next week regardless of where Ether goes next. The only problem is that the 200-week moving average is posing as resistance currently at $1,308.

Does the cloud forecast that the bottom is in? | Source: ETHUSD on TradingView.com

Related Reading: A Bullish Week In Bitcoin On The Way? BTCUSD Analysis October 17, 2022

Does Ethereum Have One Wave Left?

From a pattern perspective, ETHUSD monthly price action could be holding onto a trend line forming the lower boundary of a massive rising wedge. Adding in potential Elliott Wave labeling, and there is room in the wedge for a wave 5 to materialize.

If not, the wedge pattern could be at risk of breaking down. Down to where? No one really knows.

Could Ethereum have one more wave ahead? | Source: ETHUSD on TradingView.com

Learn crypto technical analysis yourself with the NewsBTC Trading Course. Click here to access the free educational program.

Follow @TonySpilotroBTC on Twitter or join the TonyTradesBTC Telegram for exclusive daily market insights and technical analysis education. Please note: Content is educational and should not be considered investment advice.

Featured image from iStockPhoto, Charts from TradingView.com

How Bitcoin On-Chain Signals Present A Solid Case For A Market Bottom

Bitcoin price remains stuck below its former all-time high set five years ago. The shocking decline has been one of the worst crypto winters on record, and the market is bracing for continued meltdown.

However, a series of on-chain indicators in BTC could provide clues to how close we are to a bottom. Let’s take a look.

A Series Of Six On-Chain Indicators Shout: Bitcoin Bottom Is In

Bear markets are brutal in Bitcoin or otherwise, because the bottom is only known in hindsight. The feeling that markets will fall forever, creates a fear that freezes investors from buying at long-term lows.

Technical analysis is one tool that can be used to find oversold conditions or other signals that support the idea of a bottom. Unique to cryptocurrencies, is a subset of quantitative fundamental analysis that focuses on on-chain signals. Several such tools are potentially suggesting a bottom is in.

Here we have the Puell Multiple. The Puell Multiple is calculated by dividing the daily issuance value of bitcoins (in USD) by the 365-day moving average of daily issuance value.

Puell Multiple | Source: glassnode

Bitcoin Reserve Risk is currently demonstrating the most attractive risk/reward setup ever. Reserve Risk is defined as price / HODL Bank. It is used to assess the confidence of long-term holders relative to the price of the native coin at any given point in time.

Bitcoin Reserve Risk | Source: glassnode

In this chart, we have MVRV Z-Score. The MVRV Z-Score is used to assess when Bitcoin is over/undervalued relative to its “fair value”.

MVRV Z-Score | Source: glassnode

Net Realized Losses are the largest ever. Net Realized Profit/Loss is the net profit or loss of all moved coins, and is defined by the difference of Realized Profit – Realized Loss.

Net Realized Profit/Loss | Source: glassnode

The Realized Profits-to-Value Ratio is also in the bottom zone. The Realized Profits-to-Value Ratio is defined as the ratio of Realized Profits and Realized Cap. This metric compares profit-taking in the market with its overall cost basis on a dollar-to-dollar basis.

Realized Profits-to-Value Ratio | Source: glassnode

Finally, Net Unrealized Profit/Loss shows capitulation. Interestingly, BTC never quite reached a state of euphoria and greed during the last market top. The dataset is also becoming less volatile over time, much like Bitcoin price itself. Net Unrealized Profit/Loss is the difference between Relative Unrealized Profit and Relative Unrealized Loss.

Net Unrealized Profit/Loss | Source: glassnode

While none of these signals confirm the bottom is in for Bitcoin price action, each tool is in a zone that historically has been where past bear markets ended. Should the top cryptocurrency by market cap bottom here, it would be the smallest maximum drawdown in Bitcoin history.

Follow @TonySpilotroBTC on Twitter or join the TonyTradesBTC Telegram for exclusive daily market insights and technical analysis education. Please note: Content is educational and should not be considered investment advice.

Featured image from iStockPhoto, Charts from TradingView.com

Bitcoin Price Action Falls Flat | BTCUSD Analysis October 18, 2022

In this episode of NewsBTC’s daily technical analysis videos, we are once again examining a possible expanded flat correction in Bitcoin. Once the correction has completed, the bull market could resume.

Take a look at the video below:

VIDEO: Bitcoin Price Analysis (BTCUSD): October 18, 2022

In addition to the video highlights listed below the video, we also analyze BTCUSD using the Ichimoku, Bollinger Bands, SuperTrend, TD Sequential, and other technical tools.

Three Strikes: BTCUSD Rejected From 50-Day Moving Average

BTCUSD daily price action was once again rejected from the 50-day moving average. This is the third rejection since September, making the 50MA a critical line in the sand to pass before any chance of further upside.

Zooming out and comparing the 50MA and its behavior around the 2018 bear market bottom, we can see that breaking through it is the key to bulls regaining control on daily timeframes. Given the close proximity of the 100-day moving average in yellow, the next target would be the red, 200-day moving average located at around $26K.

If Bitcoin can break the 50-MA and 100-MA, $26K is next | Source: BTCUSD on TradingView.com
Bitcoin CME Futures Paints Near-Perfect Expanded Flat Pattern

The BTC CME Futures line chart causes the price action over the last 18 months to nearly perfectly fill out an expanded flat pattern. An expanded flat features a higher high at the top of the B wave, followed by a lower low as the C wave terminates. The C wave is an impulse wave down made up of 5 total sub-waves.

The BTC CME chart begins with a bear market. The primary count would suggest the expanded flat correction formed in wave 4 and there is still a wave 5 ahead. In Elliott Wave Theory, one way to possibly project the peak of where wave 5 will terminate, is to find the inverse Fibonacci extension of wave C. 

At the 1.272 extension, Bitcoin would reach $90,000, while if the 1.618 golden ratio extension is tapped, the top would be over $137,000 per BTC.

Could this be the correction that has cut down crypto prices? | Source: BTCUSD on TradingView.com

Related Reading: Bitcoin Price Bounces After CPI Dump | BTCUSD Analysis October 13, 2022

Will The Crypto Winter Conclude With A Touch Of The Log Growth Curve?

Although given the macro sentiment, the risk of recession, and the fact each floor in crypto has fallen out again and again, this is not an unusual place for Bitcoin to bottom out.

Bitcoin price continues to grind along the logarithmic growth curve. All price action throughout the entire history of cryptocurrencies has been contained within this narrowing curvature. Why would it suddenly stop now?

BTC is brushing against the bottom of the log curve | Source: BTCUSD on TradingView.com

Learn crypto technical analysis yourself with the NewsBTC Trading Course. Click here to access the free educational program.

Follow @TonySpilotroBTC on Twitter or join the TonyTradesBTC Telegram for exclusive daily market insights and technical analysis education. Please note: Content is educational and should not be considered investment advice.

Featured image from iStockPhoto, Charts from TradingView.com

A Bullish Week In Bitcoin On The Way? BTCUSD Analysis October 17, 2022

In this episode of NewsBTC’s daily technical analysis videos, we are looking at the best chance Bitcoin and the rest of crypto has had for a bullish week in a long time.

Take a look at the video below:

VIDEO: Bitcoin Price Analysis (BTCUSD): October 17, 2022

There continues to be not much movement in crypto, with Bitcoin trading at around $19,500 currently. But the lack of movement is welcome after nearly a year of falling prices.

Bitcoin Gears Up For Big Move, But Which Direction?

Despite the lack of price action, daily timeframes are showing some signs of an impending breakout, possibly to the upside. The Bollinger Bands are once again tight as can be, which is a signal a big move is on the way. Bitcoin price is trying to push above the middle-BB which would increase the probability of upside if the bands begin to lift.

The daily LMACD is also just below the zero line. Pushing above it turns Bitcoin fully bullish on the daily timeframe. 

The Bollinger Bands suggest a big move is coming | Source: BTCUSD on TradingView.com
BTCUSD Downtrend Line Broken As Weekly Momentum Strengthens

Weekly momentum has also closed bullish for the second week in a row, opening with green momentum strengthening on the LMACD histogram. If bulls can close a third week in a row, a new uptrend should materialize. Note how during the last, failed attempt to break out, BTCUSD had weakening momentum and didn’t close beyond three bullish ticks.

Bitcoin price is also working on a breakout of weekly downtrend resistance. This is not the final downtrend resistance on log scale, but there is still significance here. The Relative Strength Index on weekly timeframes could be signaling an early breakout of multiple downtrend lines, which could soon lead to crypto making a move.

Is BTCUSD ready for a big breakout? | Source: BTCUSD on TradingView.com

Related Reading: Total Crypto Market Cap Meltdown | TOTAL Analysis October 12, 2022

Why A Reversing Dollar Means Upside For Crypto

A potential reversal could be in progress on the DXY Dollar Currency Index. The strength of the dollar has been what has beat up the stock market and crypto over the last several months. With the dollar losing a Relative Strength Index support line and confirming it as resistance just as a potential high timeframe evening star reversal forms on the DXY 2-week, Bitcoin has a chance at reversing as well.

Upon layering in BTCUSD behind the DXY, we can see immediately why a reversal in the DXY could be beneficial for Bitcoin. All while the DXY is potentially topping out, the 2-week Bitcoin line chart is breaking out from a falling wedge pattern. With less than 7 days left to go on the 2-week timeframe for both BTC and the DXY, the next week could prove to be bullish for cryptocurrencies and other risk assets as the dollar finally corrects.


The dollar breaking down could benefit crypto | Source: BTCUSD on TradingView.com

Learn crypto technical analysis yourself with the NewsBTC Trading Course. Click here to access the free educational program.

Follow @TonySpilotroBTC on Twitter or join the TonyTradesBTC Telegram for exclusive daily market insights and technical analysis education. Please note: Content is educational and should not be considered investment advice.

Featured image from iStockPhoto, Charts from TradingView.com

Total Crypto Market Cap Meltdown | TOTAL Analysis October 12, 2022

In this episode of NewsBTC’s daily technical analysis videos, we are looking at the total cryptocurrency market cap with Bitcoin being so boring. We also compare past crypto winters to see when the deep freeze might end.

Take a look at the video below:

VIDEO: Total Crypto Market Cap Analysis (TOTAL): October 12, 2022

There isn’t all that much new to report. Bitcoin and other cryptocurrencies continue to move mostly sideways, as the market awaits the CPI data release tomorrow at 8:30AM ET.

Why Crypto Winter 2022 Resembles 2015 Bear Market

Much like Bitcoin, there is a slow moving showdown to gain control over daily momentum, according to the LMACD. On weekly timeframes, Bitcoin only just turned bullish last week, while the total crypto market cap has been bullish for several months now.

Comparing the LMACD across past bear market bottoms shows that the indicator is behaving more similarly to the 2014 and 2015 bear market bottom. In 2018 and 2019, price action turned up sharply instead and the indicator followed.


Sideways momentum could mean many more months of pain | Source: TOTAL on TradingView.com
Total Cryptocurrency Fractal Shows Possible Price Action Preview

The price action in each drawn box is eerily similar. Taking the bars pattern to place a fractal over current price action, the setup is practically the same. If the total crypto market follows a similar trajectory, a strong breakout attempt will ultimately fail and lead to a double bottom formation.

Since the fractal projects price action forward, turning on the Ichimoku indicator which also looks into the future, is forecasting potential resistance right where the fractal would interact.

Will crypto winter remain until the cloud is broken? | Source: TOTAL on TradingView.com

Related Reading: Bitcoin Bulls Snap Back With The Bollinger Bands | BTCUSD Analysis October 5, 2022

Will The Downtrend Come To A Conclusion This Week?

However, there is no telling if this is indeed the bottom in cryptocurrencies, nor does anyone know if the market will behave like the last two bottoms. If not, and crypto continues down, the move could start this week.

The TD Sequential market timing tool has triggered a TD9 buy setup. However, the series is perfected only when the 9 candle makes a lower low. Note how past 9 candles on the way down lit up red and resulted in a deep move down. While this is possible, the TD9 setup is also a possible turning point where bulls could regain control.

A TD9 buy setup has appeared on weekly timeframes | Source: TOTAL on TradingView.com

Learn crypto technical analysis yourself with the NewsBTC Trading Course. Click here to access the free educational program.

Follow @TonySpilotroBTC on Twitter or join the TonyTradesBTC Telegram for exclusive daily market insights and technical analysis education. Please note: Content is educational and should not be considered investment advice.

Featured image from iStockPhoto, Charts from TradingView.com

The End of Bitcoin Woes? BTCUSD Analysis October 11, 2022

In this episode of NewsBTC’s daily technical analysis videos, we examine a possible bottoming scenario in Bitcoin price based on a potential expanded flat correction and an ending diagonal.

Take a look at the video below:

VIDEO: Bitcoin Price Analysis (BTCUSD): October 11, 2022

Bears and bulls are battling it out once again, each side trying to take control over daily momentum. Cycling through indicators like the Bollinger Bands and the Ichimoku show that Bitcoin isn’t looking very great at the moment. Only the Parabolic SAR is currently showing any type of indicator support below daily price action.

Why Bitcoin Could Spend Much More Time Moving Sideways

The LMACD shows that bulls still have the upper hand on the 3-day timeframe, and the last weekly candle closed with a confirmed bullish crossover on the same tool. The LMACD turning green from this level has put in the bottom during past bear markets.

But on monthly timeframes, bears have turned the histogram red after opening pink. Pink is a sign that bearish momentum is weakening. Unless Bitcoin stages an extremely fast reversal like 2018, there could be many more months of sideways ahead.

Comparing past bear market bottoms we can see that it took another 9 months after turning pink to flip green during the 2015 bear market, while it only took half that time during the 2018 bear market. With Bitcoin monthly momentum not even confirmed pink yet, the top cryptocurrency could have anywhere between 120 days and 275 days to go before things begin to turn around. Ouch.

Linear scale breakout leaves room leftover in log scale | Source: BTCUSD on TradingView.com
The End of The Expanded Flat Correction Is Near

In terms of a bottom, it could be near. Bitcoin appears to be finishing the last leg of an expanded flat correction. An expanded flat is an ABC correction with a higher high during the B wave, and a lower low at the C wave.

Expanded flats form in a 3-3-5 pattern, with two zig-zags and an impulse wave down. The C wave serves as the impulse wave with 5 sub-waves. Expanded flats typically terminate in the C wave at the 1.618 Fibonacci extension of the A wave. Taking the Fibonacci retracement tool set for the golden ratio extension, and the final wave five could be ending at the exact target.

Expanded flats commonly terminate with an ending diagonal in the fifth wave of the structure. An ending diagonal has five sub-waves itself, and looks like a falling wedge – a pattern that could be presently forming in Bitcoin if you turn on the line chart and remove wicks. With wicks removed, Bitcoin has made a new low below the wave 3 low, and could be in the midst of an ending diagonal before reversing.

The supplied diagrams show how the wave counts match up well enough, but is missing the final blow to bulls before the bottom is finally in. Don’t believe in such a thing as an ending diagonal? Check out how the same thing ended the bull market in 2021.

The MACD and linear scale (left) versus the LMACD and log scale (right) | Source: BTCUSD on TradingView.com

Related Reading: Bitcoin Bulls Snap Back With The Bollinger Bands | BTCUSD Analysis October 5, 2022

Where In The Overall Crypto Cycle Are We?

Finally, the last piece of the diagram we are comparing, is the placement of the expanded flat correction. Expanded flats appear either at a wave 2 or wave 4 during a larger impulse wave cycle. This means that either wave 5 is still left, or possibly waves 3, 4, and 5 remain.

In one scenario, Bitcoin bottomed in 2018, and the 2019 peak was wave 1, followed by wave 2 on Black Thursday. Then, wave 3 began in 2020 into 2021, and we’ve spent all of 2022 in wave 4 so far.

The alternate scenario makes the 2021 rally wave 1 of 5, and this current correction wave 2. The only way this is possible is if the entire 2018 bear market was part of a larger Elliott Wave triangle pattern. A triangle can be drawn, but it doesn’t quite fit the rules of Elliott Wave Theory.

Bitcoin probably has a lot more to go before a viable breakout | Source: BTCUSD on TradingView.com

Learn crypto technical analysis yourself with the NewsBTC Trading Course. Click here to access the free educational program.

Follow @TonySpilotroBTC on Twitter or join the TonyTradesBTC Telegram for exclusive daily market insights and technical analysis education. Please note: Content is educational and should not be considered investment advice.

Featured image from iStockPhoto, Charts from TradingView.com

Has Bitcoin Price Broken Out Of Downtrend Resistance? BTCUSD Analysis October 6, 2022

In this episode of NewsBTC’s daily technical analysis videos, we examine a possible breakout of Bitcoin price on linear scale. We also compare the breakout on logarithmic scale to determine if the signal might be a reliable sign the bottom could be in.

Take a look at the video below:

VIDEO: Bitcoin Price Analysis (BTCUSD): October 6, 2022

Is This The Bitcoin Breakout We’ve Been Waiting For?

Bitcoin price has broken out of an important downtrend line on linear scale. The downtrend line connects the peak at $68K, the top in March at $48K, and several recent rejections. On the lowest timeframes, Bitcoin has pushed outside of this diagonal sloping trend line.

Before bulls begin to celebrate, BTCUSD is best charted on logarithmic scale. Switching to log scale immediately makes the trend line seem obsolete. Moving the trend line across the same turning points in the market, produces a lot less steep of a downtrend line.

Linear scale breakout leaves room leftover in log scale | Source: BTCUSD on TradingView.com
BTCUSD Momentum Comparison Using The MACD And LMACD

The standard MACD tool also makes sense to use with a linear scale chart. But if you want more direct comparisons of momentum across larger time scales, you also need to use a logarithm version of the tool. Using the regular MACD to compare past price action isn’t practical.

The LMACD also tends to provide more reliable signals. For example here, Bitcoin has already crossed bullish on the MACD long ago, while the LMACD is only about to confirm after several more weeks of sideways.

The MACD and linear scale (left) versus the LMACD and log scale (right) | Source: BTCUSD on TradingView.com

Related Reading: Bitcoin Bounce Coincides With Possible Macro Reversal | BTCUSD Analysis October 4, 2022

Why The Log Scale Shows Several More Weeks Of Crypto Winter

A historical view of linear scale versus log scale shows the difference between the two types of charts across BTCUSD price action. On the linear chart, anything prior to 2017 looks like a flat line, meanwhile there were price swings of thousands of percent up and 80 to 90% down several times over. But again, there is that breakout.

Comparing the same type of breakout during past bear markets shows that there is very little significance on linear scale. In 2018, BTC broke out of several downtrend resistance lines, only to form new ones. In 2014, BTC made it out of the downtrend, only to later retest the line as resistance turned support.

Diagonal downtrend lines in log scale are endlessly more reliable. The log downtrend lines in linear scale show that Bitcoin has a lot more to go before it breaks free of this crypto winter.

Bitcoin probably has a lot more to go before a viable breakout | Source: BTCUSD on TradingView.com

Learn crypto technical analysis yourself with the NewsBTC Trading Course. Click here to access the free educational program.

Follow @TonySpilotroBTC on Twitter or join the TonyTradesBTC Telegram for exclusive daily market insights and technical analysis education. Please note: Content is educational and should not be considered investment advice.

Featured image from iStockPhoto, Charts from TradingView.com

Bitcoin Bulls Snap Back With The Bollinger Bands | BTCUSD Analysis October 5, 2022

In this episode of NewsBTC’s daily technical analysis videos, we look at the latest move up in Bitcoin price using the Bollinger Bands across a variety of timeframes and explain why a close above the upper band could lead to a larger move to the upside.

Take a look at the video below:

VIDEO: Bitcoin Price Analysis (BTCUSD): October 4, 2022

Bitcoin price had another decent sized move up to above $20,000 after continuing to respect a rounded trendline. 

Biblical Bear Market Bottom Pattern Is Back

The rounded bottom would be the second half of an Adam and Eve double bottom formation. This is the same pattern that resulted in the 2018 bear market bottom and is characterized as a V-shaped correction followed by a slower rounded bottom.

Is another bear market bottom building? | Source: BTCUSD on TradingView.com
Crypto Market Gears Up To Ride The Bands

Bitcoin’s latest move up is particularly notable due to the daily close taking place outside of the upper Bollinger Band. As you can see from the last time this happened, it can lead to a strong rejection back to the mid-BB. Holding above this level could lead to a larger move to the upside.

Expansions in volatility are most important and worth paying attention to, as the tool’s creator would probably say himself. When the Bollinger Bands squeeze, it is a sign of low volatility – a short-lived phase that always ends with a bang and large move.

Closing today’s daily above around $20,350 should do the trick and keep Bitcoin above the upper band. If not, the next logical target is likely the middle-band at $19,400. 

Will Bitcoin ride the bands higher? | Source: BTCUSD on TradingView.com

Related Reading: Is Bitcoin ‘Uptober’ About To Begin? | BTCUSD Analysis October 3, 2022

Monthly Bollinger Bands Give Two Possible Targets

The monthly Bollinger Bands were tapped for the first time in Bitcoin history during this bear market. This suggests that Bitcoin price is extremely low relative to monthly price action historically and it could imply a buying opportunity. 

The lower band is drifting downward, which means if Bitcoin continues downward also, the next target could be as low as $12,000 before more dynamic support is found. If Bitcoin heads back toward the upper band, $60,000 BTC is the target instead, making the setup decent in terms of risk versus reward.

However, if Bitcoin can maintain upward momentum, a new uptrend could confirm. The TD Sequential isn’t just helpful for finding potential turning points when the series reaches a 9 or 13, a new 1 can often signify the start of a new uptrend and is yet another important signal.

Does the 1 signify a new uptrend forming? | Source: BTCUSD on TradingView.com

Bitcoin And Nasdaq Form Potentially Bullish Q3 Candle

When the September monthly candle closed it also closed the third quarter of the year. Q3 left a doji on the Bitcoin price chart. Doji show a point of indecision and because of this, they are often found prior to a reversal, or prior to strong continuation.

A high timeframe morning star doji could bring the reversal bulls need and would support a monthly push to $60,000 within the next three months. Whether BTC can hold above that level or not remains to be seen.

It is worth noting that larger hedge funds and institutional investors take positions based on a quarterly basis, which could explain why markets sharply reversed to start the month of October. On the right, the Nasdaq also formed a bullish inverted hammer on the quarterly, which also could be a sign that Q4 is profitable for risk assets like crypto and tech stocks.

Are these reversal signals on the BTC and NDX quarterlies? | Source: BTCUSD on TradingView.com

Learn crypto technical analysis yourself with the NewsBTC Trading Course. Click here to access the free educational program.

Follow @TonySpilotroBTC on Twitter or join the TonyTradesBTC Telegram for exclusive daily market insights and technical analysis education. Please note: Content is educational and should not be considered investment advice.

Featured image from iStockPhoto, Charts from TradingView.com

Bitcoin Bounce Coincides With Possible Macro Reversal | BTCUSD Analysis October 4, 2022

In this episode of NewsBTC’s daily technical analysis videos, we compare Bitcoin price with the S&P 500, WTI Crude Oil, Gold, and the almighty dollar through the DXY.

Take a look at the video below:

VIDEO: Bitcoin Price Analysis (BTCUSD): October 4, 2022

Bitcoin price is back over $20,000 and you can finally feel the sentiment starting to change. The change is happening all across the rest of finance, and not just crypto, which is the focal point of this video.

Stock Market Correlation With Crypto Continues

To start, comparing the S&P 500 against Bitcoin, shows that Bitcoin tends to top out prior to the stock market. Importantly, BTC and the SPX have been more tightly correlated than in the past. 

This is notable because along with Bitcoin, US stock indices have turned sharply up. Both asset classes are down considerably from all-time highs, so this is nothing yet to celebrate.

Bitcoin tops well ahead of the SPX | Source: BTCUSD on TradingView.com
Oil Slips Slightly After BTC, But Turning Up Sharply

In yet another macro comparison with WTI Crude Oil, we can see that oil tends to trail crypto and stocks slightly. 

Oil prices tend to fall even more sharply than crypto during corrections, but are fewer and further between. Oil prices are also turning up sharply at the same time as Bitcoin and the stock market.

Oil bounce harder from Black Thursday than BTC | Source: BTCUSD on TradingView.com

Related Reading: Bitcoin And The Golden Ratio Bottom | BTCUSD Analysis September 29, 2022

Will The Digital Gold Narrative Return?

Comparing gold against the top cryptocurrency by market cap, we can see that the bullish impulse that began in 2019 in gold kept running far beyond what Bitcoin was capable of. Despite this, this was the birth of the digital gold narrative, as trade tensions between the US and China increased under the Trump administration. 

With currencies beginning to fall apart across the globe, gold is also suddenly rebounding alongside stocks, oil, Bitcoin, and other assets.

Has Bitcoin bottomed at the cost of production? | Source: BTCUSD on TradingView.com

Bitcoin Versus The Dollar Gets Interesting

If the value of all assets priced in USD suddenly are surging all at once, it probably has more to do with the strength of the dollar side of each trading pair. As the global reserve currency, all other assets are quoted in the dollar as a standard measure. 

The dollar is retreating after its most overextended rally in years. Other currencies have been plummeting against the USD side of the trade, but central bankers have stepped in to save their currencies and it possibly prompted a reversal in the dollar.

The UN has also stepped in asking the Fed to help calm the volatility in markets and bring relief to the rest of the world.

When comparing the DXY with crypto, bull market peaks in Bitcoin coincide with the DXY beginning to rise. The recent downtrend in Bitcoin was brought about by one of the most vertical uptrends in DXY history. 

The move was similar in strength and length as the move in the dollar that caused the 2014 and 2015 bear market in Bitcoin. After another failed attempt at new highs, the DXY was rejected. The two events lead to what was possibly the greatest cryptocurrency uptrend in history, and was what made Bitcoin a household name.

What happens this time? And is it all starting now?

Will Bitcoin have another incredible rally? | Source: BTCUSD on TradingView.com

Learn crypto technical analysis yourself with the NewsBTC Trading Course. Click here to access the free educational program.

Follow @TonySpilotroBTC on Twitter or join the TonyTradesBTC Telegram for exclusive daily market insights and technical analysis education. Please note: Content is educational and should not be considered investment advice.

Featured image from iStockPhoto, Charts from TradingView.com

Is Bitcoin ‘Uptober’ About To Begin? | BTCUSD Analysis October 3, 2022

In this episode of NewsBTC’s daily technical analysis videos, we review a variety of technical and fundamental signals on the Bitcoin price monthly chart to see if we are getting closer to a bottom in crypto.

Take a look at the video below:

VIDEO: Bitcoin Price Analysis (BTCUSD): October 3, 2022

The monthly closed with a doji candle, which typically forms at a point of indecision before either a reversal, or strong continuation. Past monthly dojis have commonly preceded short- and long-term turning points in crypto. The September monthly candle was the first ever monthly close below Bitcoin’s former all time high set back in December of 2017. 

Although Bitcoin was clearly overvalued back then, it is hard to imagine in today’s world that the top cryptocurrency is still overvalued a full five years later.

Bearish BTC Momentum Begins To Wane… Maybe

The October monthly candle opened with pink on the LMACD histogram. This signal in the past put bear markets back into hibernation mode for at least a year or more, and suggests a major shift in momentum. But October must close bullish to confirm and cement the change in color on the Bitcoin monthly chart.

The monthly Relative Strength Index remains the lowest in Bitcoin history, but is grinding along the bottom of a downward sloping channel. The same downward slope has connected past RSI peaks.

Bitcoin bearish momentum might be weakening | Source: BTCUSD on TradingView.com
Bitcoin Investors Could Be Getting Over Their Loss

The Coppock Curve has also finally touched down at the same level where past bear market bottoms have occurred. Time cycle tools also suggest there could be some rhythmic behavior to Bitcoin that is about to unfold.

The Coppock Curve was created by E.S.C. Coppock, who was asked by his church to identify long-term buying opportunities for investors. It is based on the idea that it takes between 11 and 14 months for a bear market to end, as that’s roughly how long it takes for a human to get over mourning a significant loss.

Bear markets take at minimum 14 months | Source: BTCUSD on TradingView.com

Related Reading: Bitcoin & The Global Currency Meltdown | BTCUSD September 28, 2022

Did Satoshi Call The Bottom In Crypto?

Another possible bottom signal isn’t technical, but fundamental. Bitcoin price has now been in the lower range of the cost of production at about the same length of time as the 2018 bear market bottom.

This is notable, because in commodities, prices bottom out near the cost of production. Even Bitcoin’s creator, Satoshi Nakamoto spoke of this.

“The price of any commodity tends to gravitate toward the production cost. If the price is below cost, then production slows down. If the price is above cost, profit can be made by generating and selling more. At the same time, the increased production would increase the difficulty, pushing the cost of generating towards the price.”

Has Bitcoin bottomed at the cost of production? | Source: BTCUSD on TradingView.com

Learn crypto technical analysis yourself with the NewsBTC Trading Course. Click here to access the free educational program.

Follow @TonySpilotroBTC on Twitter or join the TonyTradesBTC Telegram for exclusive daily market insights and technical analysis education. Please note: Content is educational and should not be considered investment advice.

Featured image from iStockPhoto, Charts from TradingView.com

Bitcoin And The Golden Ratio Bottom | BTCUSD Analysis September 29, 2022

In this episode of NewsBTC’s daily technical analysis videos, we examine how Bitcoin might have bottomed precisely at the 1.618 Fibonacci extension, using Elliott Wave Theory.

Take a look at the video below:

VIDEO: Bitcoin Price Analysis (BTCUSD): September 29, 2022

Using the Fibonacci retracement tool not for retracement but for extensions, we have found a golden discovery using math.

Did Bitcoin Bottom At The Golden Ratio?

In Elliott Wave Theory, corrections come in ABC patterns. Taking the Fibonacci retracement tool to draw from the bottom to the top of the A wave will provide a Fibonacci extension target for where a C wave correction might end. The wick down to $17K touched precisely at the 1.618 Fibonacci with pinpoint accuracy.

1.618 is the golden ratio, also known as the divine proportion.

Bitcoin downtrend stops at precisely the golden ratio | Source: BTCUSD on TradingView.com
Past Bear Market Bottoms Pinpointed With Golden Accuracy

Shocked by this discovery, we used the same strategy to examine the 2018 bear market. Lo and behold, the target terminated at the golden ratio yet again. To demonstrate this, we have drawn in the B wave descending triangle, and taken the Fibonacci extension from the bottom of the A wave to the top where it began. As you can see, this projected the bear market bottom perfectly.

Zooming out further, could this really have happened in the 2015 bear market also? Adding yet another ABC correction, the same pattern fits, albeit not quite as precisely at the rest of the analysis. Still, its accurate enough where the golden ratio could clearly be a factor in where Bitcoin ultimately bottoms.

Bitcoin has bottomed at the golden ratio in each bear market | Source: BTCUSD on TradingView.com

Related Reading: Bitcoin & The Hunt For A Green October | BTCUSD September 27, 2022

Could Fibonacci Project The Next Major Peak In Crypto?
We now know that projecting extensions from the A wave gives us the C wave bottom… hopefully. But how does this work when projecting a target to the upside? Drawing from the 2017 peak to the bear market bottom, projected the top of the 2021 bull market.

If the same is true for the next bull market, much like each bear market has repeated, the golden ratio could take Bitcoin to a price of more than $161,000 per coin. 

The next Bitcoin peak could be over $161,000 per coin | Source: BTCUSD on TradingView.com

Learn crypto technical analysis yourself with the NewsBTC Trading Course. Click here to access the free educational program.

Follow @TonySpilotroBTC on Twitter or join the TonyTradesBTC Telegram for exclusive daily market insights and technical analysis education. Please note: Content is educational and should not be considered investment advice.

Featured image from iStockPhoto, Charts from TradingView.com

Bitcoin & The Global Currency Meltdown | BTCUSD September 28, 2022

In this episode of NewsBTC’s daily technical analysis videos, we examine how Bitcoin is trading against other currency pairs and not USD. We also look at BTC against WTI Crude Oil and the S&P 500.

Take a look at the video below:

VIDEO: Bitcoin Price Analysis (BTCUSD): September 28, 2022

The market continues to be shaken up by the strength of the dollar. Following yesterday’s rally in BTC that was immediately wiped out, traders are even more hesitant to pull the trigger with the top cryptocurrency rising again.

Bitcoin Daily Momentum Change Causes Chain Reaction

Bitcoin daily has flipped bullish on the LMACD, setting off a chain reaction across a variety of timeframes. In terms of this chain reaction, we have a bullish crossover on the 3-day and the weekly timeframe. Both, especially the weekly, have been like bait, snapping back at bulls each time they attempt to turn the tides of momentum.


Momentum causes a bullish chain reaction of crossovers | Source: BTCUSD on TradingView.com
How BTC Fares Against Other World Currencies

The DXY Dollar Currency Index is the dollar trading against a weighted basket of top national currencies. These currencies include the British pound sterling, the euro, the Canadian dollar, Japanese yen, Swedish krona, and Swiss franc.

Due to the enormous shakeup and volatility in global currency markets, we put Bitcoin up against other currencies and not the standard USD pair.

As you can see, the pound, euro, canadian dollar, and Japanese yen all crossed bullish weeks prior, while the USD pair struggles to do so. Other strong national currencies like the Swedish krona and Swiss franc have yet to cross over much like the dollar. 

Bitcoin could be bottoming against several top currencies | Source: BTCUSD on TradingView.com

Related Reading: Bitcoin Shows Resilience In Dollar-Driven Bloodbath | BTCUSD September 26, 2022

Comparing The Top Crypto To The S&P 500 And WTI Crude Oil

Continuing the deep dive into unorthodox Bitcoin charts, we’ve combined the charts of BTCUSD and the SPX. This unique chart shows that Bitcoin never made a higher high in late 2021, and the downtrend began with the April peak. This chart also is flipping bullish and has a weekly close confirming the crossover.  Bullish momentum will need to grow to sustain a rally.

Next, we’ve compared Bitcoin to what could be the most important macro asset globally: oil. In this comparison, much like the SPX example, we put BTCUSD up against WTI Crude Oil. WTI Crude oil is American produced oil from West Texas Intermediate. 

In this oddball trading pair, Bitcoin also had a lower high and a much steeper downtrend. However, Bitcoin flipped bullish against oil several weeks ago, but has yet to produce a meaningful upside move. Is such a move coming soon enough?

Bitcoin has crossed bullish against the SPX and WTI Crude Oil | Source: BTCUSD on TradingView.com

Learn crypto technical analysis yourself with the NewsBTC Trading Course. Click here to access the free educational program.

Follow @TonySpilotroBTC on Twitter or join the TonyTradesBTC Telegram for exclusive daily market insights and technical analysis education. Please note: Content is educational and should not be considered investment advice.

Featured image from iStockPhoto, Charts from TradingView.com