XRP Price Historical Data Suggests Substantial Q4 Rally Possible

XRP price might have struggled to leave the $0.50 range over the last several months, even despite a victory in Ripple’s case with the SEC. 

But all that could change in Q4 2023, as the fourth quarter of the year is historically the most bullish for the altcoin.  With this in mind, let’s dig into the data and see how Q4 stacks up against the historical performance of other quarters of the year. Plus, we’ll pin-point precisely which month is by far the most bullish of them all. 

Q4 Performance Is The Best Historically For XRP Price

XRP price at the moment is trading at around $0.51 after a fierce rejection following Ripple’s big win in the case against the SEC. The altcoin was promptly relisted on top cryptocurrency exchanges, but it hasn’t led to the demand necessary to sustain higher prices. 

But that could change soon, now that Q3 is over and Q4 is here. The cryptocurrency is coming out of its worst quarter on average, so lack of performance isn’t too surprising. Q4, however, according to historical averages in performance across all quarters, is by far the most substantial. 

XRP price quarterly returns

Q4 on average has provided an average of 30% ROI. Right behind it is Q2, posting roughly 22% ROI. Q1 averages a modest 13%, while Q3 comes in last with only 6% on average. There’s no guarantee this data will translate into returns during this last quarter of the year, but seasonality and serial correlation are common in finance and cryptocurrencies. 

Why It Could Take Til December For The Bull Run To Begin

Unfortunately, October isn’t the beginning of a massive bull run the previous text makes it sound. While the data doesn’t lie — XRP price performs the best historically in Q4 on average, but Q4 represents October through the end of December. 

On a month-by-month basis, October is actually the third worst month on average. If the same positive seasonality in XRP were to follow along the data’s projections accurately, then it would also suggest that October might be another month of pain and sideways for investors. 

XRP price monthly results

At an almost 12% gain in November on average compared to October’s 1.5% average decline, the second to last month of the year will turn things green. But even November isn’t quite the relief XRP holders would hope for.

That doesn’t arrive until December, which is by far and away the best month on average for XRP, with an 80% ROI on average. The one caveat, is that the majority of the returns occurred during the 2017 bull market, potentially skewing the results. Removing the outlier from the data would almost certainly change the results significantly.

Ethereum News Catalyst Could Trigger Triangle Breakout To $4,000

Could bullish Ethereum news related to the launch of an ETH futures ETF be the catalyst that triggers a massive breakout of a nearly 16-month long ascending triangle pattern?

If the pattern is valid, the target is roughly $4,000 per ETH and a revisit to former all-time highs from the last bull market.

VanEck Announces ETH Futures ETF

Global asset manager VanEck, known best for its ETFs and Mutual Funds, today revealed the upcoming launch of the VanEck Ethereum Strategy ETF (ETUF).

ETUF will be “an actively managed ETF designed to seek capital appreciation by investing in Ether (ETH) futures contracts.”

Rather than investing in spot ETH, the Fund will trade Chicago Mercantile Exchange (CME) ETH futures, and will be managed by the firm’s Head of Active Trading, Greg Krenzer.

ETUF will trade on CBOE alongside VanEck’s Bitcoin Strategy ETF (XBTF). And although its inception of November 15, 2021 marked the end of the bull market in crypto, the introduction of Ethereum futures has the potential to kickstart the next bull run.

ethereum news ascending triangle

Ethereum News Catalyst Could Trigger Ascending Triangle Breakout

Show me the chart and I’ll tell you the news, is a famous quote from the late Bernard Baruch. The message reflects the fact that the largest technical moves tend to coincide with a news catalyst and vice-versa.

Essentially, the a bullish chart pattern could possibly appear before positive news – such as the launch of an ETH futures ETF – while the news itself is the catalyst for a strong breakout.

This is precisely what appears to be brewing in ETHUSD charts since June of 2022. Unlike Bitcoin which put in a bottom late in 2022, Ethereum found support about halfway through the year. Since then, Ether has consistently made higher lows, forming a potential ascending triangle chart pattern.

Now, the ascending triangle pattern is nearing the two-thirds point from its apex. This increases the chances of a breakout occurring as an Ethereum futures ETF gets launched have increased significantly. All that’s required is a breakout above $2,000 per ETH on higher than normal volume. Based on the measure rules, reaching the target objective could push prices to over $4,000.

Bitcoin Bulls Could Buck Downtrend With Move To $42,000

Bitcoin price is back above $27,000 per coin after holding firm at $25,000 for a second time.

If price fails to move below support and makes another run for resistance, bulls might finally buck the downtrend with a powerful, measured move to $42,000.

Recapping 2023 Using Classical Technical Analysis Methods

2023 thus far has been the year that Bitcoin went mostly sideways. The year began with a strong surge from bear market lows, but failed to instill enough confidence for instant continuation. Even an inverse head and shoulders pattern has yet to produce the expected upside target.

Instead, BTCUSD has spent months and months going sideways, unable to break above $31,000 or below $25,000 per coin. With the top cryptocurrency finding support at $25,000 a second time, bulls might finally be emboldened.

Using classical charting methods such as a the inverse head and shoulders neckline support and a simple downtrend line, we can begin to understand the technical explanation for the pause around this zone.

bitcoin target

The Tale Of Two Retest And The $42,000 Target

It is common of an inverse head and shoulders pattern for price to throw back to former neckline resistance and retest it as support. This allows buyers to get in at lower levels, while those who bought earlier take profit.

After a retest, Bitcoin made a substantial move up breaking through a downtrend line drawn from all-time highs. However, the confidence was still not enough for proper follow through, so Bitcoin fell back to $25,000 to test the downtrend line it broke out from.

With the level tested now twice and proving to be seemingly unbreakable, bulls might finally have the confidence to meet the target of the inverse head and shoulders pattern. This target is located at $42,000 per BTC.

This chart originally appeared in Issue #21 of CoinChartist (VIP), where several other Bitcoin price charts demonstrate confluence with the target. Subscribe for free to view the rest of the Bitcoin charts.

Dogecoin Price Prediction for 2023, 2024, 2025, 2030 & Beyond

Dogecoin has been one of the most surprising and discussed cryptocurrencies since its launch in 2013. Its meme-inspired origins and 2021 hype led to spectacular price rises. This Dogecoin price prediction article analyzes factors impacting the coin’s value and predicts its future trajectory.

What is Dogecoin?

Dogecoin (DOGE) is a cryptocurrency that started as a joke based on the popular Doge meme in 2013. Software engineers Billy Markus and Jackson Palmer created it satirizing the hype surrounding cryptocurrencies.

But what began as a parody became one of the largest cryptocurrencies. DOGE runs on its own blockchain with miners validating transactions. Key features include:

Meme-inspired

The Shiba Inu dog from the Doge meme is its mascot. This makes it more approachable for mainstream investors, as does its low price compared to other assets.

Large supply

Over 140 billion DOGE have been mined so far compared to Bitcoin’s limit of 21 million.

Low price per coin

Due to the high circulation supply, DOGE trades at a fraction of a dollar making it attractive for first-time investors.

Faster transactions

DOGE offers faster payments than Bitcoin with 1 minute block times.

Tipping currency

The DOGE community utilizes it extensively for tipping and donations, especially on Reddit and Twitter.

While DOGE lacks the sophistication of platforms like Ethereum, its brand awareness makes it appealing as a payment option. Major companies like AMC Theatres and the Dallas Mavericks basketball team accept DOGE payments.

Factors Impacting Dogecoin Price

Several key factors influence DOGE’s notably volatile prices:

Celebrities and Billionaires

Public figures like Elon Musk and Mark Cuban endorsing DOGE carry outsized influence, drawing in retail investors and moving its price.

Media Hype

Attention from mainstream media outlets drives up interest and prices rapidly as seen in early 2021. But it works both ways, with DOGE falling out of favor just as fast.

Meme Power

As a meme-based asset, DOGE trends on social media significantly impact its price as hype spreads or fades. The community plays a central role.

Development Activity

While work has slowed, some upgrades like lower fees have the potential to improve DOGE adoption if development regains momentum.

Broader Crypto Market

Like most altcoins, DOGE price depends heavily on Bitcoin’s price action. When Bitcoin crashes, memecoins like DOGE usually crash harder.

Competitors

An endless stream of new memecoins like Shiba Inu and Pepe compete for investors’ attention and dollars, which impacts DOGE market share.

Historical Dogecoin Price Timeline

Looking at major developments in DOGE’s history sheds light on patterns governing its volatile price.

2013 – The Joke Begins

Dogecoin was created as a “joke currency” by programmers Billy Markus and Jackson Palmer in December 2013. The price remained extremely low, trading for a tiny fraction of a penny during the first year.

2014-2016 – Gaining Attention

DOGEUSD_2023-09-14_15-04-45

In 2014, DOGE gained more mainstream attention during the Doge meme’s resurgence, with its market cap reaching over $60 million by end of 2014.

Dogecoin was used extensively for charitable fundraisers and tipping on Reddit/Twitter. But the price remained under one cent between 2014-2016.

2017 – Bull Run Ride

DOGEUSD_2023-09-14_15-06-17

When crypto markets boomed in 2017, DOGE saw massive gains fuelled by speculation, rising from $0.0002 and peaking at $0.018 in January 2018 – a 9,000 percent rise in 2 months!

But it crashed soon after, dropping 90% in just over a month following the broader crypto downturn. Still, DOGE had proven it couldn’t be ignored.

2018-2020 – Slump Despite Growing Adoption

DOGEUSD_2023-09-14_15-07-23

During the 2018-2020 bear market, DOGE struggled to gain traction again. Its price declined gradually losing over 90% of its value and falling below $0.002 in early 2019.

However, real-world payment adoption grew with providers like CoinPayments, LivingRoomOfSatoshi, and Bitpay supporting DOGE payments on e-commerce sites.

2021 – Rocketing to Fame

DOGEUSD_2023-09-14_15-08-01

The 2021 bull run, especially Elon Musk’s repeated endorsements of DOGE, sent it rocketing from under one cent in January 2021 to an astonishing high of $0.7 in May 2021 – a truly unbelievable 40,000% return in four months!

Other key drivers included:

  • Mainstream media coverage during the price surge. DOGE graced the covers of Newsweek and Time Magazine.
  • Increased crypto adoption, especially among retail investors using platforms like Robinhood
  • Major brands like Snickers and Slim Jim referenced DOGE on social media, amplifying the hype.
  • Mark Cuban’s Dallas Mavericks began accepting DOGE as payment.
  • Exchange listings like eToro adding DOGE stoked investor interest.

Like past cycles, such parabolic rises proved unsustainable. DOGE dropped steadily after the frenzied peak, closing the year at around $0.15. Still an impressive overall return for 2021.

2022 – Price Crash Despite Celebrity Involvement

DOGEUSD_2023-09-14_15-08-57

The 2022 crypto bear market hit DOGE hard, causing it to shed over 90% of its value, dropping below $0.05 by June 2022.

Attempts were made to revive interest, including Elon Musk’s announcement that SpaceX would accept DOGE payments for merchandise purchases. Mark Cuban’s basketball team continued accepting DOGE as payment.

But macroeconomic headwinds have kept prices depressed close to all-time lows, highlighting the weakness of memecoins during downturns.

Recent Dogecoin Price Action

2023 hasn’t been much friendlier to Dogecoin, with the cryptocurrency unable to make it above the $0.10 level and is back trading at $0.06 and is at risk of new lows.

Short-Term Dogecoin Price Prediction for 2023

Short-Term Dogecoin Price Prediction 2023

DOGE outlook remains ambiguous for 2023 as the crypto markets struggle to regain footing after the FTX fallout. The meme coin remains locked in a downtrend, with the next level of support back down at under a penny. While this might feel impossible, Bitcoin retested its former 2017 all-time high, which is at the same precise point as the 1.618 Fibonacci extension target. If Dogecoin can hold the current lows, it could retarget the 0.618 or 0.382 retracement level. 

Medium-Term Dogecoin Price Prediction 2024 – 2025

Medium-Term Dogecoin Price Prediction 2024 2025

If Dogecoin can break out of its downtrend and prevent further collapse, the next logical target is the 1.618 upside Fibonacci extension. If you notice, DOGE touched this target in the previous two bull markets. In 2021, DOGE extended even further to the 2.414 Fibonacci. The 1.618 Fib extension would put Dogecoin above $3.60.

Long-Term Dogecoin Price Forecast 2030

Long-Term Dogecoin Price Prediction 2030

Predicting the future of a meme cryptocurrency is challenging. However, using a linear mean trajectory drawn through each cycle, we can estimate that Dogecoin could be anywhere between $1.50 and $5 by the time 2030 rolls around. This model assumes no catastrophic failure of the blockchain.

Dogecoin Price Predictions – Conclusion

Despite gaining immense popularity and value during the 2021 hype, Dogecoin lacks the real-world utility and institutional investment of leading cryptocurrencies like Bitcoin and Ethereum.

Unless Dogecoin evolves beyond its meme-based appeal through protocol development and real use cases, it appears set to remain as a highly speculative asset prone to boom and bust cycles based on hype.

While another frenzy-driven price surge cannot be ruled out, Dogecoin’s sustainability as a long-term store of value remains doubtful according to most analysts. Traders and investors should tread cautiously with appropriate risk management.

Dogecoin Price Prediction FAQs

Here are some frequently asked questions about DOGE price prediction targets:

What was Dogecoin’s lowest price?

During its initial days in 2013-2014, DOGE hit lows of $0.0001-0.0002 on crypto exchanges. Its recent low was $0.044 in June 2022.

What was Dogecoin’s highest price?

DOGE hit an all-time high of $0.7376 during the 2021 frenzy phase in early May, rising astronomically from $0.005 in January 2021.

How high can DOGE realistically go?

Considering its past performance driven heavily by hype and celebrity endorsements, DOGE may potentially reach up to $1 temporarily during frenzied market conditions, but has poor fundamentals for sustaining high valuations long-term.

Can DOGE crash to zero?

While unlikely due to its enduring popularity as a memecoin and brand recognition, Dogecoin crashing to near-zero cannot be completely ruled out without renewed development and adoption efforts.

Why is DOGE so volatile?

Extreme volatility is built into Dogecoin’s DNA as a meme asset heavily dependent on social media hype and investor speculation rather than fundamental utility value.

When will Dogecoin’s price stabilize?

DOGE price is likely to remain volatile until (and if) it can mature beyond its “joke coin” origins and develop greater real-world utility and stable demand.

Bitcoin Weekly TD Sequential Buy Setup Appears, But Warns Of Potential Risk

Bitcoin price keeps falling, now pushing down against support at $25,000 per coin. The recent sweep of lows has resulted in a perfected TD9 buy setup according to the weekly TD Sequential indicator.

Although this sounds positive for crypto, if the signal fails, there is risk of an extreme drop ahead. Here is a closer look at why.

Is The TD Sequential Telling Us To Buy The Dip In Bitcoin?

Things are improving for Bitcoin price action, but the situation surrounding altcoins and the increasingly negative macro environment has kept upside momentum at bay. The result over the last several weeks has been another BTCUSD downtrend. This series of down weeks has satisfied a specific sequence required to trigger a TD9 buy setup.

bitcoin TD buy setup

Even more important, the signal has been “perfected” now that price has made a lower low on weekly timeframes. The TD Sequential is a market timing indicator created by Thomas DeMark, which can be used to potentially time reversals. However, when a buy signal fails, the move down can be dramatic.

The last time there was a perfected TD buy setup series in the same timeframe, Bitcoin was priced at $42,000 per coin. There was a short-lived recovery, but a more than 50% collapse followed due to the buy setup failure.

If the buy setup doesn’t fail here, Bitcoin should reverse before the week is over, resuming its prior bullish 2023 uptrend.

BTCUSD_2023-09-11_13-44-28

A Broader Look At The Brewing BTC Trend

Upon zooming out, we can also see that Bitcoin’s uptrend from $3,000 is still intact, according to TDST support located at $10,376. TDST support only moves up when a TD series is perfected to the upside and a sell setup triggered. Instead, the perfected TD9 buy setup has renewed TDST resistance at $30,419.

Former TDST resistance was located at $25,250, which is potentially being retested now. Based on what the technical indicator tells us, is that Bitcoin is facing a critical inflection point in terms of timing and price level combined. However the dust settles could determine the future trend for the remainder of the year.

Will this TD buy setup lead to a reversal, or further failure for bulls to establish a new bull market?

Solana (SOL) Price Prediction: 2023, 2024, 2025 and Beyond

Solana is one of the fastest growing cryptocurrency platforms thanks to its high speed and low costs. Launched in 2020, its native SOL token has seen massive appreciation.

Here we analyze Solana’s price outlook for the future using technical analysis to provide an evidence-based Solana price prediction guide.

What is Solana (SOL)?

Solana is a highly scalable decentralized blockchain created by Anatoly Yakovenko in 2017. It uses a unique proof-of-history consensus mechanism to achieve high transaction speeds and low fees while maintaining security.

The native cryptocurrency of the Solana network is SOL. It is used to pay for executing transactions, interacting with smart contracts, and staking on the blockchain.

Some key aspects of Solana include:

Speed

Solana can process over 50,000 transactions per second, significantly faster than Bitcoin or Ethereum.

Low fees

With high speed, Solana offers transaction costs as low as $0.00025 making it ideal for DeFi.

Proof-of-History

This novel consensus mechanism coordinates timeline between nodes without slowing things down.

Programming

Solana supports programming languages like Rust and C++ to develop dApps.

Staking

SOL holders can stake tokens to help validate transactions while earning staking rewards.

Solana’s powerful performance makes it a leading choice for developing fast, scalable DeFi applications and services.

Factors Influencing Solana Price

Several core factors determine the price movement and growth potential of SOL:

Cryptocurrency Market Conditions

Like most altcoins, Solana’s price depends significantly on Bitcoin and overall crypto market trends. A rising market lifts SOL.

Adoption by Developers

As more projects build DEXs, NFT marketplaces, Web3 applications etc on Solana, demand for SOL increases.

Competition From Rival Networks

Alternative scalability solutions like Avalanche, Polkadot or Cardano could fragment developer interest and diminish Solana’s growth potential if they gain traction.

Network Upgrades and Innovation

Upgrades to further boost Solana’s speed and capabilities can augment developer demand, boosting SOL’s value.

Staking Trends

Higher staking activity reduces available SOL supply which may lead to appreciation in token price.

Security and Reliability

Network outages or vulnerabilities could damage confidence in Solana and depress SOL price. Smooth performance boosts its reputation.

Major Historical Price Developments

SOL’s price has seen huge growth since launching, but also periods of instability. Let’s look at key highlights:

2020 – Minimal Trading After Launch

SOLUSD_2023-09-05_12-31-45

Solana launched the mainnet in March 2020 with SOL starting off around $0.50 initially with minimal exchange availability and trading. By December 2020, it reached $1.52 as trading volumes gradually picked up.

2021 – Massive Breakout

SOLUSD_2023-09-05_12-32-09

The 2021 crypto bull run catapulted Solana into the limelight with SOL surging exponentially from $3 in January 2021 to a peak of $260 by November 2021 – an unbelievable 8700% return within 10 months!

Driving this were:

  • Explosive growth of DeFi and NFT activity on Solana, riding the hot trends.
    Attracting developers due to faster speeds and lower costs than Ethereum.
    Major protocol improvements and ecosystem funding.
    Listing on Coinbase and Binance centralized exchanges.

This established Solana as a leading Ethereum competitor. But lack of maturity showed…

2022 – Crash and Outages

SOLUSD_2023-09-05_12-33-11

In 2022, the crypto downturn brought SOL back down below $40 from its highs. More damaging were network outages in 2022 that dented confidence in Solana’s stability. The final days surrounding the FTX collapse, Solana also suffered, taking the cryptocurrency to a 2022 low of $8.

While still early days for such a nascent project, Solana needs to improve reliability to gain institutional trust. But its developer momentum continues unabated, with over 4000 projects built on Solana so far.

Recent SOL Price Analysis

SOLUSD_2023-09-05_12-33-29

Solana has been recovering throughout 2023, but the US SEC hasn’t made it easy, attacking altcoins around every turn. Each time altcoins like SOL attempt to gain momentum, the SEC files another case against a crypto exchange. Past filings include naming Solana as a possible unregistered security.

However, it continues to be the choice for big institutions such as VISA, which is launching a stable coin payment system on Solana.

Short-Term Solana Price Prediction for 2023

short-term Solana price prediction

The latest bullish news that VISA is using Solana for its stable coin payments could propel SOL higher and reach the target of this inverse head and shoulders pattern, with a target of $75 per token.

Medium-Term Solana Price Prediction for 2024-2025

medium-term Solana price prediction

Solana very closely mimics the price action of 2016 through 2020 Ethereum. If another similar rally follows in Solana like it did in Ethereum, SOL could approach upwards of $1,000 per token.

Long-Term Solana Price Prediction for 2030

long-term Solana price prediction

In the longest term outlook, it becomes much more challenging to properly predict what SOL might do. It very much depends on adoption of the SOL token, the Solana blockchain, and crypto itself. If SOL can maintain its current mean trajectory, then it is possible Solana could be priced around $3,000 to $4,000 by the year 2030 or beyond.

Conclusion: Solana Price Outlook

Solana has demonstrated immense potential with its blazing fast speeds at low costs. But it still has much to prove regarding stability and institutional-grade security.

If Solana can build on its developer momentum and rapidly evolving ecosystem while improving reliability, its long-term growth upside is immense. But execution risks remain for this ambitious project aiming to reshape decentralized finance.

Solana Price Prediction FAQs

Let’s look at some common questions crypto investors have about SOL price analysis:

What was Solana’s lowest ever price?

SOL sank to as low as $0.50 in the early days after its mainnet launch in 2020. Its 2022 low was around $8 amidst broader crypto market weakness.

What was the highest price for Solana?

Solana’s all-time high price stands at $260 reached in November 2021 during strong bullish momentum carrying crypto markets higher.

Is $500 realistic for Solana?

SOL reaching $500 is achievable this decade if Solana fulfills its technological promise and sees high adoption as the leading DeFi blockchain.

Can Solana crash to zero?

A complete collapse is unlikely given Solana’s strong fundamentals unless critical flaws emerge in its core protocol. But extended weakness could sink SOL below $10 until a recovery.

Why is SOL price volatile?

As a relatively new asset with limited liquidity, Solana experiences high volatility from speculative trading and sentiment shifts. As adoption increases, volatility should stabilize.

When will Solana’s price stabilize?

Solana price swings may start normalizing once it builds a large user base and matures technically. But as a crypto asset, some volatility will always remain.

XRP Price Prediction for 2023, 2024, 2025, 2030 and Beyond

XRP has been one of the most controversial cryptocurrencies since its creation by Ripple Labs in 2012. Its close ties to traditional finance have alienated parts of the crypto community. However, it retains a loyal following for its fast and cheap transactions. This XRP price prediction guide examines the coin’s outlook using technical analysis methods.

What is XRP?

XRP is a cryptocurrency created by the Ripple payment network to facilitate fast cross-border payments. Ripple Labs founders Arthur Britto, David Schwartz, and Chris Larsen designed it to overcome Bitcoin’s scalability issues while enabling seamless transfers between different currencies.

Some key features of XRP include:

Speed 

Settlement of XRP transactions takes 3-5 seconds, far faster than Bitcoin’s 10+ minutes.

Low cost

XRP transaction fees are a fraction of a penny, making it affordable for micropayments.

Fixed supply

The total supply of 100 billion XRP was created at launch, unlike Bitcoin’s limited issuance schedule.

Bank partnerships

Ripple has partnered with over 300 banks and financial institutions to use XRP for settlement.

Controversies

XRP has been mired in controversy regarding everything from centralization to securities classification.

XRP is designed for use by financial institutions, though it trades publicly on exchanges. Its adoption rate will likely depend significantly on the outcome of Ripple’s ongoing SEC lawsuit.

XRP price prediction

Factors Influencing XRP Price

Numerous factors impact XRP prices, leading to high volatility:

Ripple Company Developments and XRP Regulatory Status

Ripple’s partnerships, service offerings, and legal issues have significant ramifications for XRP’s price action. For example, the SEC deeming XRP kept the asset from making new all-time highs during the 2020 and 2021 bull market in crypto. Now that Ripple has won the case against the SEC and a US judge deeming XRP not a security, new all-time highs could arrive during the next bullish cycle.

Cryptocurrency Market Trends

Like most altcoins, XRP’s price tends to follow Bitcoin’s price movements overall. When Bitcoin rises or falls sharply, so does XRP. Bitcoin itself has been struggling recently due to the US Federal Reserve raising interest rates.

Mainstream Adoption

XRP gaining transactional adoption from banks and payment providers would establish real-world utility and boost prices. But it faces stiff competition from private blockchains.

Decentralization Efforts

Lessening Ripple Lab’s control over XRP supply and the ledger through further decentralization could enhance XRP’s appeal and value to the crypto community.

Burn Rate

Ripple periodically burns XRP supply to manage circulation. Higher burn rates decrease available XRP which can positively impact prices.

XRP Price History

XRP’s price history has been defined by major announcements, partnerships, and controversies.

2012-2014: The Early Years

XRP traded for a fraction of a penny initially. Prices remained relatively flat between $0.002 to $0.02 till 2017 as Ripple focused on building partnerships rather than exchanges.

XRPUSD_2023-08-31_10-32-52

2017: Crypto Bubble Peak

As crypto mania peaked in late 2017, XRP saw massive speculative gains, rising from $0.006 in April to an all-time high of $3.84 in January 2018 – an incredible 63,000% return within 9 months!

However, this meteoric rise was fueled by hype rather than fundamentals. XRP came crashing down as Bitcoin collapsed, declining over 90% within a year after the peak.

XRPUSD_2023-08-31_10-32-31

2018-2020: Building Products

Between 2018-2020, XRP stayed afloat better than most altcoins, trading between $0.20 to $0.60 as Ripple doubled down on establishing real-world utility.

Major developments included:

  • Ripple launched On-Demand Liquidity (ODL) allowing financial institutions to use XRP for instant cross-border payments.
  • Over 300 banks signed up for RippleNet to connect payment channels globally.
  • Remittance firms including MoneyGram began using ODL for transferring funds.

This suggested future adoption could be driven by Ripple’s offerings.

XRPUSD_2023-08-31_10-32-12

2021 – 2022: Legal Woes and a Bear Market Emerge

After starting 2021 strongly with XRP exceeding $1 again thanks to crypto resurgence, Ripple was hit by an SEC lawsuit in December 2020 alleging XRP was an unregistered security.

Many exchanges delisted XRP while its price collapsed due to negative sentiment. XRP failed to set a new all-time high while Bitcoin, Ethereum, Dogecoin, and several others as a result.

Each of these other cryptocurrencies set a peak during this time, entering a bearish market in 2022. This lowered the chances of XRP making a recovery during the year.

XRPUSD_2023-08-31_10-31-30

Recent XRP Price Action

2023 has been a difficult year for most cryptocurrencies, which are only starting to recover from the prolonged crypto winter. XRP, however, has outperformed most cryptocurrencies this year thanks to Ripple winning its legal battle with the SEC. 

A US court judge ruled that XRP is not a security when sold to retail investors. This caused several exchanges to relist the asset, and prices spiked from under $0.50 to $1 in 48 hours after the decision. The SEC plans to appeal the decision, which prompted a full retrace of the rally. Now what’s next for XRP price?

XRPUSD_2023-08-31_10-31-02

Short-Term XRP Price Prediction for 2023

With XRP fully retracing the SEC court case ruling rally, sentiment is back to scared across the crypto market. Combined with other altcoins setting new lows, investors are fearful that the bear market might return.

XRP, however, could be performing a throwback retest of ascending triangle resistance turned support, which is common in financial markets. If support holds, price could ultimately approach over $1 in the next attempt. 

Meanwhile, if price were to fall back through the bottom of the ascending triangle pattern, it would indicate failure and lead to a retest of bear market lows.

Short-Term XRP Price Prediction for 2023

Medium Term XRP Price Prediction for 2024 – 2025

If XRP can continue with its bullish market, then 2024 and 2025 could see the final move in the first major bull market sequence. 

Elliott Wave Principle believes that bull markets move in what’s called a motive wave, which is a five-wave upward sequence, where odd numbered moves are in the direction of the primary trend, while even numbered moves move against the trend.

Corrections are typically labeled as ABC, unless the correction is a triangle, in which it is labeled ABCD and E. More complex corrections can evolve over time. Triangles represent the consolidation before the final thrust in a sequence.

Price projections put XRP above $10, between $14, and $17 depending on momentum and supporting environment.

Medium-Term XRP Price Prediction for 2024 2025

Long-Term XRP Price Prediction for 2030

XRP’s long term forecast is a lot more difficult to predict using traditional technical analysis techniques. In this case, we’ve chosen to draw a price mean through years of price action in an attempt to project a linear trend line.

Peaks and troughs would occur above and below the mean, providing the potential for mean reversion trades. The trajectory puts XRP upwards of $20 per coin in the future if the mean line is accurate.

Long-Term XRP Price Prediction for 2030

XRP Price Prediction FAQs

Let’s look at some commonly asked questions regarding XRP price forecasts:

What was XRP’s lowest price?

During its initial couple years after launch, XRP hit lows between $0.002 to $0.005. Its recent low was $0.24 in July 2022.

What was XRP’s highest price?

XRP’s all-time high was $3.84 reached in January 2018 during the crypto bubble. It also briefly exceeded $3.60 in the same time frame.

How high can XRP realistically go?

Based on its fundamentals and adoption risks, a realistic best-case high for XRP by 2025-2030 is likely in the $10 to $20 range if it gains widespread utility. Reaching triple digits appears very unlikely.

Can XRP’s price crash to zero?

If Ripple suffered an existential threat, XRP could potentially crash below $0.01. But delisting risks have reduced after a US court deemed XRP not a security, making a complete collapse improbable without a catastrophic event.

Why is XRP price volatile?

As a cryptocurrency exposed to speculative trading, XRP experiences high volatility from hype cycles and shifts in investor confidence amplified by its low liquidity relative to larger cryptos.

When will XRP’s price stabilize?

XRP volatility should stabilize and gravitate closer to currency-like fluctuations once it establishes a reliable demand baseline among commercial users and institutions. But this remains dependent on Ripple’s success.

Ethereum Price Prediction for 2023, 2024, 2025, 2030 and Beyond

Ethereum has rapidly become the second most valuable cryptocurrency after Bitcoin. With its recent transition to a proof-of-stake consensus model and its expanded capabilities, Ethereum’s future looks bright. This guide provides a data-driven Ethereum price prediction for the short, medium and long-term.

What is Ethereum (ETH)?

Ethereum is a decentralized blockchain platform created by Vitalik Buterin in 2015. Like Bitcoin, it uses a blockchain to store transaction records. But Ethereum’s key innovation was enabling decentralized applications (dApps) and smart contracts on its blockchain.

The Ethereum blockchain serves as a secured public ledger for verifying and recording transactions. Ether (ETH) is the native cryptocurrency of the platform that acts as ‘gas’ to power transactions and run smart contracts.

Some key aspects of Ethereum include:

Smart contracts

These are applications that run exactly as programmed without risk of downtime or third-party interference.

Decentralized platform

Ethereum operates via a global peer-to-peer network, avoiding centralized control.

Programmable blockchain

Developers can use Ethereum to build and deploy decentralized applications of all kinds.

Proof-of-stake consensus

Ethereum has transitioned to a more efficient proof-of-stake system called Casper that requires less energy.

These features make Ethereum extremely versatile and a promising platform for decentralized finance (DeFi), NFTs, DAOs, dApps and much more.

Factors Influencing Ethereum Price

Ethereum’s growth has been explosive, but not without volatility. Here are some factors that affect ETH prices.

Cryptocurrency Market Trends

Like most cryptos, Ethereum price depends heavily on trends in the overall crypto market. Bitcoin’s price actions in particular have a ripple effect on altcoins.

Gas Fees and Transaction Costs

Ethereum gas fees rising during times of network congestion reduces usage and can suppress price. Efforts like scaling solutions aim to lower transaction costs.

Mainstream Adoption

With increasing real-world Ethereum usage cases in DeFi, NFTs etc. mainstream adoption is rising, leading to higher demand and prices.

Competition

While Ethereum is the dominant smart contract platform currently, competition from projects like Solana, Cardano etc. can potentially erode its market share and affect ETH prices.

Regulations

Regulatory crackdowns or increased clarity on crypto/Ethereum can both positively and negatively impact prices by affecting investor sentiment.

Technology Upgrades

Recent Ethereum developments like the Merge upgrade to proof-of-stake or ETH 2.0 implementating sharding may improve capabilities and affect value over time.

Burning Ether

Burning ETH taken out of circulation through EIP-1559 helps reduce supply and may gradually increase the value of remaining Ether.

Ethereum Price History

Ethereum launched in 2015 at an initial price of around $0.30. Here is a look at key price developments since then.

2015-2017 – The Early Days

After launch, Ethereum traded in the $1-$15 range till early 2017. As crypto markets gained steam in 2017, Ethereum shot up to $380 by June.

Several factors drove growth:

  • Increasing developer adoption with global Ethereum hackathons held in 2017. Hundreds of projects were built on Ethereum.
  • Mainstream coverage of Ethereum as a revolutionary technology in magazines like Forbes
  • ICO boom – projects raising millions via Ethereum-based ICOs bought Ether at inflated prices

This growth was unsustainable long-term and by September 2018, ETH had fallen to around $170. But immense developer interest and real-world usage potential was now apparent.

ETHUSD_2023-08-30_09-04-40

2018-2020 – Building During the Bear Market

In the 2018-2020 bear market, Ethereum stayed afloat better than most altcoins, remaining above $100.

Major mileposts include:

  • Despite market conditions, steady progress continued on Ethereum 2.0 upgrades like Beacon Chain, proof-of-stake, and sharding.
  • Increasing DeFi (decentralized finance) dominance with Ethereum facilitating over 90% of activity and billions in value.
  • Launch of Ethereum-based Tether (USDT), the most used stablecoin. USDT transactions dwarfed payment coins.
  • ERC-20 standard became the de-facto for issuing new tokens. Most ICOs continued to launch on Ethereum.

This demonstrated Ethereum’s real-world utility and helped prevent steeper declines.

ETHUSD_2023-08-30_09-05-12

2021 – 2022 – From Mainstream Mania To Manic Depression

2021 marked a parabolic rise for Ethereum, breaking out beyond crypto circles into mainstream recognition. The parabolic rise also brought an abrupt peak, sending Ethereum prices crashing all throughout 2022 as the US Federal Reserve began hiking interest rates to the highest levels in decades.

Key factors driving this bull run:

  • Continued DeFi growth, with the total value locked in DeFi rising from $20B to over $100B during 2021.
  • NFT mania beginning in early 2021, with Ethereum hosting headline-grabbing sales like Beeple’s $69 million digital art piece.
  • Ethereum network upgrades like Berlin hard fork and London’s EIP-1559 built investor confidence.
  • Large companies like Visa and JP Morgan began settling transactions on the Ethereum blockchain.
  • Institutional investment rose with SEC allowing Ethereum futures ETFs.

This perfect storm took ETH from under $800 in January 2021 to an all-time high of $4,800 in November 2021. In 2022 the crypto market endured a painful bear market, with Ethereum dropping below $1,000.

ETHUSD_2023-08-30_09-01-30

However, a major milestone was reached in September 2022, with Ethereum completing The Merge upgrade to become a proof-of-stake blockchain. This reduced Ethereum inflation and carbon footprint.

While sentiments remain low currently, The Merge was a huge technological leap cementing Ethereum’s lead in blockchain development. The stage is potentially set for the next bull market.

Recent Ethereum Price Performance

Unlike Bitcoin which found a local bear market bottom in November 2022, Ethereum set a local low in mid-June at around $878 per ETH. An almost immediate bounce took Ether over double from the low to $2,000, but retested $1,000 before the year ended. Throughout 2023 while Bitcoin and other cryptocurrencies have recovered, Ethereum’s rally has been relatively muted.

In August 2023, Ethereum once again retested $1,500, possibly putting in a lower low before the start of a more substantial rally or collapse.

Ethereum Price Prediction

Short Term Ethereum Price Prediction for 2023

Since the 2022 local bottom, Ethereum has been forming an Ascending Triangle pattern. This is predominantly a bullish pattern, but can occasionally appear in a bear market before the final move in a sequence, ultimately breaking down.

Targets based on the measure rule put an immediate upside breakout around $3,800 per ETH, while a breakdown would send Ether back down to $871 for a double possible double bottom or new low. With only a few months left in 2023, trajectories will be limited based on time.

ETHUSD_2023-08-30_08-42-23

Medium Term Ethereum Price Prediction for 2024 – 2025

Based on historical 4-year market cycles and Elliott Wave Principle patterns, Ethereum appears to be at a critical junction, where it could retrace further and break down from a large rising wedge structure, or could rally and fill out the upper portion of the pattern one more time.

The black-colored wave scenario puts ETHUSD at $10,000 between 2024 and 2025. Meanwhile, the red-colored corrective wave scenario suggests Ether will reach around $440 during a C-wave of continuation.

Ethereum Price Prediction 2024 and 2025

Long Term Ethereum Price Prediction for 2030 and Beyond

If Ethereum establishes itself as the primary platform for decentralized apps and finance by 2030, its utility could be immense. Based on a long-term linear mean, Ethereum could fluctuate between $20,000 and nearly $100,000 per ETH by the year 2030 arrives.

ETHUSD_2023-08-30_08-58-38

Ethereum Price Predictions by Experts

Here what some industry experts and analysts forecast for Ethereum:

Popular analyst Benjamin Cowen is conservative in his Ethereum price prediction, claiming that “Ethereum has the potential to eventually achieve $10,000 to $15,000 per ETH in the next five to ten years.” He cautions that scaling needs to be achieved without diluting ETH’s value.

RealVision CEO Raoul Pal predicts ETH at $20,000 by 2025. CertiK CEO Ronghui Gu forecasts Ethereum at $30,000 to $50,000 by 2030. Justin Bennett sees ETH potentially reaching $40,000 if bullish sentiment returns.

Ethereum Price Prediction FAQs

Here are some common questions about Ethereum price predictions:

What was Ethereum’s lowest price?

Ethereum hit record lows between $0.4 to $0.7 in 2015 and 2016 during its earliest days. Its recent low was around $800 in June 2022.

What was Ethereum’s highest price?

Ethereum’s all-time high price was $4,891 reached in November 2021. It also briefly exceeded $4,600 in the same month.

How high can Ethereum realistically go long-term?

Based on expert forecasts and models, Ethereum potentially could reach over $100,000 by 2030, and even $500,000+ in the 2050 timeframe as a bull case scenario if it achieves global adoption.

Can Ethereum drop to zero?

While unlikely, the possibility that Ethereum drops to near zero can’t be ruled out entirely. Competition, failure to scale sufficiently, or critical bugs in the codebase are threats.

Why is Ethereum price volatile?

As a relatively new asset class, Ethereum is prone to high volatility. Speculation, hype cycles, and changing investor sentiment amplify price swings.

When will Ethereum’s price stabilize?

Ethereum price volatility should stabilize significantly once it achieves full-scale mainstream adoption as a blockchain platform, which could happen within the next 5-10 years.

Will Ethereum go up in 2023?

The most likely scenario based on market trends is Ethereum rising gradually throughout 2023, although price will remain volatile in the short-term.

Bitcoin Price Taps $28,000 On Grayscale Ruling, Soaring Stock Market

Bitcoin price has thus far made a 7% intraday move following news that a US court ruled in favor of Grayscale against the SEC. At the same time, the stock market is surging.

Could a perfect storm for the top cryptocurrency by market cap be building?

Back At $28,000: Grayscale Court Ruling Causes BTC To Bounce

In an asset class as volatile as crypto, prices — and moods — can change in a flash. That’s exactly what we’ve witnessed on a small scale today, moments after news broke that a US court is forcing the SEC to reconsider Grayscale’s Bitcoin ETF.

The news is significant because not only does it increase the chance Grayscale can move ahead with an ETF, but it also improves the likelihood of other ETFs like
BlackRock getting the green light.

Green is definitely the color of the day, with BTCUSD climbing back to $28,000 per coin on the heels of the news.

BTCUSD_2023-08-29_13-20-53

Bitcoin Price Could Benefit From A New Stock Market High

It isn’t just crypto getting a major boost today. US stock indexes are also soaring today. The S&P 500 is up over 1.2%, the tech-heavy Nasdaq over 1.88%, and the Dow Jones Industrial Average at 0.63%. The latest bounce in stocks puts traditional markets within striking distance of a new all-time high.

This is important because if Bitcoin price is already turning bullish in the wake of the Grayscale news, then a simultaneous stock market all-time high could cause crypto to go ballistic.

SPX_2023-08-29_13-29-07

Cryptocurrencies have a ton of catching up to do relative to the stock market. Furthermore, back in 2020, after the S&P 500 made a new all-time high, Bitcoin price followed in the weeks to come and set a record of its own. Is this what we can expect if the stock market sets new record highs, and a slew of ETFs are approved?

Bitcoin Bullish Uptrend Remains Unbroken, Here’s Why

Bitcoin price is currently trading at slightly above $26,000 per coin, but is still reeling after last week’s 10% single day selloff. The situation looks dire for crypto bulls who were hoping for a more significant recovery to begin after such prolonged sideways.

However, the bullish market structure remains unbroken. Let’s take a closer look at what exactly this means and why the 2023 uptrend is still intact.

Recapping Recent BTCUSD Volatility

After a solid start to 2023 – certainly a year that’s been kinder to the king of cryptocurrency than 2022 – BTCUSD has bears celebrating and bulls kicking their wounds. Several months of sideways price action and dwindling volatility ended with a bang as expected, but the move was down and not what bulls had been hoping for.

A sharp, 10% intraday selloff caused more long liquidations than the FTX collapse, and sent the Relative Strength Index immediately into the most oversold territory in all of 2023. But even with all the carnage, Bitcoin remains in a near-term uptrend with a bullish market structure.

bitcoin bullish uptrend

Why Bitcoin Price Remains In A Structural Uptrend

By pure definition, an uptrend is a series of higher highs and higher lows. Which is precisely what is still happening in BTCUSD price action throughout 2023. Currently, the FTX collapse in November 2022 was the local “low” of the downtrend. In contrast, a downtrend is a series of lower lows and lower highs. Once a new high was made in early 2023 and then a higher low was put in, the downtrend was considered over.

The recent 2023 uptrend in Bitcoin hasn’t yet made a lower low after a lower high. Even a possible lower low beyond here is still without a proper lower high. This means that the top cryptocurrency by market cap could potentially bounce here, or even lower, and still maintain an overall bullish market structure.

A lower low would still be important, potentially warning that the market structure is turning back bearish. If a lower low happens below the $25,000 low from June 2023, then it will be all eyes on if a lower high is to follow.

The 2023 uptrend in Bitcoin has been muted compared to what the cryptocurrency is capable of. BTCUSD is up roughly 50% during the first roughly nine months of the year. The final nine months of 2020, for example, had over 900% ROI by comparison. Could this type of returns soon be on the way? Or will the cryptocurrency market fall back into the clutches of bears?

This chart originally appeared in Issue #18 of CoinChartist VIP. Subscribe for free.

Bitcoin Price Prediction for 2023, 2024, 2025, 2030 and Beyond

Bitcoin has come a long way since its inception in 2009. From being worth less than a penny initially, it has seen massive growth over the years with some dramatic ups and downs. Today, Bitcoin is emerging as a major alternative asset class and its future valuation prospects remain optimistic.

This comprehensive guide takes a data-driven approach to analyze factors affecting Bitcoin prices and makes educated projections about its potential highs and lows in the short, medium and long-term timeframes. With cryptocurrencies gaining mainstream traction, the report aims to provide clarity to investors on what lies ahead for Bitcoin prices based on historical patterns and developments. 

What is Bitcoin (BTC)?

Bitcoin is the first and most popular cryptocurrency in the world. It was created in 2009 by the pseudonymous Satoshi Nakamoto, who published the Bitcoin whitepaper and developed the Bitcoin protocol.

Bitcoin introduced blockchain technology to the world. The Bitcoin blockchain is a public ledger that records all Bitcoin transactions ever made. It is decentralized, meaning no single entity controls it. The blockchain is maintained by a global network of computers known as Bitcoin miners.

Key attributes of Bitcoin include:

Decentralized

No central authority controls Bitcoin. It is maintained by a distributed network of users.

Limited supply

Only 21 million Bitcoins will ever exist. This scarcity gives Bitcoin value.

Pseudonymous

Bitcoin addresses are not linked to real-world identities by default, giving users privacy.

Secure

Bitcoin uses cryptography and the blockchain to ensure the security of payments and ownership records.

Divisible

One Bitcoin can be divided into 100 million smaller units called satoshis, allowing small transactions.

Permissionless

Anyone can use Bitcoin without the need for permission from authorities.

These attributes make Bitcoin unique compared to traditional fiat currencies and a promising digital asset for investment.

Factors Influencing Bitcoin Price

Many factors can affect the price of Bitcoin, leading to volatility. Some major factors include:

Supply and Demand

Basic economic theory states that when demand increases while supply remains constant, price goes up. As more investors and institutions adopt Bitcoin, demand rises. But since new Bitcoins are mined at a fixed rate, supply remains steady, driving prices up.

Media Hype and Public Sentiment

Positive or negative media coverage and public sentiment can influence demand and price. For example, Elon Musk’s tweets on Bitcoin often lead to price swings based on his views.

Major Protocol Changes and Upgrades

Major Bitcoin developments like the SegWit upgrade or Lightning Network adoption can improve Bitcoin’s capabilities and affect price.

Regulations and Legal Status

Regulatory crackdowns or acceptance of Bitcoin in different countries impacts price as it affects demand.

Whales and Institutional Investors

“Whales” – entities holding large amounts of Bitcoin – can manipulate prices when they buy or sell. Increased institutional investment also drives up prices through increased demand.

Security Breaches and Scandals

Security issues with exchanges and wallets like the Mt.Gox hack or malicious business practices like the FTX collapse can erode investor confidence and depress prices.

Macroeconomic Conditions

Economic instability and currency devaluations motivate investors to buy Bitcoin as a hedge, boosting its price. However, it has struggled in a hawkish Fed environment and amidst rate hikes.

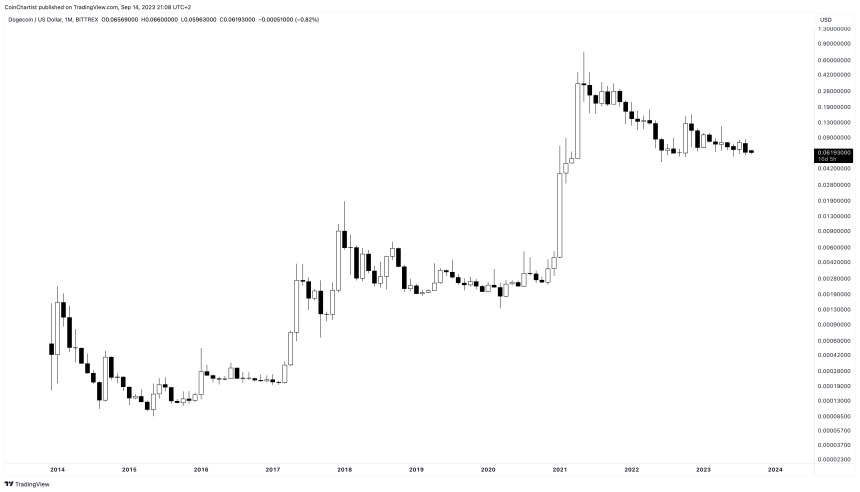
Bitcoin Price Performance in the Past

Looking at past price performance can provide insights into long-term trends and help predict future prices. Let’s take a walk down BTC memory lane.

The Early Days – Volatility and Growth (2009-2013)

BTCUSD_2023-08-25_09-38-11

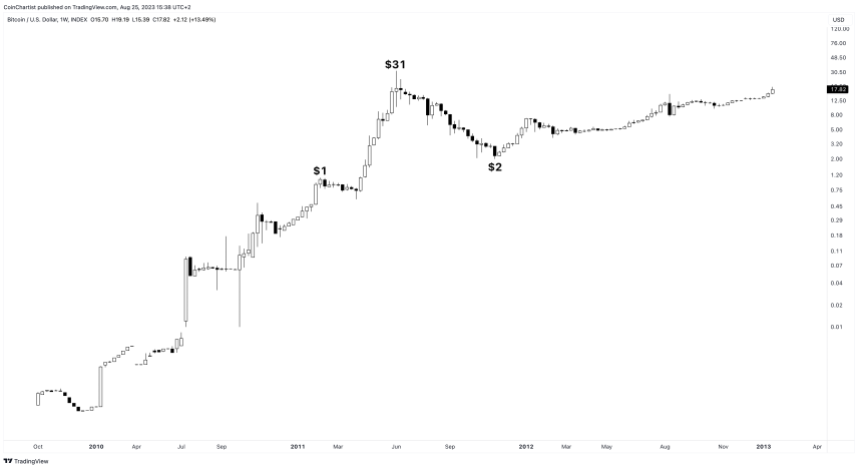
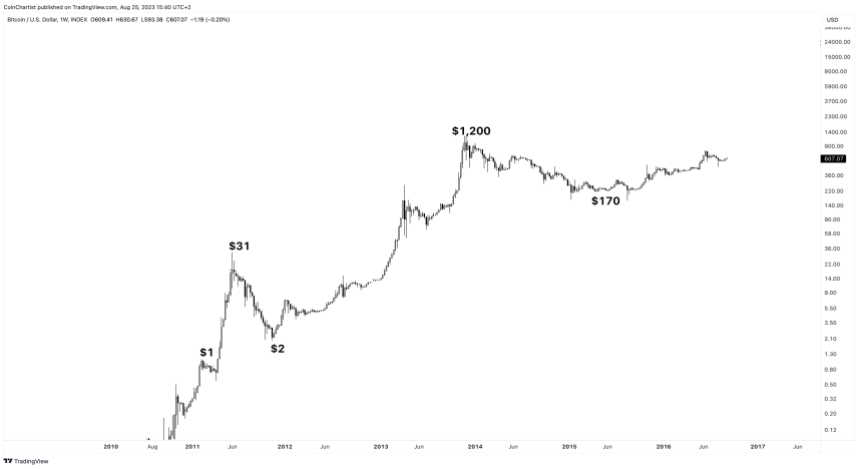
When Bitcoin launched in 2009, it was practically worthless. In 2010, Bitcoin went from $0 to $0.39 and was extremely volatile in its early days.

By early 2011, it achieved parity with the US dollar, hitting $1.00 in February 2011. In the same year, it reached $10 and then $30. This early volatility was attributed to insufficient liquidity, scarcity due to the low Bitcoin supply, and lack of exchange infrastructure.

In mid-2011, Bitcoin fell from around $30 to $2 after a series of exchange hacks and thefts shook investor confidence. It took over a year to reach $10 again.

2012 saw gradual gains up to $12 but also wild fluctuations between $7-$15. In 2013, Bitcoin entered a bull run from $12 to over $1,100 driven by increasing media coverage and adoption in the dark web.

But it ended the year around $700 following a China ban on financial institutions and payment processors dealing with Bitcoin. This cycle of rapid gains and dramatic crashes would come to define Bitcoin price performance.

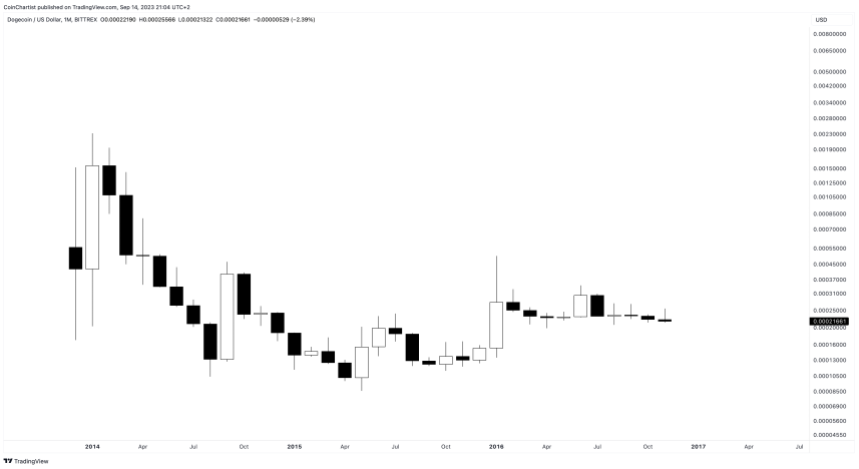
The 2014-2016 Bear Market

BTCUSD_2023-08-25_09-40-33

2014 kicked off with the collapse of Mt.Gox, then the largest Bitcoin exchange, after a series of hacks. This erased most gains from 2013 and caused Bitcoin to fall from around $850 to below $350.

For the next two years, Bitcoin hovered in the $200-$300 range. Increased regulation and lack of institutional interest kept mainstream adoption low during this period. Prices were relatively stable compared to past volatility.

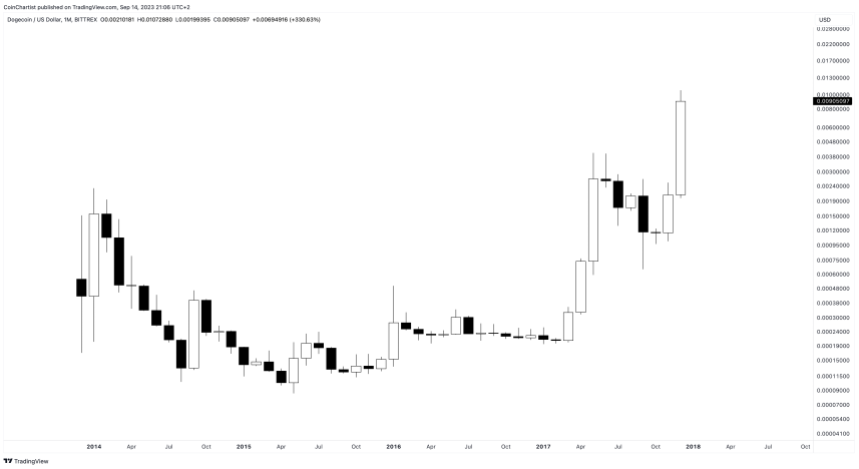
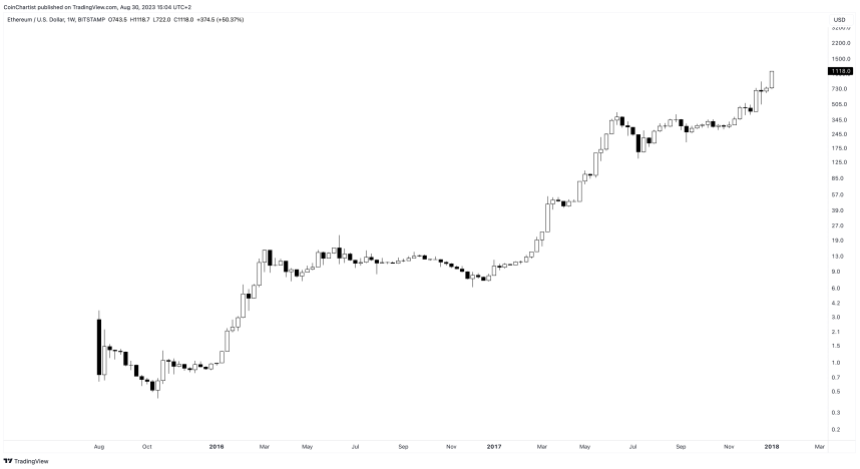
2017 – The Bull Run and Mainstream Mania

BTCUSD_2023-08-25_09-47-54

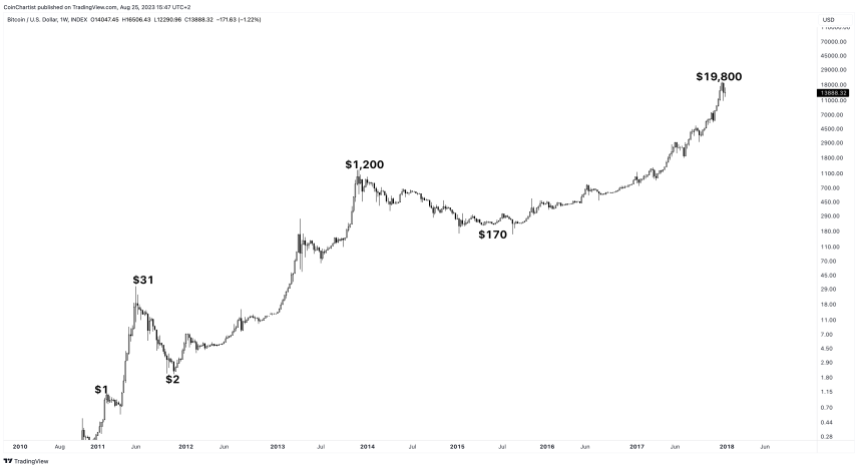
2017 marked Bitcoin’s entry into mainstream awareness and a massive growth in price to nearly $20,000.

Several factors drove this rally:

  • Growing media and investment bank coverage calling Bitcoin “digital gold”
  • Increased adoption in countries facing currency crises like Venezuela and Zimbabwe
  • Proposals for Bitcoin ETFs (exchange-traded funds) drew investor attention
  • Launch of Bitcoin futures trading on major exchanges like CME and CBOE lent legitimacy
  • Large institutional investments – U.S billionaire Michael Novogratz invested $500M in Bitcoin in 2017

Demand rose as Bitcoin went from being an obscure digital asset to a household name. But by January 2018, Bitcoin had lost over 60% from its peak following regulatory measures and other factors leading to a cool down from its previously overheated state.

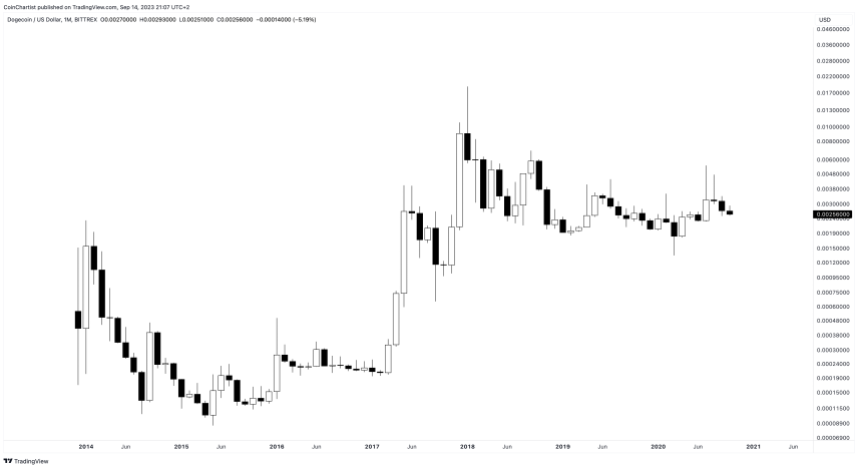
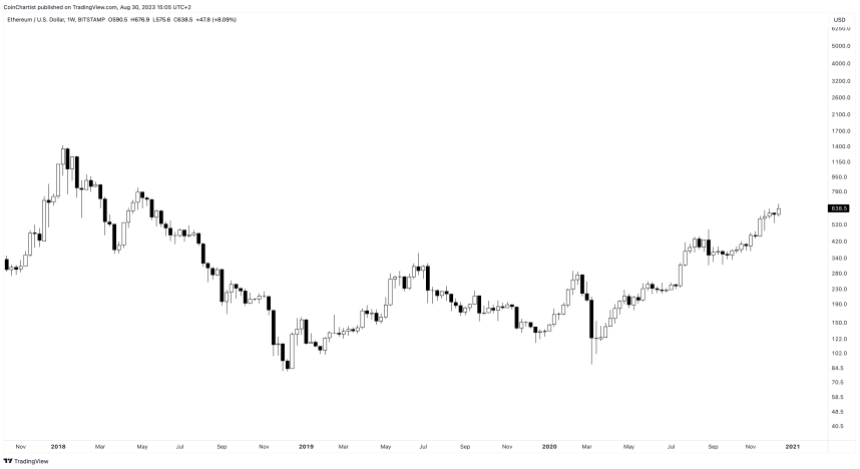
2018-2020 – The Crypto Winter and Maturation

BTCUSD_2023-08-25_09-41-27
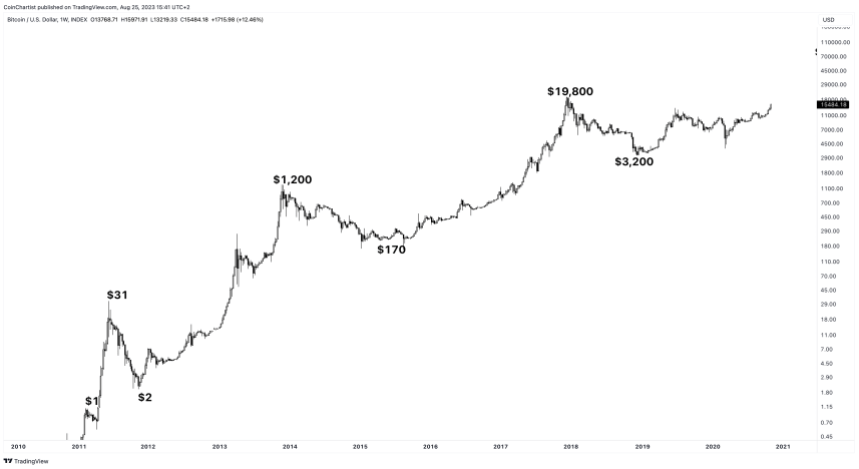
Bitcoin spent much of 2018 in a bear market following the 2017 rally, trading in the $3,000-$6,000 range.

Increased regulatory scrutiny, exchange hacks, and coin scams contributed to falling prices. But this period also saw the maturation of Bitcoin with developments including:

  • Lightning Network launch – enabled fast, cheap Bitcoin micropayments
  • Increased mainstream institutional investment from firms like Fidelity and US Bank
  • Bitcoin futures added on Bakkt, Nasdaq exchanges
  • Countries like Japan recognized Bitcoin as legal tender

These developments likely prevented further drops. By mid-2019, Bitcoin recovered to the $10k-$11k range.

The COVID-19 pandemic and resulting economic crisis in 2020 proved Bitcoin’s value as a hedge against inflation and currency devaluation. Stimulus spending eroded fiat savings while Bitcoin held its value.

Growing institutional interest like Microstrategy’s $500M Bitcoin purchase helped take prices past 2017 highs, eventually reaching an all-time high of around $68,000 in 2021.

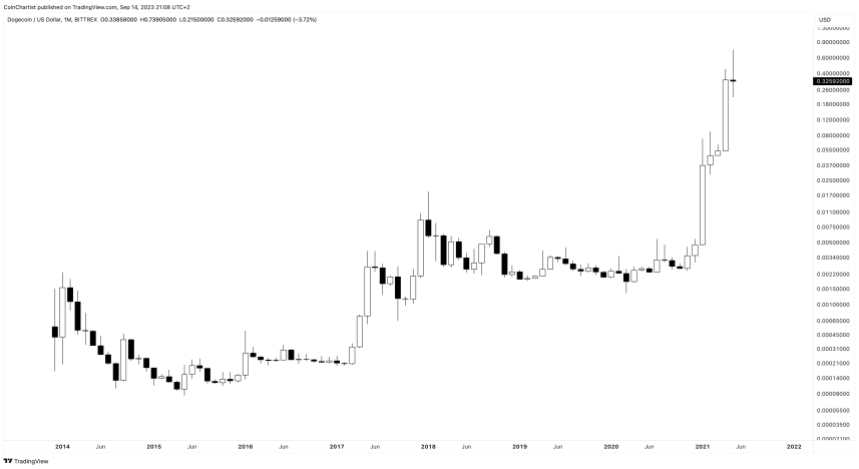
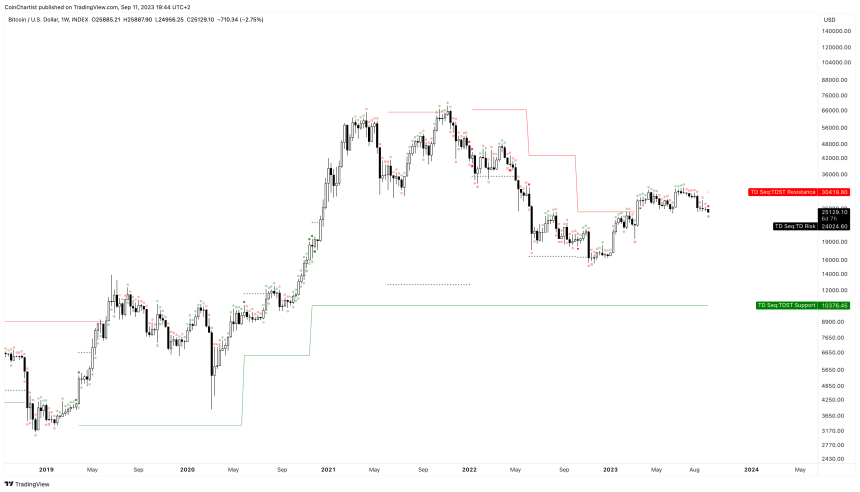
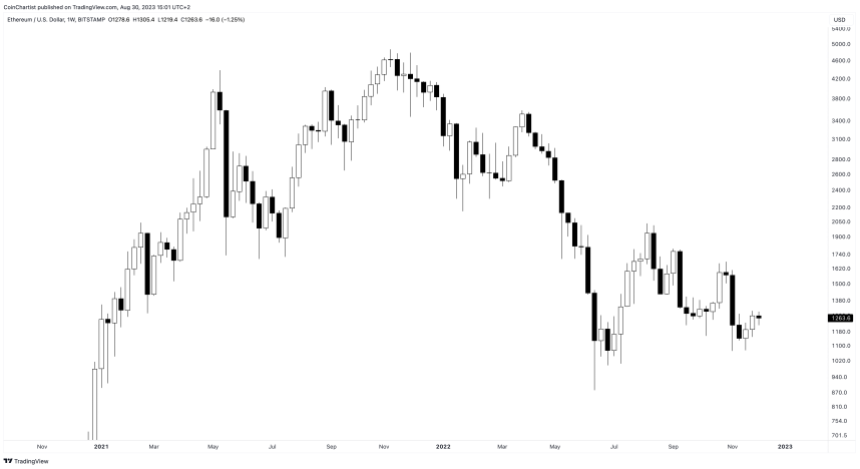
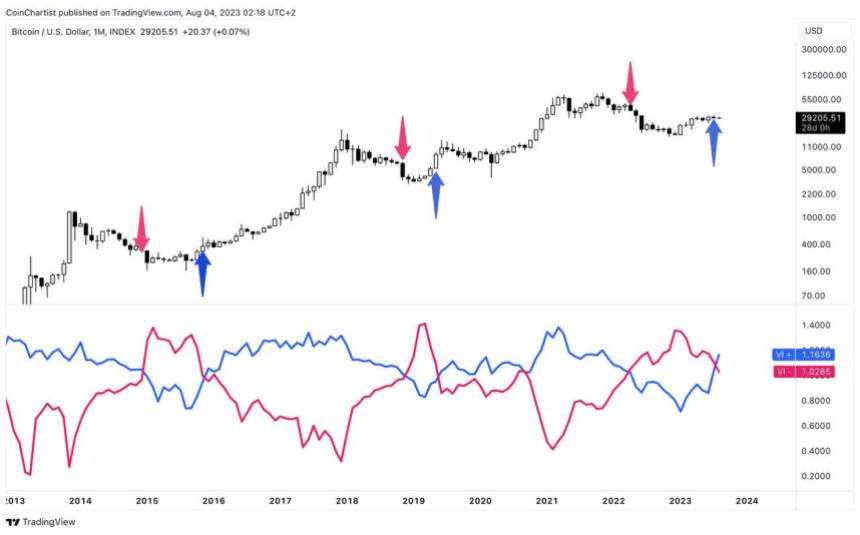
2021-2022 – Twin Peaks and Recession Risk 

BTCUSD_2023-08-25_09-41-59
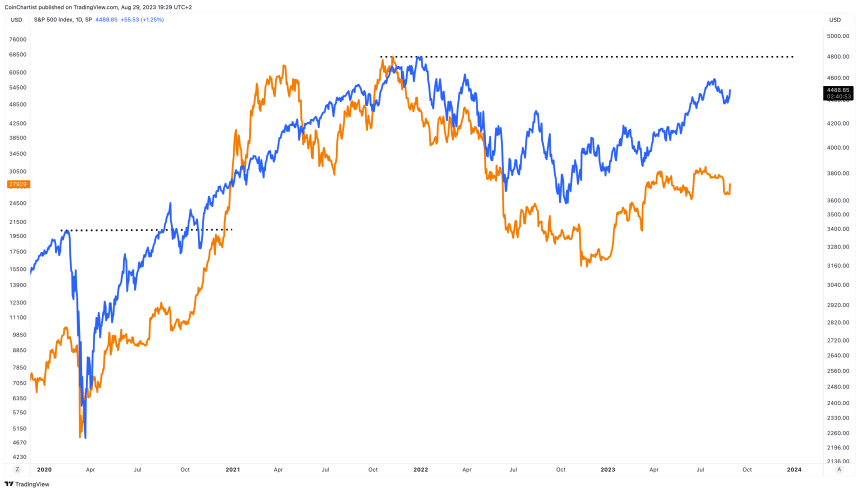
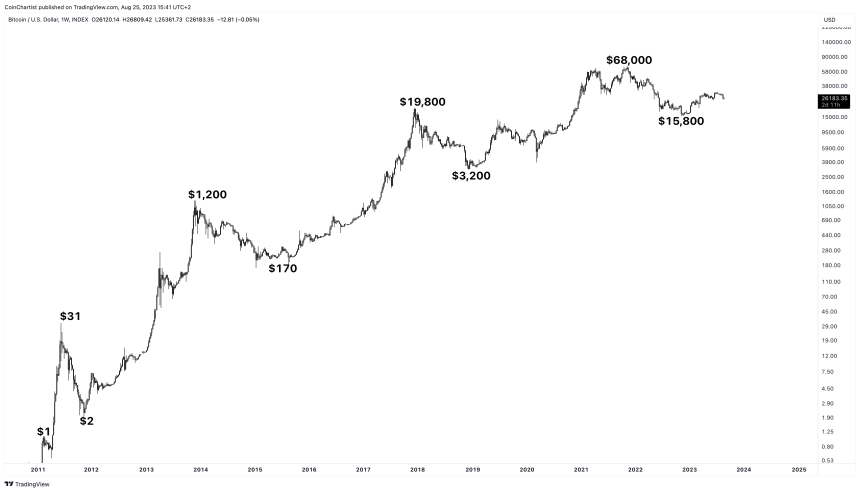
Bitcoin price made not one, but two new highs in 2021. The second high failed to move significantly past the first high, catching investors off-guard who had anticipated BTC reaching $100,000 or more. 

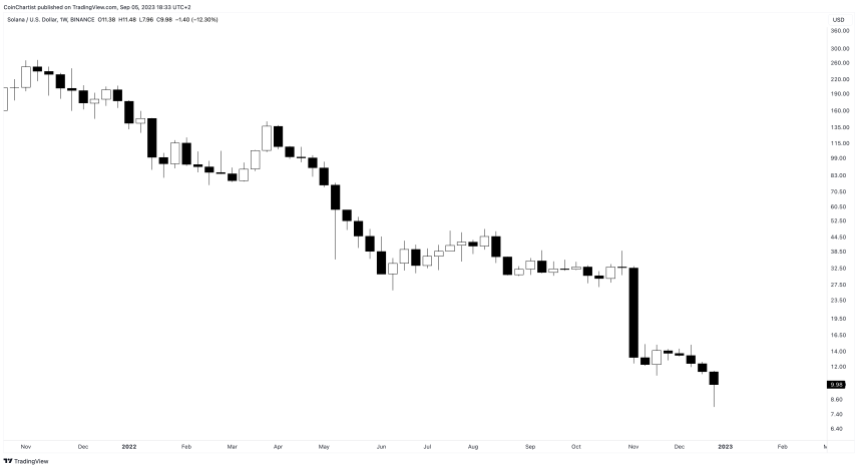
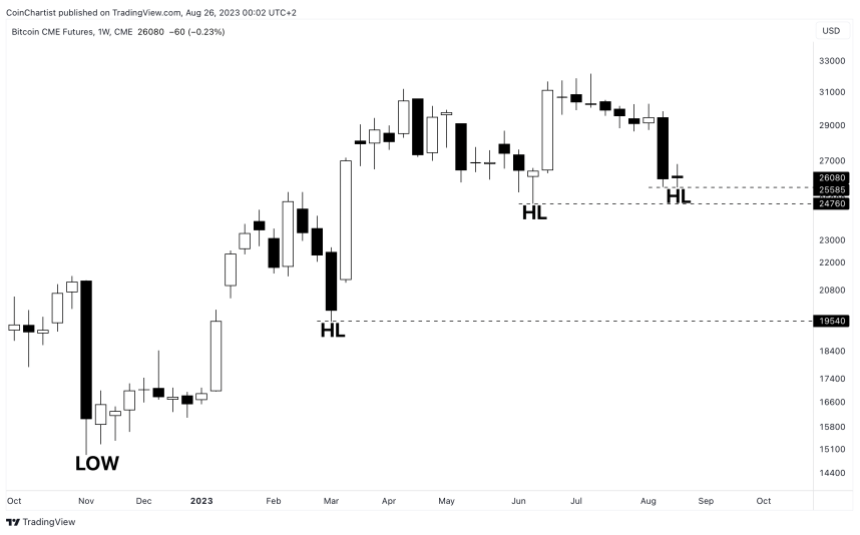
Instead, Bitcoin crashed throughout 2022 as the US Federal Reserve launched its QT program and began raising interest rates to fight back against inflation. The situation was worsened by the implosion of several crypto businesses, including FTX. Eventually, Bitcoin reached a local low of $15,800 in November 2022. 

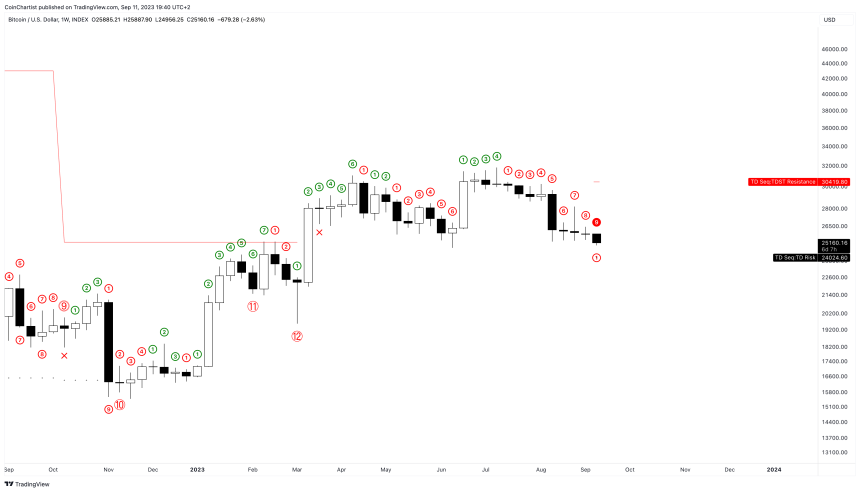
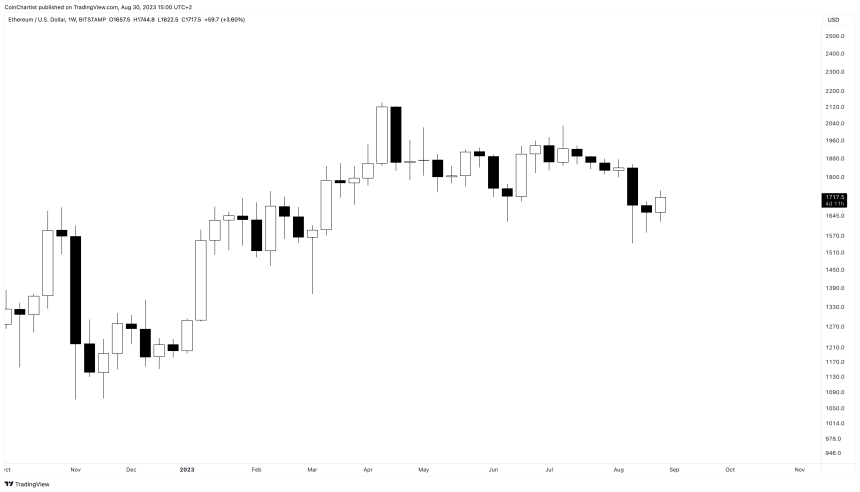
How is Bitcoin Doing Now in 2023?

BTCUSD_2023-08-25_09-43-06

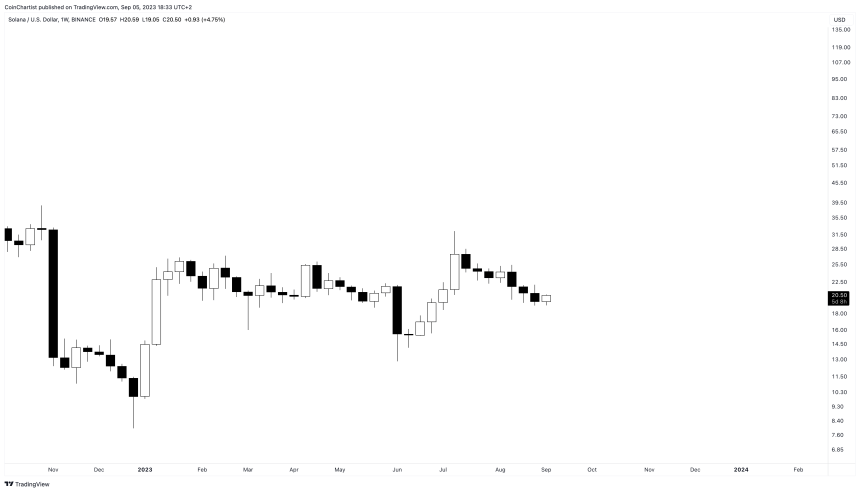
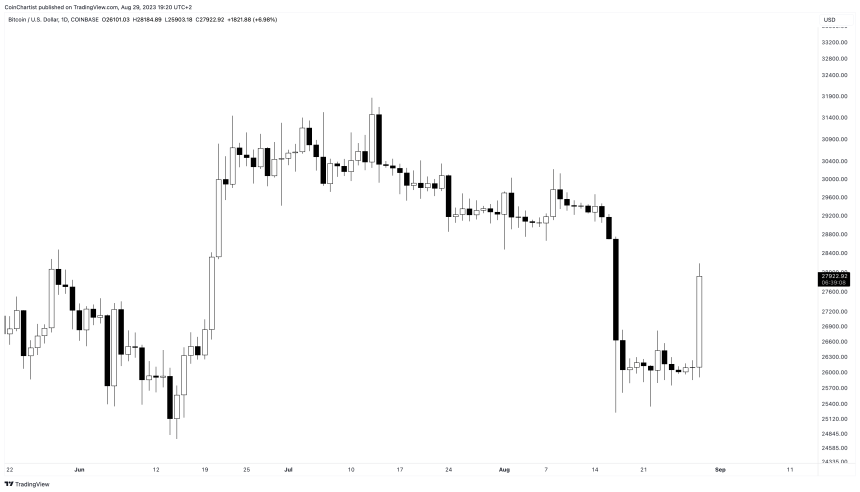
Bitcoin price is doing its best to recovery from the crypto market carnage of 2022. The US Federal Reserve continues to raise rates to record levels, and the US SEC is cracking down on the rest of the crypto industry, making it harder for Bitcoin to regain its footing.

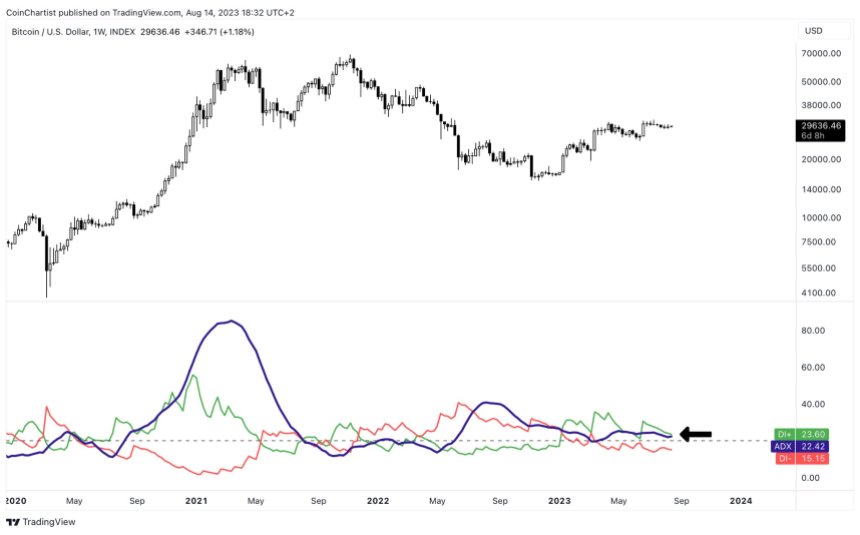
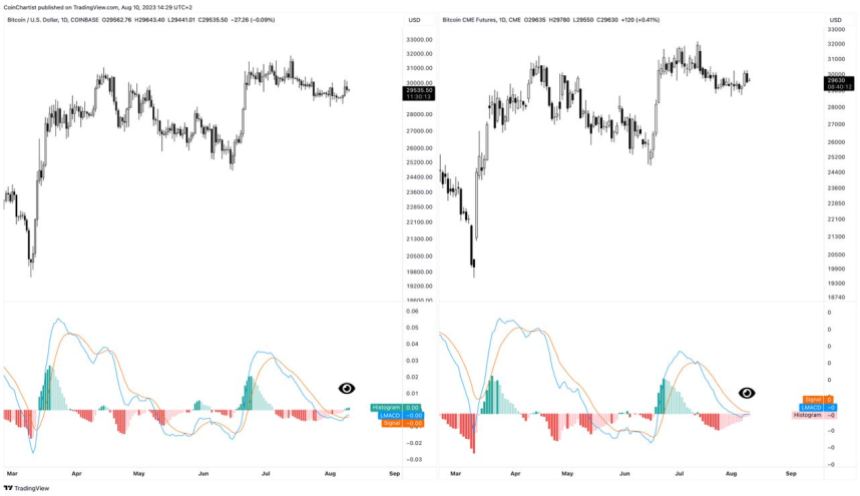
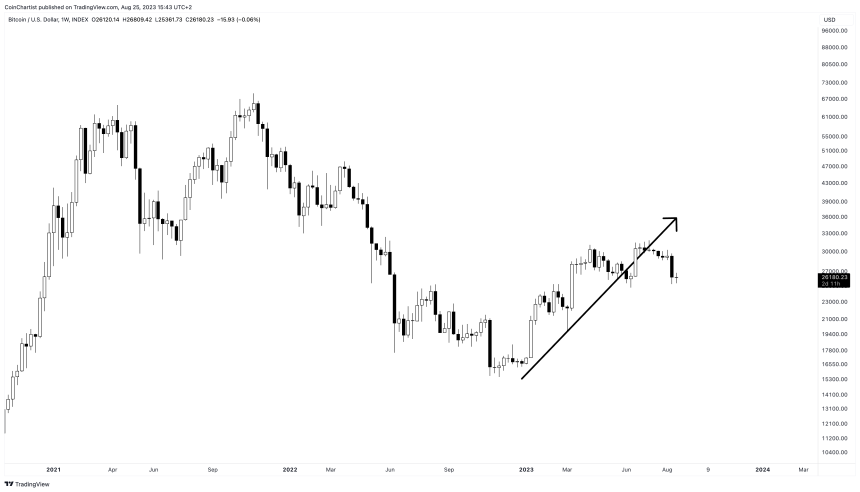
Despite the challenges, many institutions are eying launching Bitcoin EFTs, which could create a bullish narrative that drives prices higher. In the meantime, BTC is correcting after spending the majority of 2023 in a short-term uptrend. The question remains: Is Bitcoin falling back into a bear market, or will the short-term uptrend roll into a more meaningful mid-term uptrend?

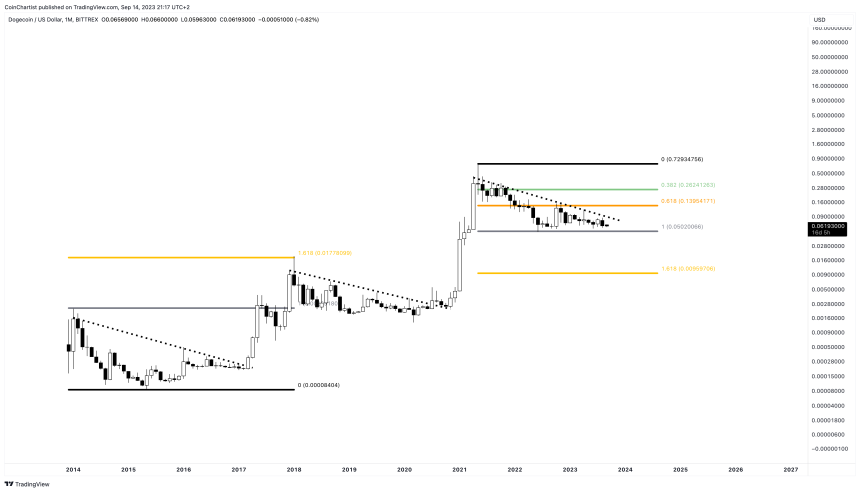
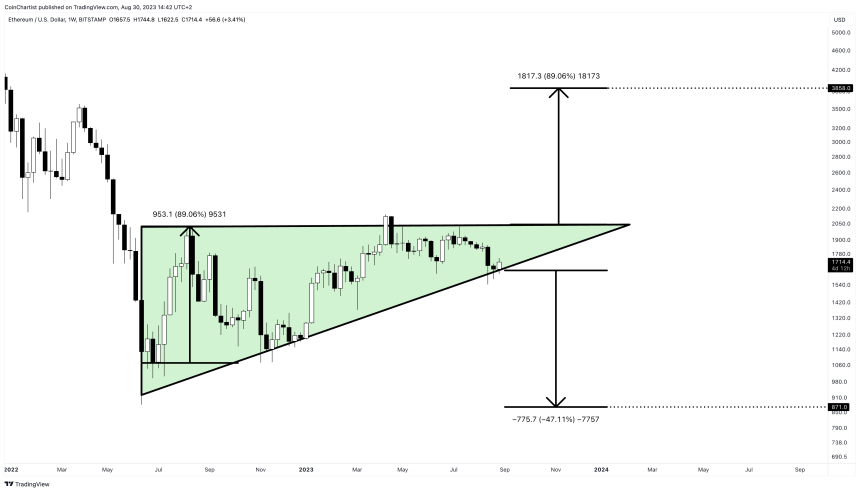
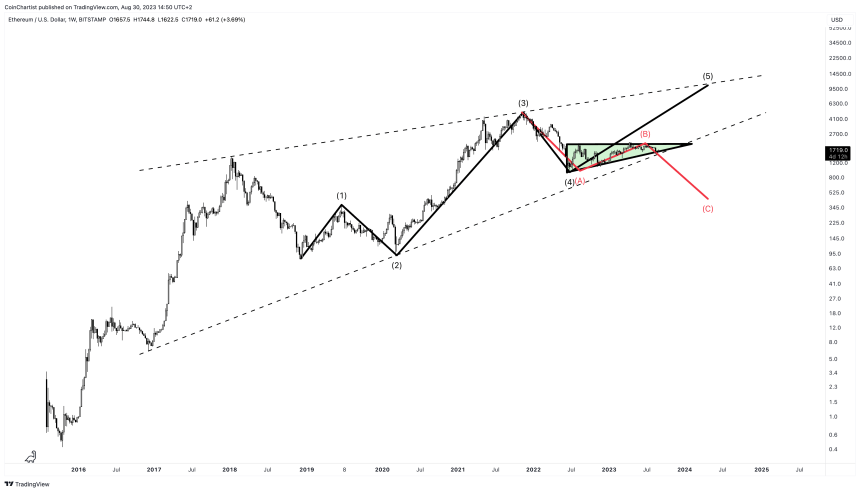
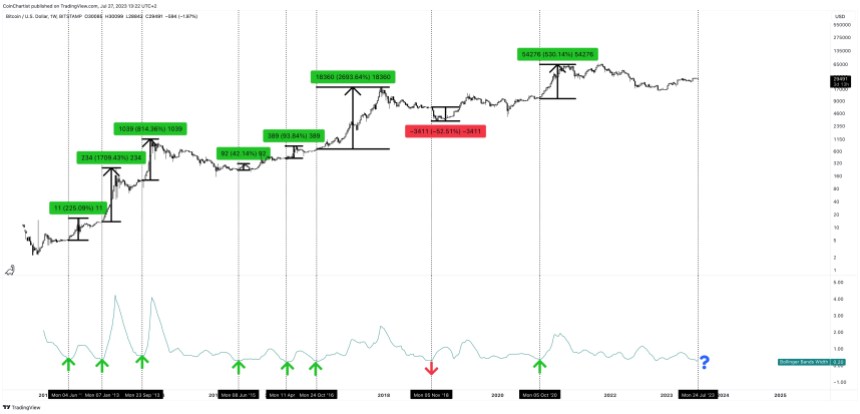
Short-Term Bitcoin Price Prediction for 2023

bitcoin price prediction 2023

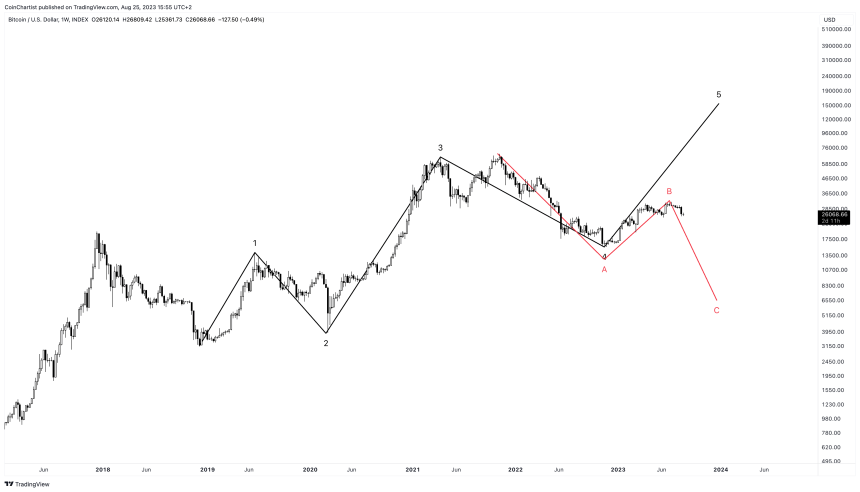
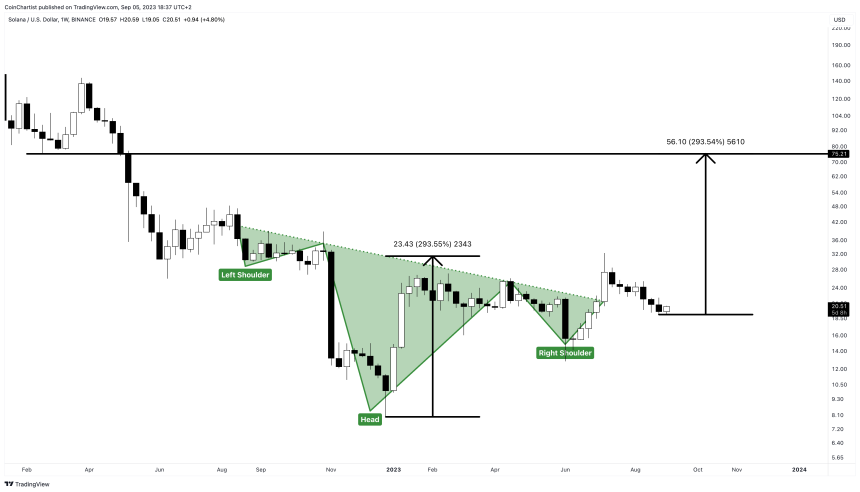
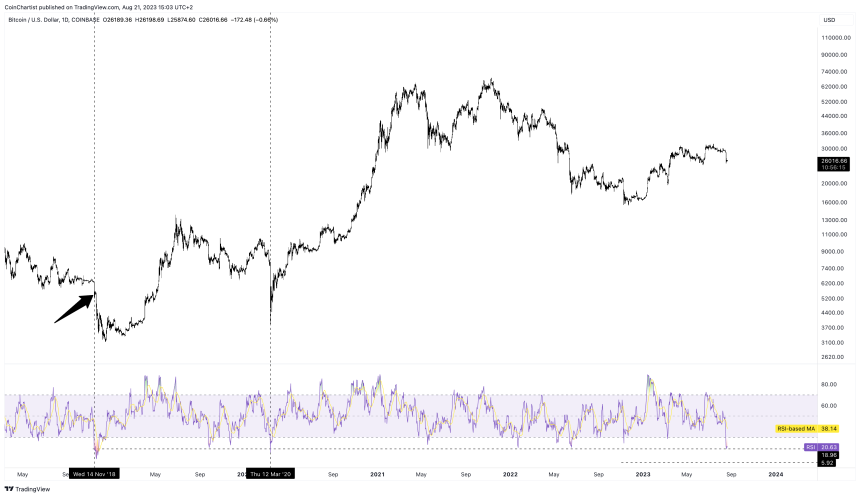
In the short-term, as in before the end of 2023, there are primarily three options from a technical standpoint. The bullish scenario is based on Elliott Wave Principle, and points to a wave 5 and a possible new all-time high this year. The bearish scenario would put Bitcoin in a further corrective pattern, targeting $6,000 per BTC.

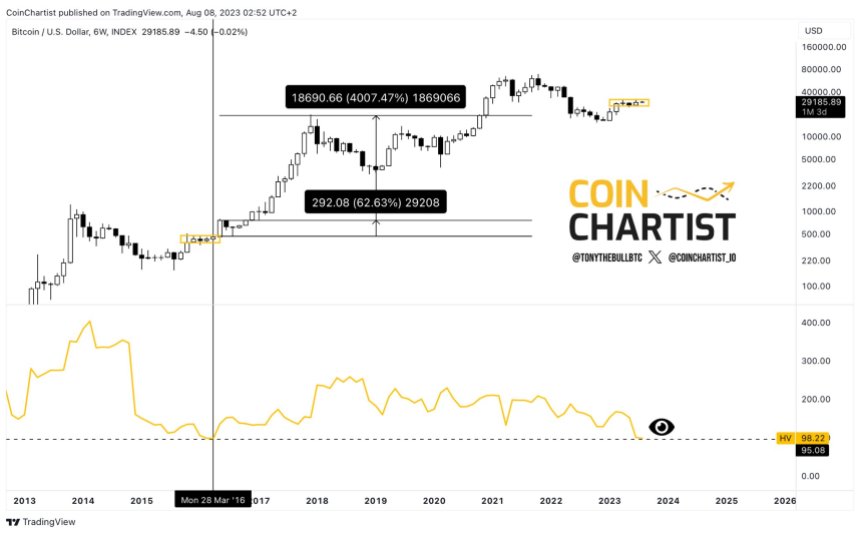
Of course, an alternative scenario is that Bitcoin simple remains in a sideways consolidation phase for several months longer to finish out 2023. Otherwise, a Bitcoin price prediction of $160,000 in 2023 isn’t impossible given past price trajectories and percentage moved.

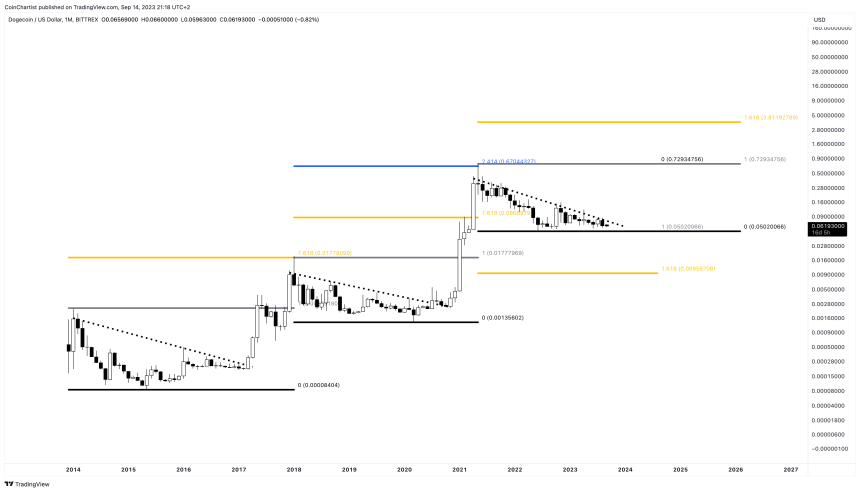
Medium-Term Bitcoin Price Prediction for 2024 & 2025

bitcoin price prediction 2024 2025
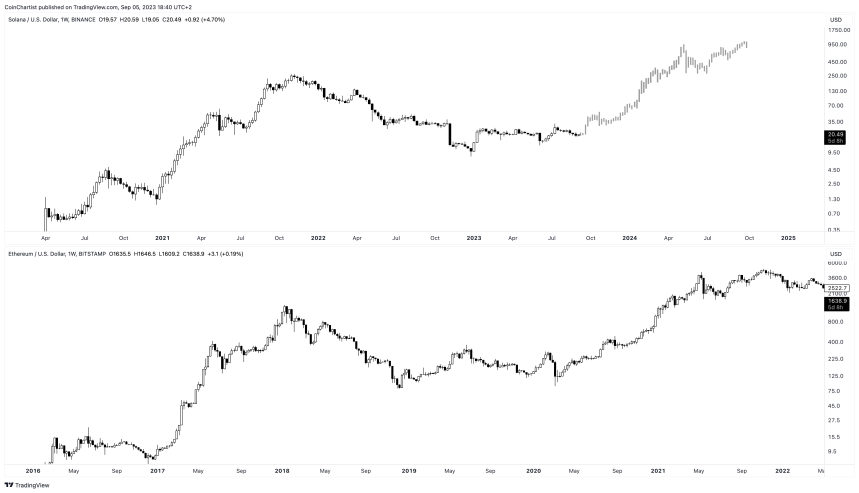
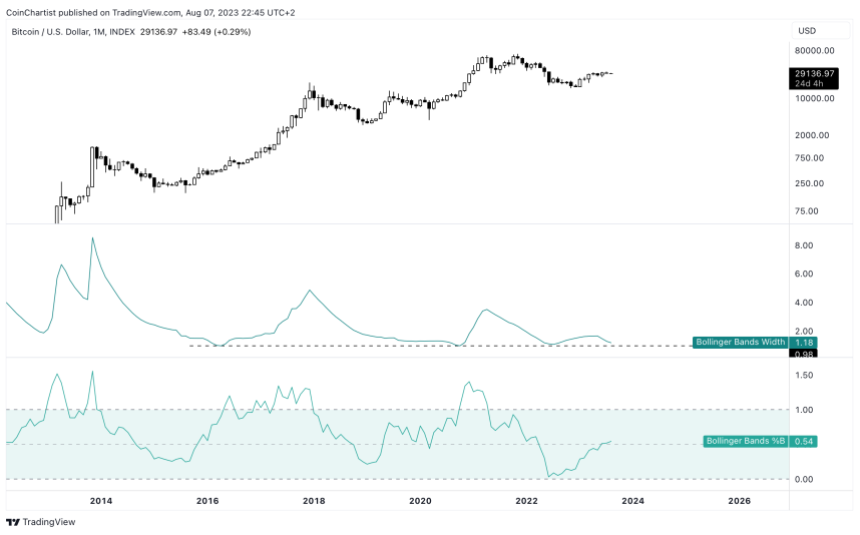
In the medium-term, Bitcoin price forecasts are based on the four-year cycle theory that relies on the Bitcoin block reward halving to tip the tides of supply and demand in favor of price appreciation. Fundamentally over the next several years, Bitcoin should have limited downside.

Instead, Bitcoin price predictions for 2024 and 2025 point to anywhere between $100,000 to $250,000 per coin on the upside.

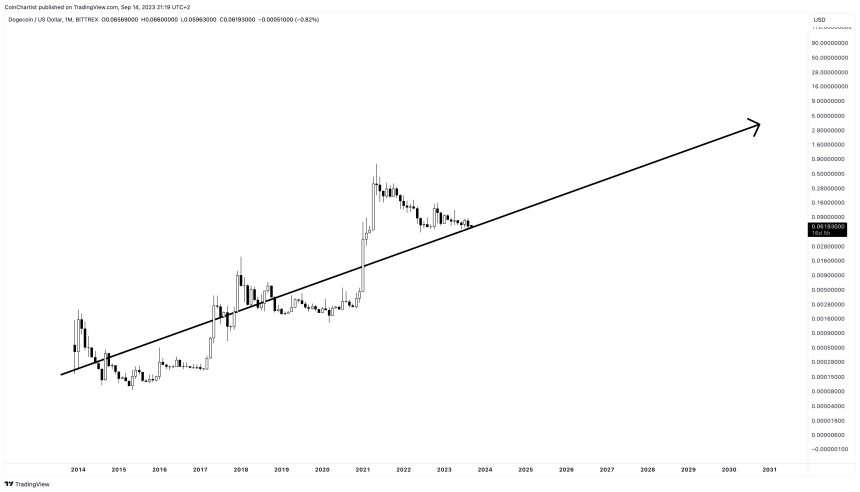
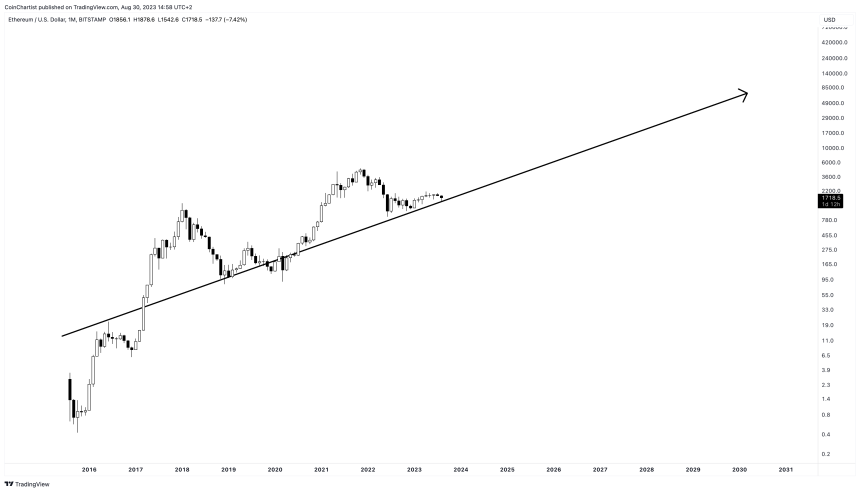
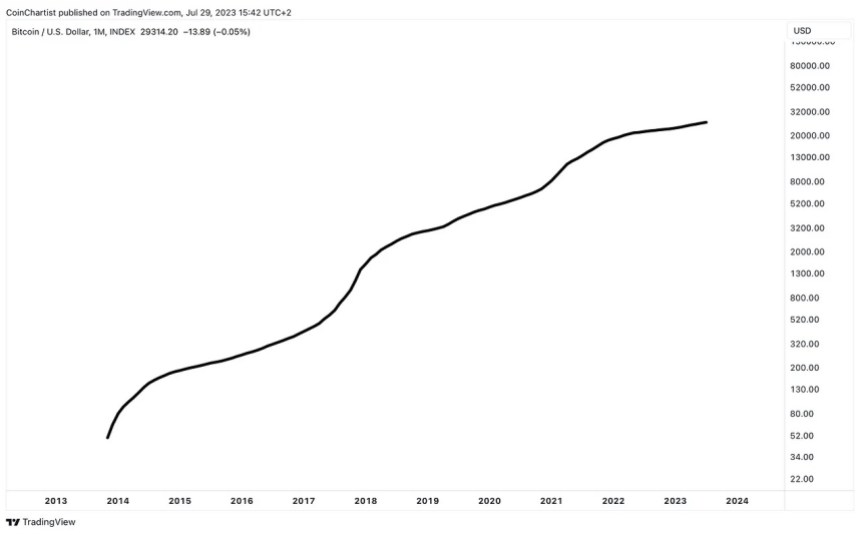
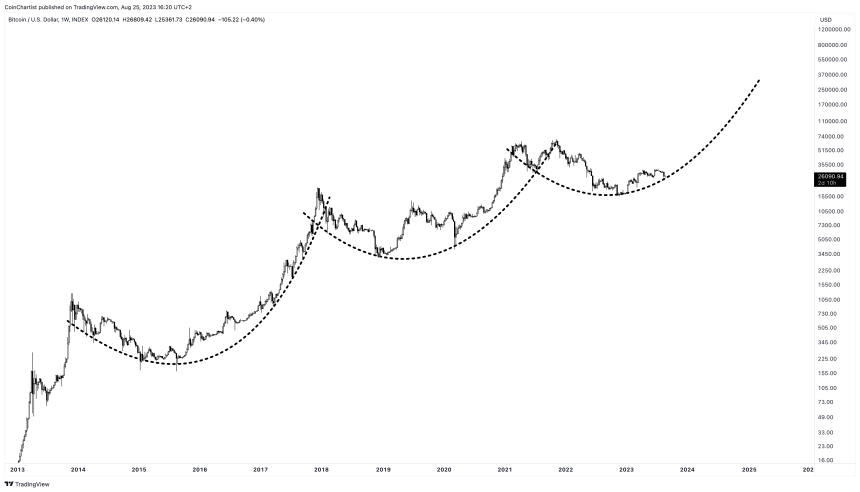
Long-term Bitcoin Price Prediction for 2030 and Beyond

bitcoin price prediction 2030

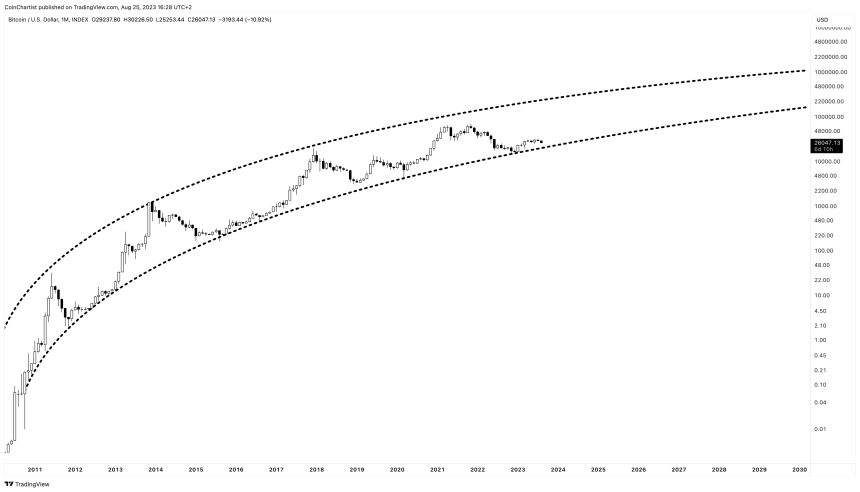
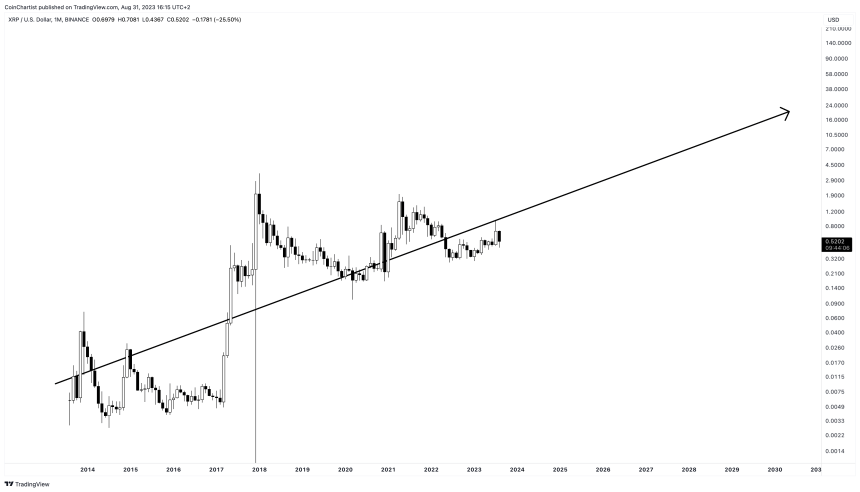
Predicting Bitcoin’s price in the long-term is challenging considering how new it still is. However, using a logarithmic growth curve, Bitcoin price predictions reach between $150,000 and $1 million per coin by 2030.

Further out into the future, if Bitcoin establishes itself as the leading global digital currency, it could be worth between $1 million and $10 million per coin.

Total 21 million BTC in supply would give Bitcoin a market cap of $21-$210 trillion, rivaling major assets like real estate and global broad money supply. But such valuations remain speculative. Bitcoin may also face future competition from both other cryptocurrencies and central bank digital currencies (CBDCs).

Bitcoin Price Predictions by Experts

Here are some Bitcoin price forecasts by noteworthy experts and analysts.

  • Ark Invest CEO Cathie Wood believes that Bitcoin could hit over $1,000,000 per coin in the long term, with a “base case” of $600,000.
  • Venture capitalist Tim Draper sees Bitcoin price ultimately at more than $250,000 per BTC by the end of 2025.
    • Standard Chartered has a Bitcoin price prediction of $120,000 by the end of 2024.

FAQ: Frequently Asked Questions

Here are answers to some common questions about this Bitcoin price prediction article:

What was Bitcoin’s lowest price?

The first recorded Bitcoin transaction in 2010 valued BTC at $0.0008. Bitcoin’s lowest recent price was around $15,800 in late 2022.

What was Bitcoin’s highest price?

Bitcoin’s all-time high price was around $68,000 in November 2021. 

How high could Bitcoin realistically go?

Considering growing mainstream adoption and investment interest, Bitcoin realistically could reach $100,000-$500,000 by 2030. A $1 million+ valuation cannot be ruled out in the very long-term.

Can Bitcoin price fall to zero?

It is unlikely Bitcoin price will crash to zero given its growing adoption, finite supply, and increasing regulation. There will likely always be some demand for Bitcoin which gives it fundamental value. Anything is possible, however. 

Why is Bitcoin price so volatile?

As a new asset class, Bitcoin is still establishing itself, leading to volatility. Manipulation by “whales”, media hype, and regulatory uncertainty add to large price swings. Price should stabilize with broader adoption.

When will Bitcoin price stop fluctuating so much?

Bitcoin price volatility should reduce significantly as it becomes a mainstream asset and gains broader public adoption in 5-10 years. But some short-term fluctuations will always remain.

Will Bitcoin price rise in 2023?

Considering adoption trends and investor interest, the overall Bitcoin price trajectory appears to be upwards in 2023 despite some short-term fluctuations. 

Bitcoin Reaches Most “Oversold” Record Since 2020: What This Means

Bitcoin price just experienced one of its fastest and sharpest corrections in over a year, dropping 10% in a matter of minutes.

The mass liquidations and panic from the selloff caused BTCUSD daily charts to reach the most oversold level since the COVID crash in early 2020.

BTC Panic-Selling Reaches Extremes Not Seen Since COVID Crash

As much as people try to fight it, investing and trading is an emotion-driven process. Few emotions cause humans to take action more urgently than those associated with fear and panic.

This is precisely why selloffs tend to be sharper and scarier than bull markets. “Bulls take the stairs, bears ride the elevator” is just one adage that symbolizes this noted market behavior.

For example, the COVID collapse in March 2020 took only a matter of days to erase 70% of Bitcoin’s price. This instance was the last time the Relative Strength Index technical indicator on the daily timeframe became this oversold.

After Bitcoin’s recently drop this week, the daily RSI is back at a similar extreme for the first time in more than three years. What isn’t clear quite yet, is if the extreme represents another ideal buying opportunity, or if this is the onset of a deeper decline.

BTCUSD_2023-08-21_09-03-46

Bitcoin Daily RSI Plunges To Most Oversold Level Since 2020

The Relative Strength Index is a momentum indicator that tells investors and traders when an asset is overbought and oversold on a relative basis. When the tool reaches extremes above 70 or below 30, it can present an opportunity to buy or sell. The RSI is now lower than the LUNA or FTX collapse, or at any point since March 2020.

During especially strong moves, however, the RSI can remain elevated for extended phases despite reaching such overheated readings. Such was the case in December 2018, the previous instance of the daily Bitcoin RSI reaching such a low.

In that case, the RSI stayed hot for two full weeks, cutting down BTCUSD price by another 40% before it was all said and done. A 40% correction in Bitcoin would take prices back to the November 2022 bottom.

If Bitcoin instead rebounds and reacts more akin to 2020, new all-time highs could be just months away. If not, a deeper reset is possible.

The Subtle Signs A Bullish Bitcoin Trend Is Brewing

Bitcoin price remains stagnant for going on months now, with no clear trend developing and volatility in a downward spiral. However, some subtle signs are popping up that could suggest that a bullish Bitcoin trend is beginning to take shape.

Make Friends With Strong Trends

“The trend is your friend” is one of the most famous trading quotes, highlighting how capturing as much of the prevailing trend as possible can lead to the most profitable results.

For this reason, in technical analysis, trend-following tools are among the most successful. But what is an investor or trader to do when there is a clear absence of any discernible trend?

The answer is “to wait for the trend to appear” but that’s easier said than done. This is why specific tools have been created to tell when assets like Bitcoin or even stocks are trending or not. One such tool is starting to rise after several weeks of sideways price action, and it suggest that the underlying trend is strengthening.

bitcoin adx

Bullish Bitcoin Is Building Muscle

The Average Directional Index (ADX) is a trend strength measuring tool, created by the father of technical indicators, J. Welles, Wilder, Jr. Other tools Wilder built include the Parabolic SAR, Average True Range, and the Relative Strength Index.

A reading above 20 on the ADX means a trend is developing. The more it turns up, the stronger the trend. After weeks of sideways, the trend is starting to strengthen again.

The tool also includes two Directional Movement indicators, the DI+ and DI-. The DI+ is currently above the DI-, showing that bulls in control of the underlying price action. All that’s left is for the ADX to strengthen further and Bitcoin could finally break out of this range and begin trending.

What Bitcoin bulls ultimately want to see next is for the ADX to grow even steeper, similar to what we can see in late 2020 and into early 2022. The lack of another strong trend at the second 2021 peak was a warning that something was off. Will the bullish trend continue to strengthen, or will bears regain control?

Bitcoin Futures Fakeout: The Price Divergence That Predicts A Phony

This week, Bitcoin traders braced for a breakout as an important technical buy signal triggered and BTCUSD shot up over $30,000 temporarily.

They came up short-handed, however, as the market took an immediate turn back down. Interestingly, the fakeout could have possibly been predicted by a divergence between two BTCUSD price charts.

Why Price Patterns And Technical Signals Can Fail

Price patterns are tough to trade in cryptocurrencies. Because so many eyes are on the same pattern meeting precise parameters, the market has a way of making people pay for acting on the obvious. For example, a rising wedge pattern is typically bearish, but could breakout to the upside.

The same is true for technical signals that a large portion of traders are paying attention to, such as notable crossovers and changes in momentum. This is exactly the case recently with a bullish crossover of the daily BTCUSD Moving Average Convergence Divergence (MACD).

The MACD is a momentum indicator that gives a buy signal when the MACD line crosses the signal line from below. This signal not only has appeared in Bitcoin, but it confirmed on BTCUSD spot exchanges, so what gives? It was a phony signal from the “future.”

Bitcoin futures

Spot Possible Divergences With Bitcoin Futures

By “future” we mean BTC CME Futures, also known as Chicago Mercantile Exchange’s Bitcoin derivatives product, which institutions use to speculate on the underlying price of BTCUSD. The BTC CME Futures chart doesn’t always reflect spot BTCUSD charts 1:1. Any divergences between the two platforms, has historically led to fakeouts and phony breakouts.

Part of the reason for this is due to the platform shutting down for a short period each day, and for the entire weekend starting at Friday afternoon. The result is a Bitcoin chart with more traditional market traits, such as gaps. The missing price data also changes the calculation of many technical indicators. For example, moving averages are in slightly different locations from chart to chart.

This is precisely how the recent “fakeout” higher was able to be predicted with a degree of accuracy. This discrepancy and divergence leading to false signals is nothing new and has been happening for years. When BTC CME finally participates in the same signal, the expected results often then arrive.

Is this a situation similar to Dow Theory, where the DJIA and DJTA must confirm one another for a trend to be valid? Or is there some more at play? Whatever the case may be, there’s enough historical evidence at this point to pay attention to any divergences between spot and CME Futures.

Will Record Low Volatility Awaken A Behemoth Bitcoin Surge? 4,000% Signal Returns

Bitcoin price has been ranging around $30,000 for most of 2023, taking even the highest timeframes down to a record low volatility state — something highly unusual for cryptocurrencies.

As a result, Historical Volatility in the 6W BTCUSD chart has fallen to the second lowest ever reading. The last time this signal appeared, it awakened a behemoth rally.
Prices soared in the short- and long-term. Keep reading to find out by how much.

Low Volatility Suggests Behemoth Bitcoin Rally Could Be Coming

NewsBTC has extensively covered the lack of volatility in Bitcoin using the Bollinger Bands. The Bollinger Bands are part of a trend-following, band-breakout trading system that also can be used to measure volatility.

But it’s not the only way to read it. Other volatility metrics include Implied Volatility, which uses the VIX to potentially predict future volatility, and Historical Volatility (HV). HV, just like it sounds, looks at volatility from the past.

The 6W Historical Volatility in BTCUSD is now at its second-lowest level ever. This is important because when an extended sideways phase ends, it ends by awakening a monster rally or decline.

Bitcoin behemoth

Is Another Monster 4,000% Move In BTCUSD Possible

Considering it’s only happened once before, the sample size is too small to come to a conclusion about which direction prices might head. However, the last time the 6W Historical Volatility got this low, and then broke out, the direction was up.

Not only was it up, but it was an immediate more than 60% move higher in a single 6W candle. The move that began around March 2016 also kicked off a more than year-long bull market that ended with more than 4,000% ROI following the period of inactivity.

The power of volatility once it returns to an asset long trending sideways cannot be understated. Another 4,000% is unlikely after seven years of adoption, but something massive is waking up regardless of the final numbers and direction.

Why Low Volatility Bitcoin Could Last A Lot Longer

Much has been said in recent weeks regarding how uncharacteristically calm Bitcoin has been. On weekly timeframes, volatility measures are at their lowest ever.

Unfortunately, despite the record-setting lull, directionless sideways price action could continue for a lot longer.

Record-Breaking Low Volatility State Could Continue Longer

Bitcoin price is at a standstill compared to its usually explosive self. It’s remained locked in a tight trading range, to the point where even a $300 move to either side might feel like a major breakout.

Few points throughout history on lower timeframes have ever been this quiet. This is according to the weekly Bollinger Bands and Bollinger Band Width readings.

Extreme tightening in the Bollinger Bands suggests what’s a called a Squeeze setup — a situation where following a low volatility phase of narrowing, the bands then expand and release a wave of volatility. It could be a lot longer until that happens, however.

Bitcoin low volatility

Examining Monthly Bollinger Band Width

While the weekly is at record tightness, using the very same tool on the monthly timeframe, shows that that there could be a lot further to go.

The Bollinger Band Width isn’t as low as it has been prior to past bull runs — notably to the lows of early 2016 and late 2020. This could suggest the possibility of months more sideways before a meaningful breakout to new all-time highs or a collapse back to lows.

None of this says much about direction thus far, but %B might hint at a move to the upside. The tool is plotted depending on price’s percentage relation to the upper, middle, and lower Bollinger Bands. As long as %B remains above 0.5 it means price is above the Bollinger Band basis — which is a 20-month simple moving average

Although we don’t know which direction Bitcoin ultimately moves, we do know that one thing is for certain: volatility will return in a major way. It’s just a matter of when, and how long we have to wait.

Crypto Storm Brewing: Bitcoin Vortex Indicator Flashes Buy Alert

Bitcoin has flashed an important high timeframe buy signal on the Vortex Indicator. Find out why this suggests a storm of buying could be brewing in crypto — and why it could soon suck up everything in its path.

Forecasting A Storm in Crypto

Like a meteorologist can with some degree of accuracy forecast the weather, a technical analyst can increase the probability of predicting price movements.

Both fields rely on on watching for potentially cyclical behavior, repeating patterns, seasonality, and historical trends. But instead of classifying cloud formations, technical analysts rely on Ichimoku clouds expanding and contracting with volatility, or other similar tools.

Yet another technical tool related to the elements, the Vortex Indicator, says that Bitcoin buying season is around the corner, and once it starts, it could suck in everyone that’s sidelined and then some.

bitcoin vortex indicator

About The Bitcoin Vortex Indicator

The 1M Bitcoin Vortex Indicator has crossed bullish. According to Wikipedia, a buy signal triggers when VM+ crossed above VM-. First revealed by creators Etienne Botes and Douglas Siepman in 2010, the tool helps “identify the start of a new trend or the continuation of the existing trend.”

Notably, in the past, each time the buy signal triggered, the bottom in Bitcoin was in. Even during the COVID collapse the monthly Vortex Indicator didn’t give another sell signal. Also worth mentioning is the fact that it appears to give its signal on the later side, after a bear or bull market is already visible. This speaks to the tool’s use for confirming trend changes. Only a handful of the buy side signals have triggered in BTCUSD history, and each time cryptocurrencies stormed substantially higher.

The Vortex Indicator was inspired by the work from Viktor Schauberger, an Austrian forest caretaker, naturalist, philosopher, inventor and pseudoscientist. Schauberger studied the flow of water in rivers and turbines during his career. Etienne Botes and Douglas Siepman developed the “idea that movements and flows within financial markets are similar to the vortex motions found in water.”

In nature, vortices are powerful forces inherent to whirlpools, tornados, and other powerful storms, known for sucking in everything in its path. Even the Great Red Spot on Jupiter is a vortex circling uncontrollably for hundreds – potentially thousands – of years. With this storm potentially changing direction, a wave of buying could be in the forecast.

This Long-Term Bitcoin Price Average Is Setting ATHs

Bitcoin price is nowhere near setting new all-time highs, but an important long-term price average is doing so, day after day, month after month.

What is this moving average being referenced, and what does it setting new highs potentially mean?

Bitcoin moving average

Meet The Moving Train: The 50-Month Moving Average

As Bitcoin and the rest of the crypto market grind painfully sideways, a key measure using a moving average of BTCUSD price action is rising steadily, now at its highest point ever historically.

The moving average in reference is the 50-month moving average (50MA). To calculate the span, simply take the last 50 months worth of BTCUSD closing prices, add them together, then divide them by the 50 (the number of months worth of data in the period).

Traders use moving averages for a variety of reasons. This includes as trend-following tool, as trend lines, and for timing entries and exits. Such signals trigger when price passes above or below the span, or if two moving averages crossover one another in a two-moving average system. These are called a golden cross or death cross.

What The 50MA Hitting ATHs Means For Bitcoin

The 50-month moving average making new all-time highs, general means the primary trend is still up. The chart above shows the long-term uptrend clearly without the noise of candlesticks or price action. With the candlesticks turned back on, Bitcoin is above the span — another bullish sign.

BTCUSD closed above the 50MA back in March 2023 and has since held above it for several months. Notably, Bitcoin lost this level for the first time back in June 2022. Meanwhile, the top cryptocurrency bottomed precisely at the 50MA in 2018 and again in 2020.

The 50MA is currently at $26,353 and could act as support of retested. If lost, it could be a sign the longer-term trend is turning bearish. The 200-week moving average, another similar high timeframe price indicator that is used widely in technical analysis, is also at a similar level and trending upwards.

This chart originally appeared in Issue #14 of CoinChartist (VIP). Subscribe for free.

Bitcoin Bollinger Bands Are The Tightest Ever, What Happens Next?

Last week, the 1W Bollinger Bands in Bitcoin reached its tightest level ever. The volatility measuring tool typically doesn’t give any indication of direction, however.

Using historical data, we’ve taken all previous instances of extreme lows and the resulting direction — up and down — and discovered the success rate of the signal.

Bollinger Band Width Reaches Historical Lows: What Does It Mean?

The Bollinger Bands are a complete trading system, designed by John Bollinger in the 1980s — an avid Bitcoin speculator. The tool uses a 20-period simple moving average (SMA) and two bands set at two standard deviations of the SMA.

As such, the “Bands” expand and contract based on volatility — a measure of how aggressively price moves within a time period. When the Bands tighten to extremes, it indicates a period of low volatility. This setup is called a Squeeze, which ultimately releases pent up energy and results in a large move. When price action picks up, the bands expand to represent the return of volatility.

According to Bollinger Band Width, a related tool designed to tell analysts how tight the bands on an easier to visually compare basis, the Bollinger Bands in BTCUSD are the tightest in the history of crypto. Notably, Ethereum and the TOTAL crypto market cap are also historically tight.

The technical indicator, however, doesn’t say anything about direction, only that something big is on the way. In the past, Bitcoin has broken out in either direction. But how many of these times were up? And how far did it climb?

Bitcoin Bollinger Bands

Bitcoin Breakout Performance Analyzed: Average 669% ROI When Volatility Returns

Past performance is never a guarantee of future results, but from historical price data we can better understand the behavior in BTCUSD after such low volatility phases.

Of the nine total instances the Bitcoin weekly Bollinger Bands got this tight, the top cryptocurrency by market cap rallied upward after upon breakout seven times. The average upward movement across all seven times is 872%. In contrast, the two down moves resulted in an average crash of 40%.<

Bitcoin falling 40% from here would take it back to $17,500 per coin, while a 872% move higher would take BTCUSD to over $280,000 per coin. The average of up and down moves resulted in a grand total of 669%, which would take the number one cryptocurrency to over $220,000. Considering the rule of diminishing returns, such a strong move is unlikely. However, the data speaks to the magnitude of the move that could occur, once volatility returns.

Don’t Change The Channel! Why Bitcoin Could Target $42K If Uptrend Holds

Bitcoin, the world’s largest cryptocurrency by market cap, has traded at or near $30K per coin for the better part of 2023.

Throughout the year, an uptrend channel has formed that is currently still holding. If support remains unbroken, it could propel BTCUSD to the top of the parallel channel which is currently located at or around $42K per coin.

A Bitcoin Price Channel For Your Viewing Pleasure

2023 might not have featured the same painful drawdowns in Bitcoin and other cryptocurrencies as 2022 did, but the market is still doling out suffering in the form of boring, sideways price action, and crypto winter PTSD.

Although BTCUSD has mostly been ranging around the $30,000 level for months now, it has overall remained in an uptrend. Uptrends are defined as a series of higher highs and higher lows.

Oftentimes, these uptrends are supported by drawing a trend line below intraday troughs. Depending on the price action, occasionally a parallel channel will form, providing both support and resistance on either end, keeping an uptrend from moving upward too quickly despite the general trajectory.

Such a parallel uptrend channel has formed in Bitcoin, and if the upward-sloping support trend line continues to stay solid and intact, a move to the top of the channel is likely.

bitcoin channel

Tune In To Find Out What Happens Next In Crypto

The channel began to form in late 2022, acting first as an upward-sloping support line that broke down during the FTX collapse. Bitcoin price then meandered sideways until a new, parallel upward-sloping support carried it higher. With the previous support now acting as resistance, it created the upper boundary of the parallel channel that price is now ping-ponging back and forth within.

If the current uptrend structure holds this latest selloff, a push to the upper resistance boundary is possible. As time ticks by, this upper boundary will reach $42K within the next week or two. If Bitcoin does indeed make a run for the upper boundary, this price is within striking distance by early August.

On the other hand, if the channel breaks down, it could be a sign the uptrend is over and short-lived. Failure to produce a meaningful rally could tell the market that the downtrend has resumed, and new lows are ahead.