ADA Price Prediction – Can Cardano Bulls Overcome This Key Hurdle?

Cardano (ADA) is attempting a fresh increase above the $0.4500 resistance zone. ADA could gain bullish momentum if it settles above the 100 SMA (H4).

  • ADA price is slowly moving high above the $0.450 zone.
  • The price is trading below $0.480 and the 100 simple moving average (4 hours).
  • There was a break above a key bearish trend line with resistance at $0.4580 on the 4-hour chart of the ADA/USD pair (data source from Kraken).
  • The pair could gain bullish momentum if there is a clear move above $0.470.

Cardano Price Attempts Fresh Increase

In the past few days, Cardano started a recovery wave from the $0.4180 zone, like Bitcoin and Ethereum. ADA price broke the $0.4350 and $0.4420 levels to move into a short-term bullish zone.

There was a move above the 23.6% Fib retracement level of the downward move from the $0.5227 swing high to the $0.4180 low. Besides, there was a break above a key bearish trend line with resistance at $0.4580 on the 4-hour chart of the ADA/USD pair.

Cardano is now trading below $0.480 and the 100 simple moving average (4 hours). On the upside, immediate resistance is near the $0.4650 zone and the 100 simple moving average (4 hours).

The first resistance is near $0.470 or the 50% Fib retracement level of the downward move from the $0.5227 swing high to the $0.4180 low. The next key resistance might be $0.4980. If there is a close above the $0.4980 resistance, the price could start a strong rally.

ADA Price Prediction

Source: ADAUSD on TradingView.com

In the stated case, the price could rise toward the $0.5250 region. Any more gains might call for a move toward $0.5650.

Another Decline in ADA?

If Cardano’s price fails to climb above the $0.470 resistance level and the 100 simple moving average (4 hours), it could start another decline. Immediate support on the downside is near the $0.450 level.

The next major support is near the $0.4350 level. A downside break below the $0.4350 level could open the doors for a test of $0.4180. The next major support is near the $0.3880 level.

Technical Indicators

4 hours MACD – The MACD for ADA/USD is losing momentum in the bearish zone.

4 hours RSI (Relative Strength Index) – The RSI for ADA/USD is now above the 50 level.

Major Support Levels – $0.4500, $0.4350, and $0.4180.

Major Resistance Levels – $0.4700, $0.4980, and $0.5250.

ADA Price Prediction – Can Cardano Reclaim 100 SMA and Rally?

Cardano (ADA) is moving lower below the $0.500 resistance zone. ADA could gain bearish momentum and decline if it stays below the 100 SMA (H4).

  • ADA price is slowly moving lower from the $0.520 zone.
  • The price is trading below $0.500 and the 100 simple moving average (4 hours).
  • There is a key bearish trend line forming with resistance at $0.4740 on the 4-hour chart of the ADA/USD pair (data source from Kraken).
  • The pair could attempt a fresh increase if the bulls remain active above the $0.4280 support.

Cardano Price Faces Key Hurdles

In the past few days, Cardano saw a steady decline from the $0.520 resistance zone, like Bitcoin and Ethereum. ADA price declined below the $0.500 and $0.4950 levels to enter a bearish zone.

There was a move below the 50% Fib retracement level of the upward move from the $0.4000 swing low to the $0.5201 high. It even declined below $0.4650 and tested $0.450. The price is now trading below $0.500 and the 100 simple moving average (4 hours).

There is also a key bearish trend line forming with resistance at $0.4740 on the 4-hour chart of the ADA/USD pair. The bulls seem to be active near the $0.450 zone and the 61.8% Fib retracement level of the upward move from the $0.4000 swing low to the $0.5201 high.

On the upside, immediate resistance is near the $0.4740 zone, the 100 simple moving average (4 hours), and the trend line. The first resistance is near $0.4920. The next key resistance might be $0.500. If there is a close above the $0.50 resistance, the price could start a strong rally.

ADA Price Prediction

Source: ADAUSD on TradingView.com

In the stated case, the price could rise toward the $0.5250 region. Any more gains might call for a move toward $0.5650.

More Losses in ADA?

If Cardano’s price fails to climb above the $0.4740 resistance level and the 100 simple moving average (4 hours), it could continue to move down. Immediate support on the downside is near the $0.450 level.

The next major support is near the $0.4280 level. A downside break below the $0.4280 level could open the doors for a test of $0.40. The next major support is near the $0.3880 level.

Technical Indicators

4 hours MACD – The MACD for ADA/USD is gaining momentum in the bearish zone.

4 hours RSI (Relative Strength Index) – The RSI for ADA/USD is now below the 50 level.

Major Support Levels – $0.4500, $0.4280, and $0.4000.

Major Resistance Levels – $0.4740, $0.5000, and $0.5200.

ADA Price Prediction – Here’s Why Cardano Could Dump To $0.50

Cardano (ADA) is moving lower below the $0.620 resistance zone. ADA could gain bearish momentum and decline toward the $0.50 support.

  • ADA price is slowly moving lower from the $0.670 zone.
  • The price is trading below $0.620 and the 100 simple moving average (4 hours).
  • There is a key bearish trend line forming with resistance at $0.6008 on the 4-hour chart of the ADA/USD pair (data source from Kraken).
  • The pair could attempt a fresh increase if the bulls remain active above the $0.560 support.

Cardano Price Reaches Key Support

In the past few days, Cardano saw a steady decline from the $0.670 resistance zone, like Bitcoin and Ethereum. ADA price declined below the $0.650 and $0.620 levels to enter a bearish zone.

It even declined below $0.580 and tested $0.560. A low is formed at $0.5592 and the price is consolidating losses. It tested the 23.6% Fib retracement level of the downward move from the $0.6701 swing high to the $0.5592 low.

ADA price is now trading below $0.620 and the 100 simple moving average (4 hours). On the upside, immediate resistance is near the $0.6010 zone. There is also a key bearish trend line forming with resistance at $0.6008 on the 4-hour chart of the ADA/USD pair.

The first resistance is near $0.6150 or the 50% Fib retracement level of the downward move from the $0.6701 swing high to the $0.5592 low. The next key resistance might be $0.6280. If there is a close above the $0.6280 resistance, the price could start a strong rally.

ADA Price Prediction

Source: ADAUSD on TradingView.com

In the stated case, the price could rise toward the $0.6550 region. Any more gains might call for a move toward $0.670.

More Losses in ADA?

If Cardano’s price fails to climb above the $0.6150 resistance level, it could continue to move down. Immediate support on the downside is near the $0.560 level.

The next major support is near the $0.520 level. A downside break below the $0.520 level could open the doors for a test of $0.50. The next major support is near the $0.4880 level.

Technical Indicators

4 hours MACD – The MACD for ADA/USD is gaining momentum in the bearish zone.

4 hours RSI (Relative Strength Index) – The RSI for ADA/USD is now below the 50 level.

Major Support Levels – $0.5600, $0.5200, and $0.4880.

Major Resistance Levels – $0.6150, $0.6280, and $0.6700.

ADA Price Prediction – Here’s Why Cardano Could Pump Again Above $0.75

Cardano (ADA) is correcting gains from the $0.80 resistance zone. ADA could start a fresh increase if it stays above the $0.6880 support zone.

  • ADA price is slowly moving lower from the $0.80 zone.
  • The price is trading below $0.720 and the 100 simple moving average (4 hours).
  • There is a key bullish trend line forming with support at $0.6880 on the 4-hour chart of the ADA/USD pair (data source from Kraken).
  • The pair could attempt a fresh increase if the bulls remain active above the $0.680 support.

Cardano Price Reaches Key Support

After forming a base above the $0.580 level, Cardano started a fresh increase. ADA price was able to climb above the $0.620 and $0.680 resistance levels to move into a positive zone, like Bitcoin and Ethereum.

The bulls pushed the pair above the $0.700 resistance zone. However, the bears were active near the $0.80 resistance zone. A high was formed near $0.8097 and the price started a downside correction. There was a move below the $0.750 level.

The price declined below the 23.6% Fib retracement level of the upward wave from the $0.5754 swing low to the $0.8097 high. ADA price is now trading below $0.7250 and the 100 simple moving average (4 hours).

There is also a key bullish trend line forming with support at $0.6880 on the 4-hour chart of the ADA/USD pair. The trend line is near the 50% Fib retracement level of the upward wave from the $0.5754 swing low to the $0.8097 high.

ADA Price Prediction

Source: ADAUSD on TradingView.com

The bulls might remain active near the $0.680 support. On the upside, immediate resistance is near the $0.7220 zone. The first resistance is near $0.740. The next key resistance might be $0.800. If there is a close above the $0.800 resistance, the price could start a strong rally. In the stated case, the price could rise toward the $0.8250 region. Any more gains might call for a move toward $0.850.

More Losses in ADA?

If Cardano’s price fails to climb above the $0.7220 resistance level, it could continue to move down. Immediate support on the downside is near the $0.6880 level.

The next major support is near the $0.680 level. A downside break below the $0.680 level could open the doors for a test of $0.6350. The next major support is near the $0.6120 level.

Technical Indicators

4 hours MACD – The MACD for ADA/USD is losing momentum in the bearish zone.

4 hours RSI (Relative Strength Index) – The RSI for ADA/USD is now below the 50 level.

Major Support Levels – $0.6880, $0.6800, and $0.6350.

Major Resistance Levels – $0.7220, $0.7400, and $0.8000.

ADA Price Prediction – Here’s Why Cardano Surge Is Far From Over

Cardano (ADA) is gaining pace above the $0.635 resistance zone. ADA is consolidating gains and might aim for more upsides above the $0.70 resistance.

  • ADA price is holding gains and facing resistance near the $0.70 zone.
  • The price is trading above $0.640 and the 100 simple moving average (4 hours).
  • There is a key bullish trend line forming with support at $0.6350 on the 4-hour chart of the ADA/USD pair (data source from Kraken).
  • The pair could attempt a fresh increase if the bulls remain active above the $0.6220 support.

Cardano Price Eyes Another Increase

After forming a base above the $0.5650 level, Cardano started a fresh increase. ADA price was able to climb above the $0.600 and $0.6220 resistance levels to move into a positive zone, like Bitcoin and Ethereum.

The bulls pushed the pair above the $0.650 resistance zone. However, the bears were active near the $0.700 resistance zone. A high was formed near $0.7084 and the price started a downside correction. There was a move below the $0.6750 level.

The price declined below the 23.6% Fib retracement level of the upward wave from the $0.5685 swing low to the $0.7084 high. ADA price is now trading above $0.640 and the 100 simple moving average (4 hours).

There is also a key bullish trend line forming with support at $0.6350 on the 4-hour chart of the ADA/USD pair. The trend line is near the 50% Fib retracement level of the upward wave from the $0.5685 swing low to the $0.7084 high.

ADA Price Prediction

Source: ADAUSD on TradingView.com

The bulls might remain active near the $0.6350 support. On the upside, immediate resistance is near the $0.6750 zone. The first resistance is near $0.692. The next key resistance might be $0.700. If there is a close above the $0.700 resistance, the price could start a strong rally. In the stated case, the price could rise toward the $0.750 region. Any more gains might call for a move toward $0.80.

Downside Correction in ADA?

If Cardano’s price fails to climb above the $0.6750 resistance level, it could continue to move down. Immediate support on the downside is near the $0.6350 level.

The next major support is near the $0.6220 level. A downside break below the $0.6220 level could open the doors for a test of $0.600. The next major support is near the $0.5680 level.

Technical Indicators

4 hours MACD – The MACD for ADA/USD is losing momentum in the bullish zone.

4 hours RSI (Relative Strength Index) – The RSI for ADA/USD is now above the 50 level.

Major Support Levels – $0.6350, $0.6220, and $0.6000.

Major Resistance Levels – $0.6750, $0.6920, and $0.7000.

ADA Price Reaches Key Juncture – Can Cardano Start A Fresh Surge?

Cardano (ADA) is correcting gains from the $0.642 resistance zone. ADA could start a fresh rally if it stays above the $0.5550 support zone.

  • ADA price is showing a few bearish signs below the $0.600 level.
  • The price is trading above $0.5550 and the 100 simple moving average (4 hours).
  • There was a break below a key bullish trend line with support at $0.610 on the 4-hour chart of the ADA/USD pair (data source from Kraken).
  • The pair could attempt a fresh increase if the bulls remain active above the $0.570 support.

Cardano Price Dips To Support

After forming a base above the $0.520 level, Cardano started a fresh increase. ADA price was able to climb above the $0.555 and $0.565 resistance levels to move into a positive zone, like Bitcoin and Ethereum.

The bulls pushed the pair above the $0.600 resistance zone. However, the bears were active near the $0.6420 resistance zone. A high was formed near $0.6419 and the price started a downside correction. There was a move below the $0.600 level.

There was also a break below a key bullish trend line with support at $0.610 on the 4-hour chart of the ADA/USD pair. The price declined below the 23.6% Fib retracement level of the upward move from the $0.4718 swing low to the $0.6419 high.

ADA price is now trading below $0.600 and the 100 simple moving average (4 hours). The bulls might remain active near the $0.5700 support or the 50% Fib retracement level of the upward move from the $0.4718 swing low to the $0.6419 high.

ADA Price

Source: ADAUSD on TradingView.com

On the upside, immediate resistance is near the $0.600 zone. The first resistance is near $0.612. The next key resistance might be $0.620. If there is a close above the $0.620 resistance, the price could start a strong rally. In the stated case, the price could rise toward the $0.642 region. Any more gains might call for a move toward $0.680.

More Losses in ADA?

If Cardano’s price fails to climb above the $0.600 resistance level, it could continue to move down. Immediate support on the downside is near the $0.570 level.

The next major support is near the $0.5550 level. A downside break below the $0.5500 level could open the doors for a test of $0.5120. The next major support is near the $0.500 level.

Technical Indicators

4 hours MACD – The MACD for ADA/USD is losing momentum in the bullish zone.

4 hours RSI (Relative Strength Index) – The RSI for ADA/USD is now below the 50 level.

Major Support Levels – $0.570, $0.5550, and $0.5120.

Major Resistance Levels – $0.600, $0.6120, and $0.6420.

ADA Price Is Primed For A Rally And Only 1 Thing Is Holding It Back

Cardano (ADA) is attempting a fresh increase from the $0.4720 zone. ADA could start a fresh rally if there is a close above the $0.5350 resistance.

  • ADA price is moving higher above the $0.500 zone.
  • The price is trading above $0.512 and the 100 simple moving average (4 hours).
  • There was a break above a key bearish trend line with resistance near $0.510 on the 4-hour chart of the ADA/USD pair (data source from Kraken).
  • The pair could accelerate higher if there is a clear move above $0.535 and $0.550.

Cardano Price Eyes Fresh Increase

After forming a base above the $0.4720 level, Cardano started a fresh increase. ADA price was able to climb above the $0.485 and $0.500 resistance levels to move into a positive zone, like Bitcoin and Ethereum.

There was a break above a key bearish trend line with resistance near $0.510 on the 4-hour chart of the ADA/USD pair. The bulls pushed the pair above the $0.520 resistance zone. However, the bears are now active near the $0.535 resistance zone.

ADA price is now trading above $0.512 and the 100 simple moving average (4 hours). It is also above the 23.6% Fib retracement level of the recent increase from the $0.4718 swing low to the $0.5354 high.

ADA Price

Source: ADAUSD on TradingView.com

On the upside, immediate resistance is near the $0.535 zone. The first resistance is near $0.545 and $0.550. The next key resistance might be $0.565. If there is a close above the $0.565 resistance, the price could start a strong rally. In the stated case, the price could rise toward the $0.600 region. Any more gains might call for a move toward $0.620.

Another Decline in ADA?

If Cardano’s price fails to climb above the $0.535 resistance level, it could start a fresh decline. Immediate support on the downside is near the $0.520 level.

The next major support is near the $0.5040 level or the 50% Fib retracement level of the recent increase from the $0.4718 swing low to the $0.5354 high. A downside break below the $0.5040 level could open the doors for a test of $0.485. The next major support is near the $0.4720 level.

Technical Indicators

4 hours MACD – The MACD for ADA/USD is losing momentum in the bullish zone.

4 hours RSI (Relative Strength Index) – The RSI for ADA/USD is now above the 50 level.

Major Support Levels – $0.520, $0.5040, and $0.4720.

Major Resistance Levels – $0.5350, $0.550, and $0.600.

ADA Price Faces Key Hurdle, Can Cardano Surpass This To Start Fresh Rally?

Cardano (ADA) is attempting a recovery wave from the $0.4650 zone. ADA could start a fresh rally if there is a close above the $0.550 resistance.

  • ADA price is moving higher from the $0.4650 zone.
  • The price is trading below $0.570 and the 100 simple moving average (4 hours).
  • There is a key bearish trend line forming with resistance near $0.545 on the 4-hour chart of the ADA/USD pair (data source from Kraken).
  • The pair could accelerate higher if there is a clear move above $0.545 and $0.550.

Cardano Price Attempts Fresh Increase

After a strong rally, Cardano faced sellers near the $0.675 zone. ADA started a fresh decline below the $0.620 and $0.600 support levels, unlike Bitcoin and Ethereum.

There was a drop below the $0.550 support and the 100 simple moving average (4 hours). Finally, the price found support near the $0.4650 zone. The price is now attempting a fresh increase above the $0.500 resistance zone. The price tested the 23.3% Fib retracement level of the downward move from the $0.6768 swing high to the $0.4650 low.

ADA is now trading below $0.570 and the 100 simple moving average (4 hours). There is also a key bearish trend line forming with resistance near $0.545 on the 4-hour chart of the ADA/USD pair.

On the upside, immediate resistance is near the $0.532 zone. The first resistance is near $0.545 and $0.550. The next key resistance might be $0.570 or the 50% Fib retracement level of the downward move from the $0.6768 swing high to the $0.4650 low.

Cardano Price ADA

Source: ADAUSD on TradingView.com

If there is a close above the $0.570 resistance, the price could start a strong rally. In the stated case, the price could rise toward the $0.620 region. Any more gains might call for a move toward $0.650.

Another Decline in ADA?

If Cardano’s price fails to climb above the $0.545 resistance level, it could start a fresh decline. Immediate support on the downside is near the $0.500 level.

The next major support is near the $0.465 level. A downside break below the $0.465 level could open the doors for a test of $0.432. The next major support is near the $0.420 level.

Technical Indicators

4 hours MACD – The MACD for ADA/USD is losing momentum in the bearish zone.

4 hours RSI (Relative Strength Index) – The RSI for ADA/USD is now below the 50 level.

Major Support Levels – $0.500, $0.465, and $0.432.

Major Resistance Levels – $0.532, $0.545, and $0.570.

ADA Price Surges Over 35% In Few Days, Can Bulls Pump Cardano To $1?

Cardano (ADA) is gaining pace above the $0.60 resistance. ADA could rally further if there is a clear move above the $0.685 and $0.700 resistance levels.

  • ADA price is moving higher above the $0.600 pivot level.
  • The price is trading above $0.620 and the 100 simple moving average (4 hours).
  • There is a key bullish trend line forming with support near $0.6020 on the 4-hour chart of the ADA/USD pair (data source from Kraken).
  • The pair could accelerate higher toward the $0.800 level or even $1.00 in the coming weeks.

Cardano Price Starts Fresh Rally

After forming a base above the $0.500 level, Cardano started a steady increase. There was a break above the $0.550 and $0.600 resistance levels, outperforming Bitcoin and Ethereum.

ADA cleared many hurdles and even spiked above $0.680. A new multi-week high was formed near $0.6802 and the price is now consolidating gains. There was a minor decline below the 23.3% Fib retracement level of the upward move from the $0.5220 swing low to the $0.6802 high.

ADA is now trading above $0.500 and the 100 simple moving average (4 hours). There is also a key bullish trend line forming with support near $0.6020 on the 4-hour chart of the ADA/USD pair. The trend line is close to the 50% Fib retracement level of the upward move from the $0.5220 swing low to the $0.6802 high.

Cardano Price ADA

Source: ADAUSD on TradingView.com

On the upside, immediate resistance is near the $0.660 zone. The first resistance is near $0.685. The next key resistance might be $0.700. If there is a close above the $0.700 resistance, the price could start a strong rally. In the stated case, the price could rise toward the $0.80 region. Any more gains might call for a move toward $1.00.

Are Dips Limited in ADA?

If Cardano’s price fails to climb above the $0.685 resistance level, it could start a downside correction. Immediate support on the downside is near the $0.6200 level.

The next major support is near the $0.600 level and the trend line. A downside break below the $0.600 level could open the doors for a test of $0.5550. The next major support is near the $0.5220 level.

Technical Indicators

4 hours MACD – The MACD for ADA/USD is losing momentum in the bullish zone.

4 hours RSI (Relative Strength Index) – The RSI for ADA/USD is now above the 50 level.

Major Support Levels – $0.620, $0.600, and $0.555.

Major Resistance Levels – $0.685, $0.700, and $0.800.

ADA Price Claims $0.40 And Recovery Could Soon Turn Into Rally

Cardano (ADA) is gaining pace above the $0.40 resistance. ADA could rally if there is a clear move above the $0.432 and $0.450 resistance levels.

  • ADA price is moving higher above the $0.400 pivot level.
  • The price is trading above $0.415 and the 100 simple moving average (4 hours).
  • There is a key bullish trend line forming with support near $0.410 on the 4-hour chart of the ADA/USD pair (data source from Kraken).
  • The pair could accelerate higher toward the $0.500 level or even $0.550.

Cardano Price Starts Steady Increase

After forming a base above the $0.3750 level, Cardano started a steady increase. There was a break above the $0.388 and $0.400 resistance levels, but ADA lagged momentum like Bitcoin and Ethereum.

The price even climbed above the $0.420 resistance. A high was formed near $0.4293 and the price is now consolidating gains. It is trading above the 23.3% Fib retracement level of the upward move from the $0.3715 swing low to the $0.4293 high.

ADA is now trading above $0.415 and the 100 simple moving average (4 hours). There is also a key bullish trend line forming with support near $0.410 on the 4-hour chart of the ADA/USD pair.

ADA Price

Source: ADAUSD on TradingView.com

On the upside, immediate resistance is near the $0.4250 zone. The first resistance is near $0.432. The next key resistance might be $0.450. If there is a close above the $0.450 resistance, the price could start a strong rally. In the stated case, the price could rise toward the $0.50 region. Any more gains might call for a move toward $0.550.

Are Dips Supported in ADA?

If Cardano’s price fails to climb above the $0.432 resistance level, it could start a downside correction. Immediate support on the downside is near the $0.4150 level.

The next major support is near the $0.410 level and the trend line. A downside break below the $0.410 level could open the doors for a test of $0.388. The next major support is near the $0.372 level.

Technical Indicators

4 hours MACD – The MACD for ADA/USD is gaining momentum in the bullish zone.

4 hours RSI (Relative Strength Index) – The RSI for ADA/USD is now above the 50 level.

Major Support Levels – $0.415, $0.410, and $0.388.

Major Resistance Levels – $0.432, $0.450, and $0.500.

ADA Price (Cardano) Breaking This Confluence Resistance Could Restart Rally

Cardano (ADA) is moving higher from the $0.350 support. ADA could rally if there is a clear move above the $0.388 and $0.395 resistance levels.

  • ADA price is moving higher above the $0.375 pivot level.
  • The price is trading above $0.380 and the 100 simple moving average (4 hours).
  • There is a key bullish trend line forming with support near $0.370 on the 4-hour chart of the ADA/USD pair (data source from Kraken).
  • The pair could accelerate higher toward the $0.420 level or even $0.450.

Cardano Price Rally Could Soon Restart

After a steady increase, Cardano saw a downside correction from the $0.4090 zone. There was a drop below the $0.395 and $0.388 support levels, like Bitcoin and Ethereum.

However, the bulls were active near the $0.350 support zone. A low was formed near $0.3494 and the price is now moving higher. There was a break above the $0.365 and $0.375 resistance levels. The price climbed above the 50% Fib retracement level of the downward move from the $0.4090 swing high to the $0.3494 low.

ADA is now trading above $0.375 and the 100 simple moving average (4 hours). There is also a key bullish trend line forming with support near $0.370 on the 4-hour chart of the ADA/USD pair.

ADA Price

Source: ADAUSD on TradingView.com

On the upside, immediate resistance is near the $0.3880 zone or the 61.8% Fib retracement level of the downward move from the $0.4090 swing high to the $0.3494 low. The first resistance is near $0.395. The next key resistance might be $0.400. If there is a close above the $0.400 resistance, the price could extend its rally. In the stated case, the price could rise toward the $0.420 region. Any more gains might call for a move toward $0.450.

Are Dips Supported in ADA?

If Cardano’s price fails to climb above the $0.388 resistance level, it could start a downside correction. Immediate support on the downside is near the $0.370 level and the trend line.

The next major support is near the $0.365 level and the 100 hourly SMA. A downside break below the $0.365 level could open the doors for a test of $0.350. The next major support is near the $0.335 level.

Technical Indicators

4 hours MACD – The MACD for ADA/USD is gaining momentum in the bullish zone.

4 hours RSI (Relative Strength Index) – The RSI for ADA/USD is now above the 50 level.

Major Support Levels – $0.370, $0.365, and $0.350.

Major Resistance Levels – $0.388, $0.395, and $0.420.

ADA Price Prediction – Cardano Could See “Face Ripping” Rally

Cardano (ADA) is gaining pace above the $0.350 resistance. ADA is showing heavy bullish signs and might rally toward $0.400 or even $0.420.

  • ADA price outperformed Bitcoin and rallied above the $0.350 resistance.
  • The price is trading above $0.350 and the 100 simple moving average (4 hours).
  • There is a key bullish trend line forming with support near $0.3505 on the 4-hour chart of the ADA/USD pair (data source from Kraken).
  • The pair could accelerate higher toward the $0.400 level or even $0.420.

Cardano Price Rally Seems Far From Over

In the past few days, Cardano saw a decent increase from the $0.2850 support. It is up over 20% and broke many hurdles near the $0.350 resistance zone, outperforming Bitcoin and Ethereum.

The upward move was such that the price spiked toward $0.3750. A high was formed near $0.3755 before there was a downside correction. The price declined below the $0.3550 support. It spiked below the 23.6% Fib retracement level of the upward move from the $0.2845 swing low to the $0.3755 high.

However, the bulls were active above the $0.3400 zone. There is also a key bullish trend line forming with support near $0.3505 on the 4-hour chart of the ADA/USD pair.

ADA Price Prediction

Source: ADAUSD on TradingView.com

ADA is now trading above $0.350 and the 100 simple moving average (4 hours). On the upside, immediate resistance is near the $0.3750 zone. The first resistance is near $0.380. The next key resistance might be $0.400. If there is a close above the $0.400 resistance, the price could extend its rally. In the stated case, the price could rise toward the $0.420 region.

Are Dips Limited in ADA?

If Cardano’s price fails to climb above the $0.3750 resistance level, it could start a downside correction. Immediate support on the downside is near the $0.3550 level.

The next major support is near the $0.350 level and the trend line. A downside break below the $0.350 level could open the doors for a test of the 50% Fib retracement level of the upward move from the $0.2845 swing low to the $0.3755 high at $0.3300. The next major support is near the $0.3080 level.

Technical Indicators

4 hours MACD – The MACD for ADA/USD is gaining momentum in the bullish zone.

4 hours RSI (Relative Strength Index) – The RSI for ADA/USD is now above the 50 level.

Major Support Levels – $0.355, $0.350, and $0.330.

Major Resistance Levels – $0.375, $0.400, and $0.420.

ADA Price Prediction – 10% Surge In Two Days, Bulls Aim For $0.35

Cardano (ADA) started a fresh increase above the $0.30 resistance. ADA is outperforming Bitcoin and might aim for a move toward the $0.35 resistance.

  • ADA price regained strength for a move above the $0.265 and $0.280 levels against the US dollar.
  • The price is trading above $0.30 and the 100 simple moving average (4 hours).
  • There is a key bullish trend line forming with support near $0.3050 on the 4-hour chart of the ADA/USD pair (data source from Kraken).
  • The pair must stay above the $0.308 support to start a fresh increase in the near term.

Cardano Price Regains Strength

After a couple of swing moves, Cardano was able to gain strength for a move above the $0.28 resistance. It rallied above the $0.30 resistance to move further into a positive zone. It is up over 10% in two days, outperforming Bitcoin and Ethereum.

A new multi-week high is formed near $0.3295 and the price is now consolidating gains. There was a minor correction below the 23.6% Fib retracement level of the upward move from the $0.2847 swing low to the $0.3295 high.

ADA is now trading above $0.30 and the 100 simple moving average (4 hours). There is also a key bullish trend line forming with support near $0.3050 on the 4-hour chart of the ADA/USD pair. The trend line is close to the 50% Fib retracement level of the upward move from the $0.2847 swing low to the $0.3295 high.

ADA Price Prediction

Source: ADAUSD on TradingView.com

On the upside, immediate resistance is near the $0.3280 zone. The first resistance is near $0.332. The next key resistance might be $0.350. If there is a close above the $0.350 resistance, the price could extend its rally. In the stated case, the price could rise toward the $0.385 resistance zone.

Are Dips Supported in ADA?

If Cardano’s price fails to climb above the $0.328 resistance level, it could continue to move down. Immediate support on the downside is near the $0.310 level.

The next major support is near the $0.308 level and the trend line. A downside break below the $0.308 level could open the doors for a sharp fresh decline toward $0.285. The next major support is near the $0.274 level.

Technical Indicators

4 hours MACD – The MACD for ADA/USD is losing momentum in the bullish zone.

4 hours RSI (Relative Strength Index) – The RSI for ADA/USD is now above the 50 level.

Major Support Levels – $0.310, $0.308, and $0.285.

Major Resistance Levels – $0.328, $0.332, and $0.350.

Cardano (ADA) Price Prediction for 2023, 2024, 2025 and Beyond

Cardano is one of the most actively developed blockchains with an ambitious roadmap. Its native ADA token has seen immense growth since launching in 2017. This article explores what’s next for Cardano prices.

What is Cardano (ADA)?

Cardano is an open-source proof-of-stake blockchain network founded by Ethereum co-founder Charles Hoskinson in 2015. It aims to provide fast, secure, and scalable blockchain transactions through leading research and development.

The Cardano blockchain is divided into layers handling different functions:

  • Cardano Settlement Layer (CSL) handles peer-to-peer transactions using the native ADA cryptocurrency.
  • Cardano Control Layer (CCL) runs smart contracts allowing decentralized apps and protocols.

Some key aspects of Cardano include:

Proof-of-stake consensus

Cardano uses an Ouroboros PoS algorithm that is less energy intensive than PoW blockchains.

Research-driven approach

Cardano takes a science and philosophy-based approach for robust protocols.

Multi-phase roadmap

Cardano is being developed systematically in stages as part of a long-term strategy.

Governance model

ADA holders can vote on Cardano Improvement Proposals to determine future upgrades.

Significant capabilities

Cardano aims to rival Ethereum as the leading smart contract platform once development completes.

Due to its organized development path, Cardano proponents believe it can achieve the vision of becoming the most advanced blockchain.

ADA Price Prediction

Factors Influencing Cardano’s Price

Several core factors impact Cardano prices and market outlook:

Cryptocurrency Market Trends

Like most altcoins, Cardano’s price depends significantly on the performance of top cryptos Bitcoin and Ethereum. Rising crypto markets lift ADA. Bullish Cardano news also can have an impact. 

Project Roadmap Progress

Cardano hitting major roadmap milestones like launching smart contracts demonstrates real-world viability and boosts ADA price.

Adoption By Developers

As developers build dApps, DeFi protocols and NFT projects on Cardano, utility grows along with demand for ADA tokens.

Staking Participation

Higher staking uptake increases locked ADA supply reducing selling pressure and potentially raising prices.

Competition

Interoperability blockchains like Polkadot and Cosmos or faster networks like Solana threaten to erode Cardano’s market share which impacts growth potential.

Upgrades and Governance

Smooth upgrades through community governance signals stability and reliability, instilling confidence in the network and ADA price.

Major Cardano Price History Developments

Cardano is still early in its developmental journey. Here are key highlights so far:

2017 – Shelley Era Begins

ADAUSD_2023-10-12_15-11-27

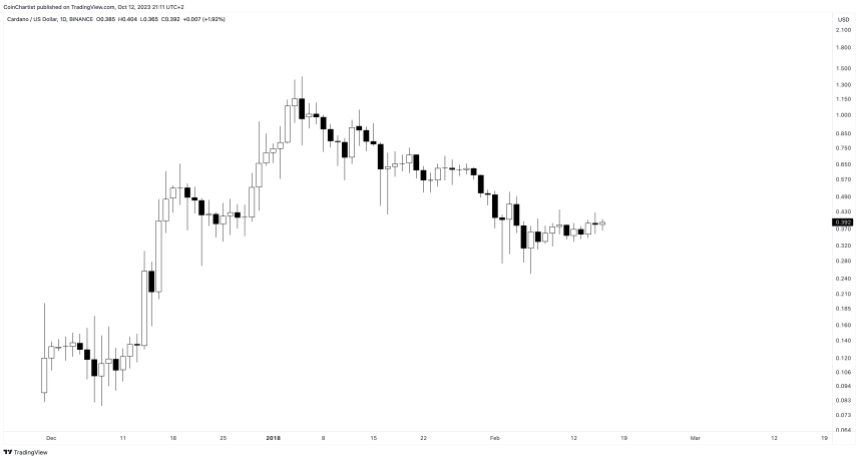
ADA tokens were first made available in early 2017, trading around $0.02 during the initial months. As the crypto market surged, ADA hit an all-time high of $1.33 in January 2018 before declining with the broader market.

The Shelley phase of decentralization development began, with staking and community governance capabilities being built. This marked a major step towards realizing Cardano’s vision.

2018-2020 – Bear Market Consolidation

ADAUSD_2023-10-12_15-12-07

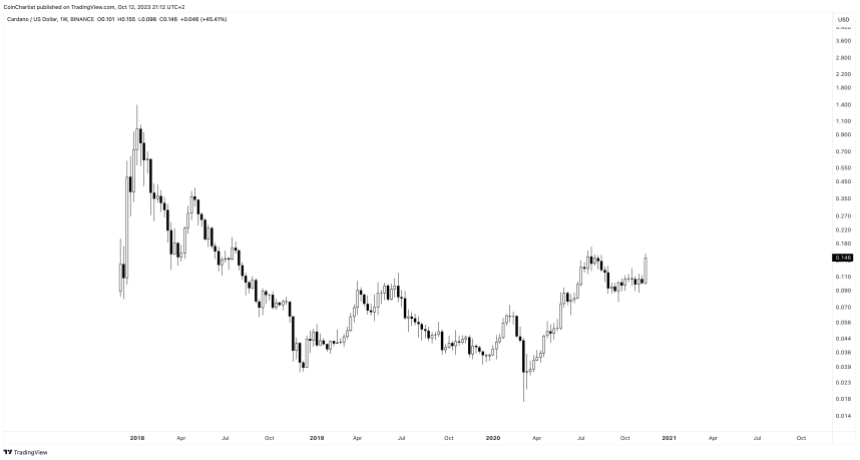
ADA faded from the spotlight during the 2018-2020 crypto bear market, with prices falling as low as $0.027 in March 2020. However, staking adoption grew steadily, reaching over 21 billion ADA staked by August 2020 and reducing supply pressure.

Despite price weakness, Cardano made major headway on technical improvements during this period away from the hype.

2021 – Explosive Growth Phase

ADAUSD_2023-10-12_15-12-55

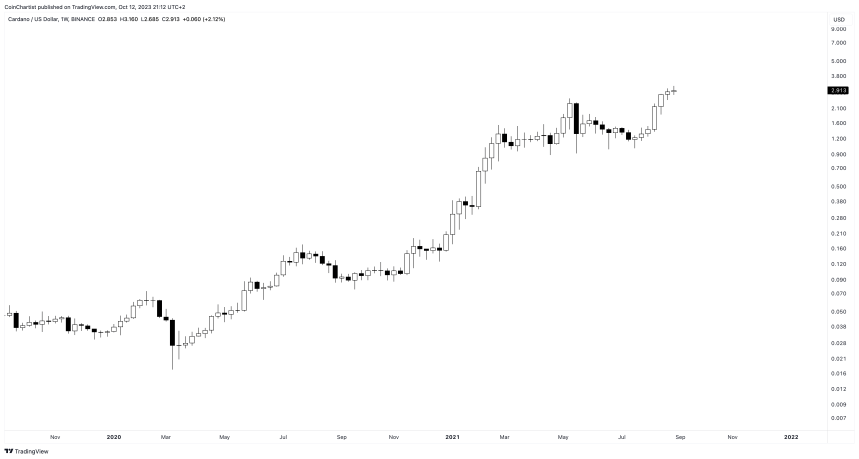
As crypto markets returned to health in 2021, ADA went on a monumental run starting from $0.18 at beginning of the year and reaching an all-time high of $3.10 in September 2021 – a surge of over 15x within 8 months!

Several developments triggered this growth phase:

  • Launch of native tokens and smart contracts functionality, allowing DeFi and dApp development.
  • Listing on prominent exchanges like Coinbase increased investment access.
  • Investor confidence grew in Cardano’s methodology after meeting roadmap targets.
  • Founder Charles Hoskinson’s media interviews drove interest among retail investors.

This proved a breakout year for ADA establishing itself as a leading altcoin. Cardano ended 2021 at around $1.50.

2022 – Crypto Winter Survival

ADAUSD_2023-10-12_15-13-30

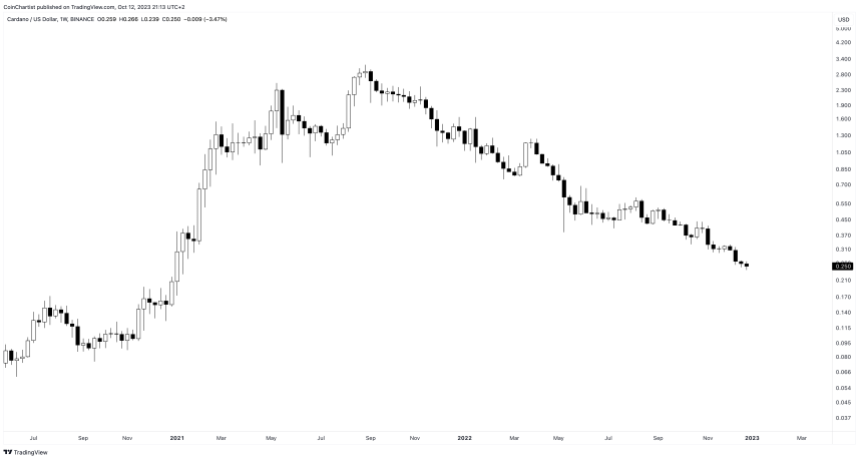
The 2022 crypto bear market was harsh on most altcoins including ADA, which fell to around $0.24 losing over 85% of its value from the peak.  However, Cardano maintained active development throughout 2022. Over 100 projects were building on Cardano by year end despite market conditions. This demonstrated strong ecosystem fundamentals.

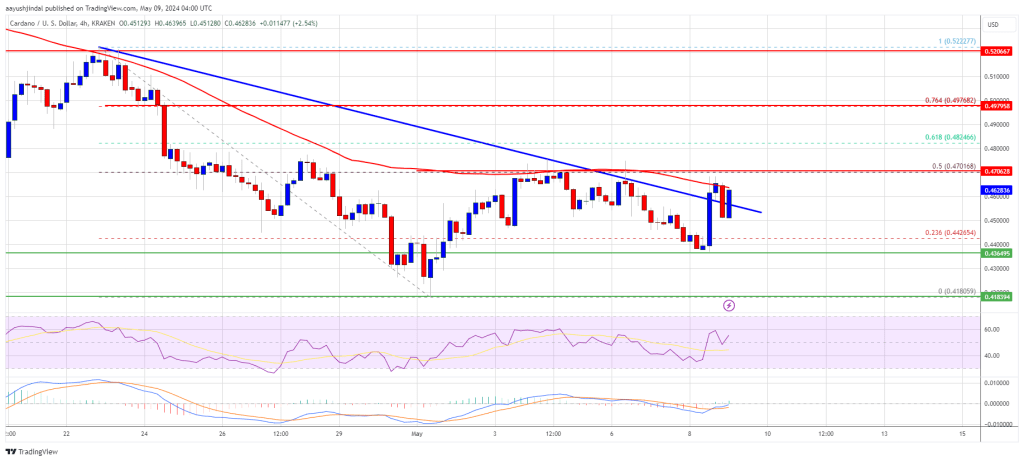
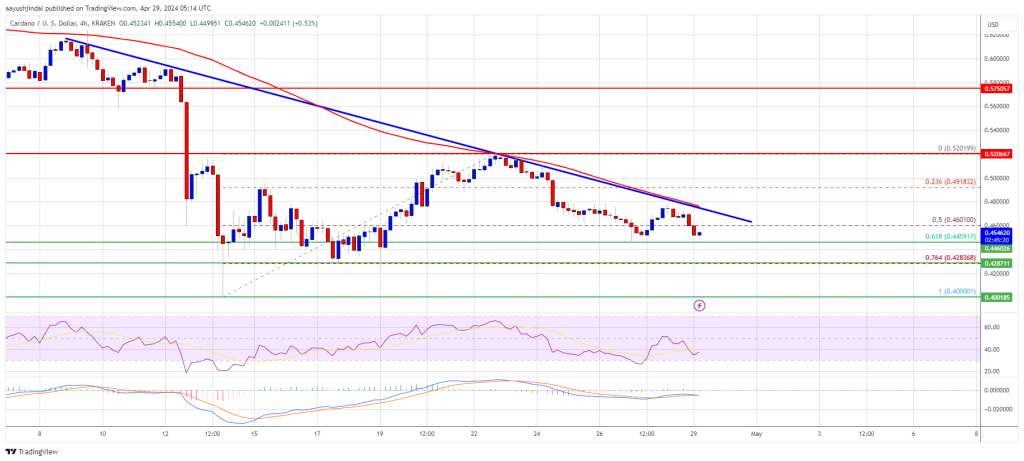
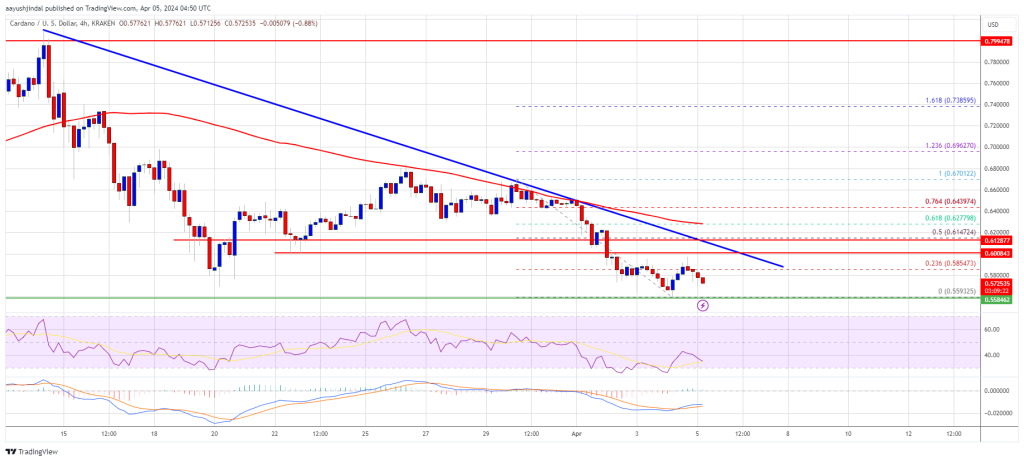
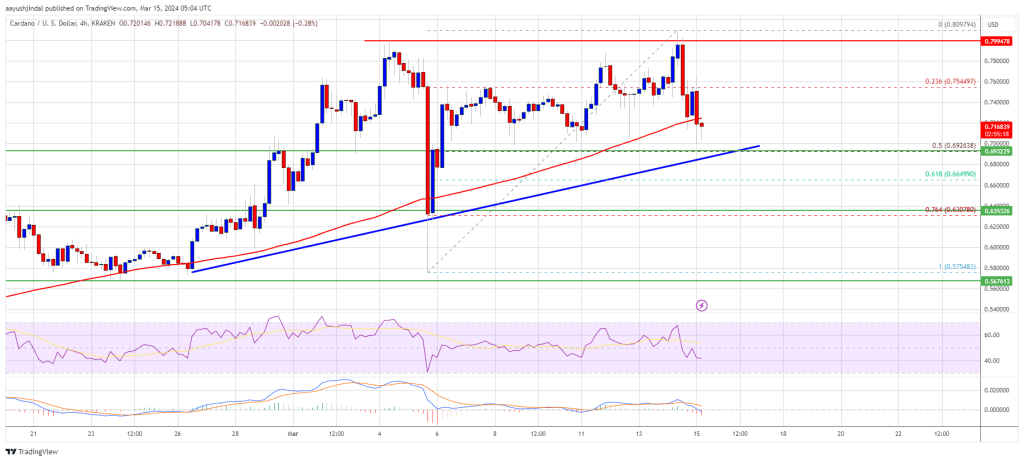
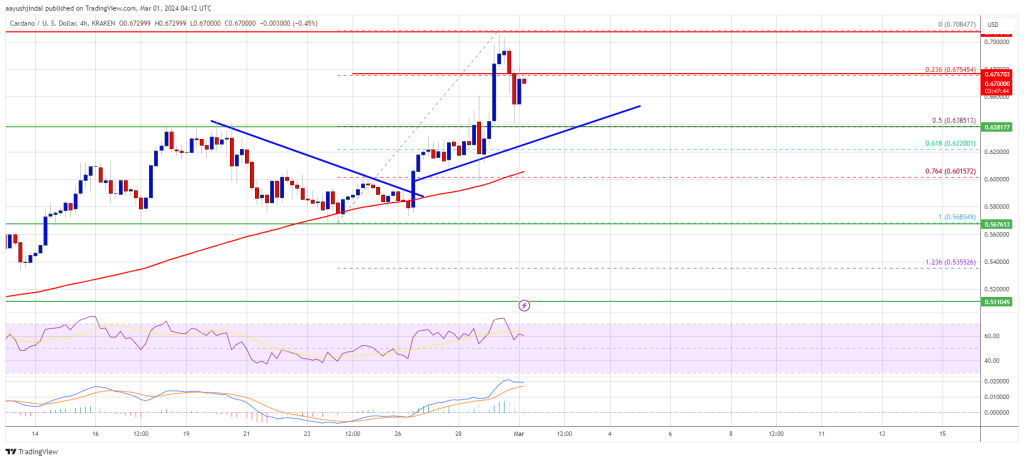
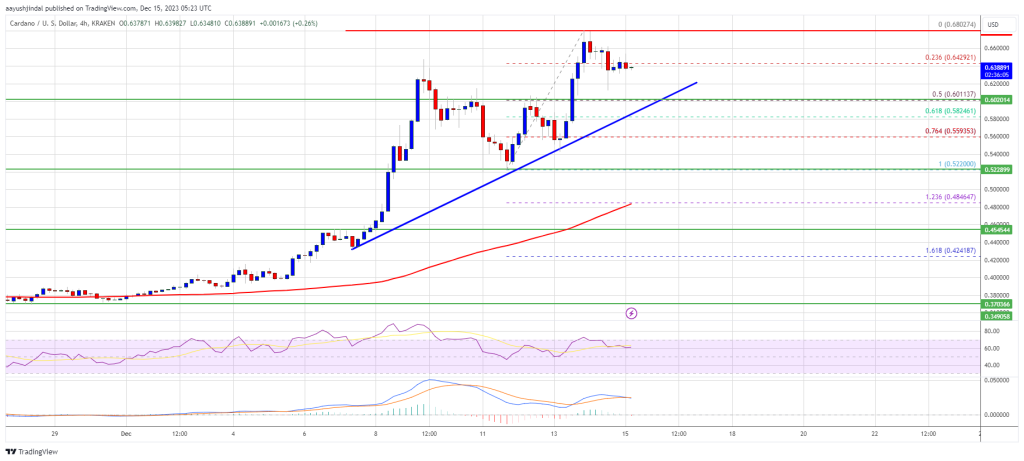
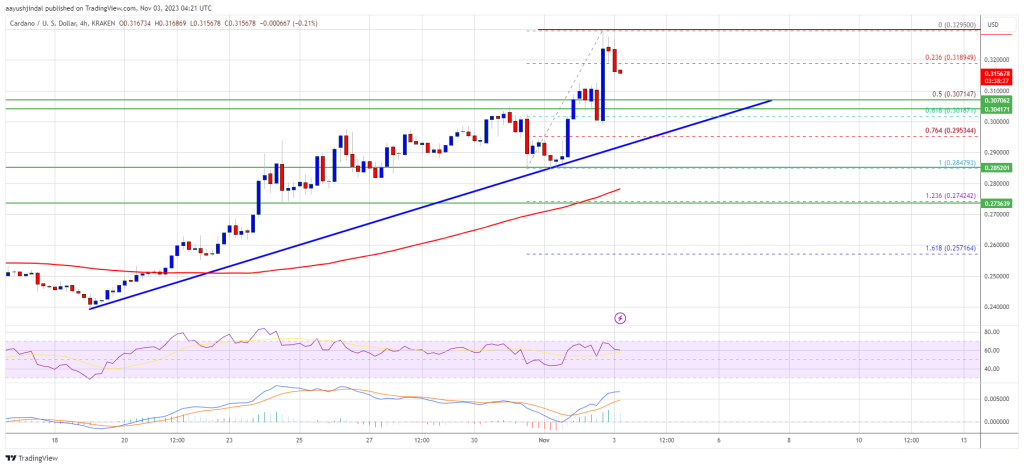
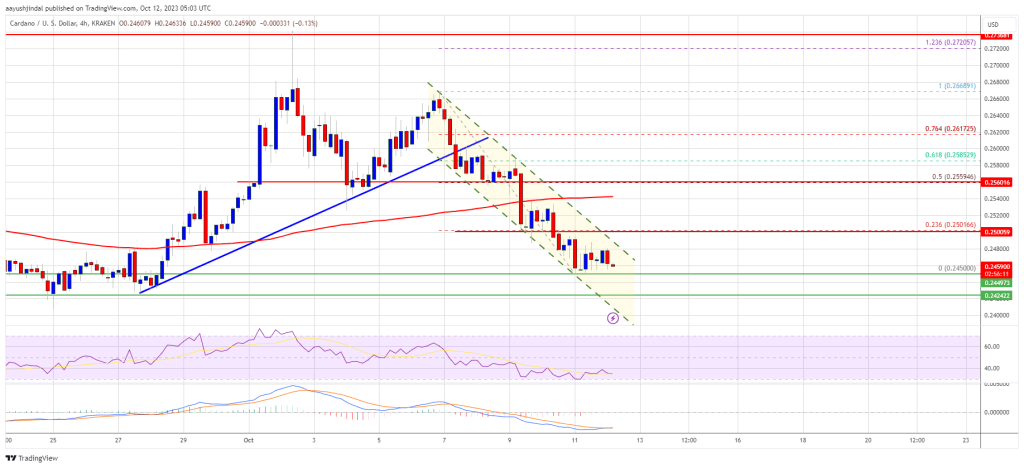
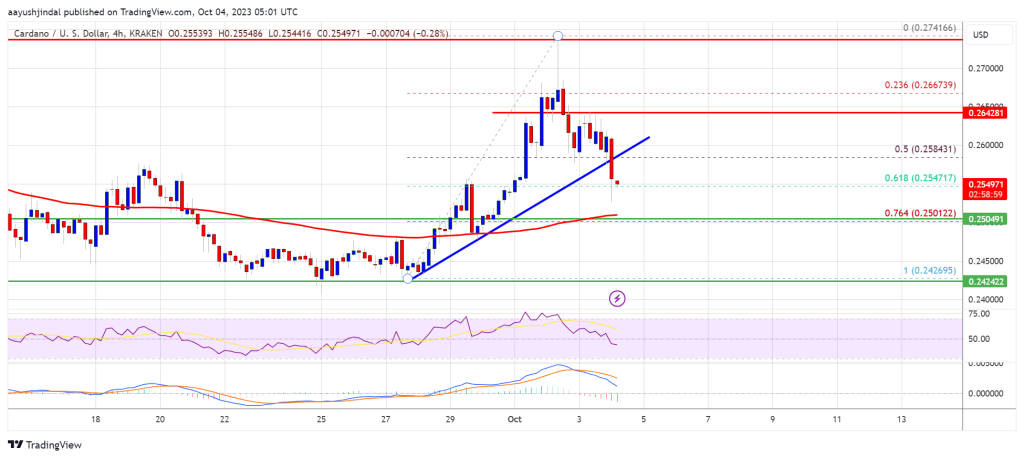
Recent Cardano Price Analysis  

In 2023, ADA hasn’t fared much better, making a lower low at around $0.22. It is currently trading at around $0.24 per token but is at risk of losing support of a descending triangle pattern.

ADAUSD_2023-10-12_15-15-31

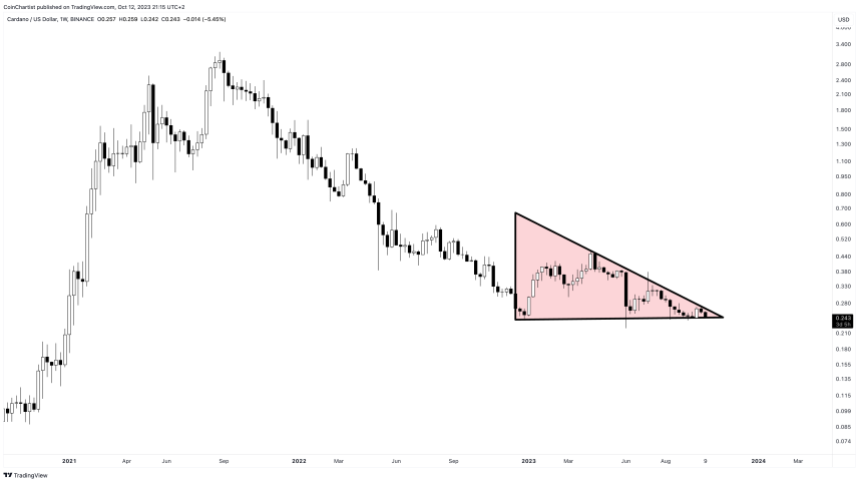
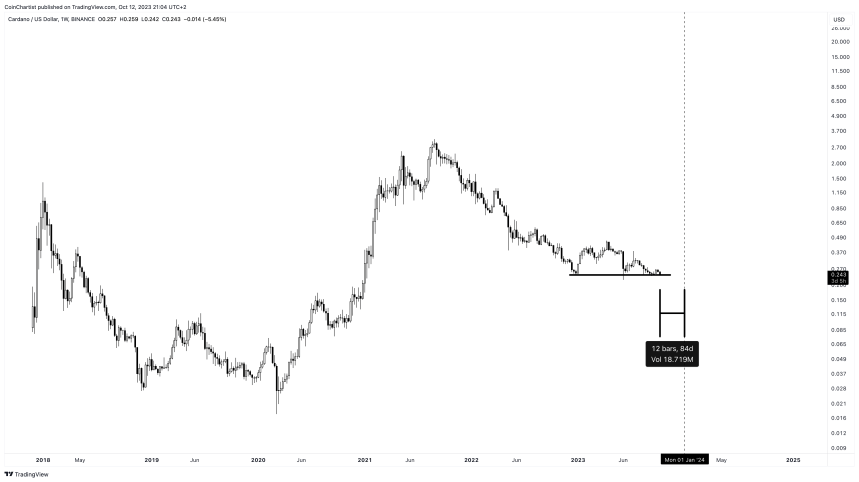
Short-Term Cardano Price Prediction For 2023

With less than 90 days left in 2023, Cardano has little hope for much higher prices, and investors should focus more on what happens if support is lost. Immediate short-term price predictions could even point to more downside, possibly falling as low $0.15 before the year is over.

Cardan Price Prediction

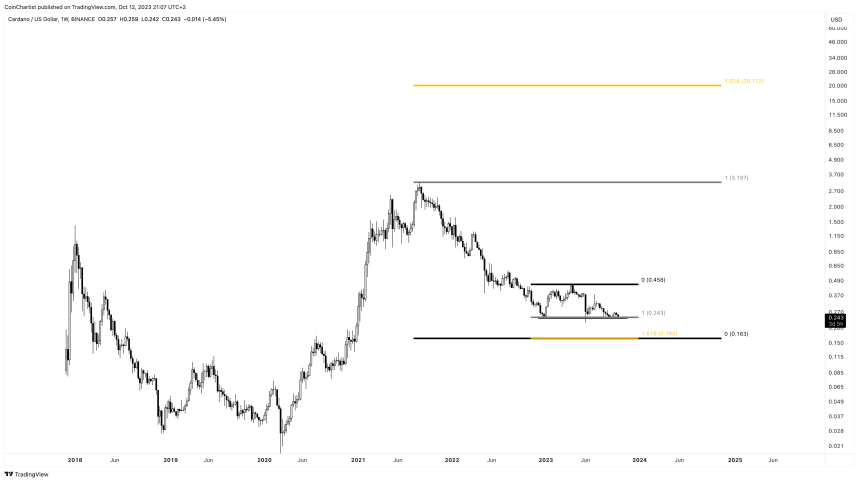
Medium-Term Cardano Price Forecast For 2024-2025

Once ADA finds a bottom, which could go as deep as $0.15 in the new year, the cryptocurrency market could finally be poised for a rebound. If these two years are positive for the cryptocurrency market, Cardano could find itself – shockingly – as much as $20 per ADA according to the Golden Ratio 1.618 Fibonacci.

Cardan Price Prediction

Long-Term Cardano Price Prediction For 2030 And Beyond

By 2030, Cardano intends to fulfill its goal of becoming the most developed blockchain platform. Assuming it achieves the vision, ADA has vast growth potential. If it maintains the long-term linear trajectory it is on, there are changes that Cardano can trade between $10 and $45 in the longer term.

Cardan (ADA) Price Prediction

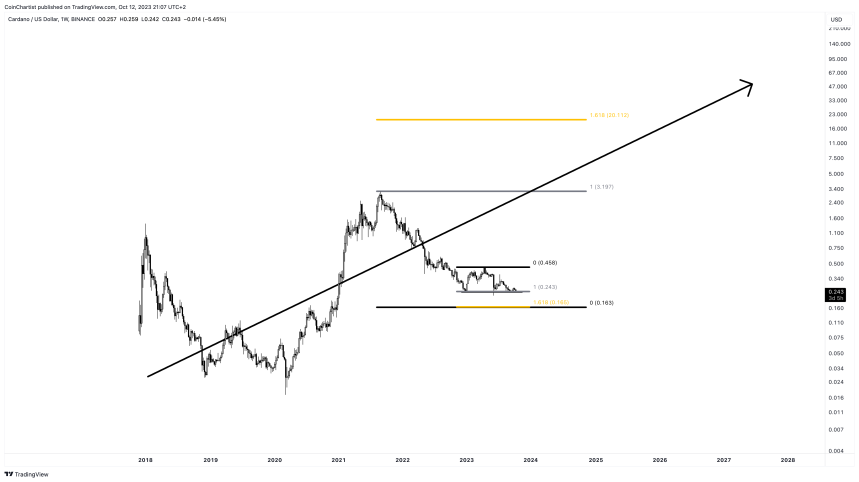
The next decade promises to be transformational for blockchain technology. If Cardano can cement itself as a leader, its long-term growth could be exponential. Patience and persistence are key.

Conclusion: Cardano Price Prediction

Cardano has established itself as a leading development-focused blockchain with the goal of becoming the backbone infrastructure for decentralized finance one day. While market conditions remain challenging currently, long-term growth prospects appear bright for Cardano by 2025 and beyond. Hitting development milestones will be crucial for justifying significant price appreciation in the future.

Cardano Price Prediction FAQs

Let’s look at some common questions investors have about ADA price analysis:

What was Cardano’s lowest price?

ADA sank to as low as $0.017 in the early stages after launch in 2017. During the 2022 and 2023 bear market, it dropped to around $0.22 which is the recent low.

What was the highest price for Cardano?

Cardano’s all-time high price was $3.10 reached in September 2021 at the peak of the crypto bull run.

Is $10 possible for Cardano?

ADA reaching $10 is achievable if crypto adoption returns to rapid growth by 2025 and Cardano executes its ambitious roadmap. But $10+ seems unlikely in the near-term given current depressed market conditions.

Can Cardano crash to zero?

A complete crash to zero looks highly unlikely barring an existential catastrophe given Cardano’s strong fundamentals. But an extended crypto winter could potentially push it below $0.10 until markets recover.

Why is ADA so volatile?

As with most cryptocurrencies, speculation and changing market sentiments contribute to ADA’s volatility. As a top-10 token, it also experiences high trading activity and price swings.

When will Cardano’s price stabilize?

ADA volatility should stabilize significantly if/when Cardano sees massive adoption as a blockchain solution used by enterprises, institutions and governments. But markets will likely remain turbulent for foreseeable future.

ADA Price Hints At Potential Correction, Buy The Dip?

Cardano’s price started a fresh decline below $0.250. ADA is testing important support at $0.2450 and might start a recovery wave.

  • ADA price started a fresh decline below the $0.255 and $0.250 levels against the US dollar.
  • The price is trading below $0.250 and the 100 simple moving average (4 hours).
  • There is a key declining channel forming with resistance near $0.2480 on the 4-hour chart of the ADA/USD pair (data source from Kraken).
  • The pair must stay above the $0.2420 support to start a fresh increase in the near term.

Cardano’s ADA Price Revisits Support

After a steady increase, Cardano failed to clear the $0.2650 resistance zone. The price formed a short-term top at $0.2668 and recently started a fresh decline, like Bitcoin and Ethereum.

There was a drop below the $0.255 support level. Besides, there was a break below a key bullish trend line with support near $0.259 on the 4-hour chart of the ADA/USD pair. The pair even declined below the $0.250 support and the 100 simple moving average (4 hours).

A low is formed near $0.2450 and the price is now consolidating losses. Cardano is now trading below $0.250 and the 100 simple moving average (4 hours). On the upside, immediate resistance is near the $0.248 zone.

There is also a key declining channel forming with resistance near $0.2480 on the 4-hour chart of the ADA/USD pair. The first resistance is near $0.250 or the 23.6% Fib retracement level of the downward move from the $0.2668 swing high to the $0.2450 low.

Cardano Price ADA

Source: ADAUSD on TradingView.com

The next key resistance might be $0.2560 and the 50% Fib retracement level of the downward move from the $0.2668 swing high to the $0.2450 low. If there is a close above the $0.256 resistance, the price could start a decent increase. In the stated case, the price could rise toward the $0.285 resistance zone.

More Losses in ADA?

If Cardano’s price fails to climb above the $0.250 resistance level, it could continue to move down. Immediate support on the downside is near the $0.245 level.

The next major support is near the $0.242 level. A downside break below the $0.242 level could open the doors for a sharp fresh decline toward $0.220. The next major support is near the $0.200 level.

Technical Indicators

4 hours MACD – The MACD for ADA/USD is losing momentum in the bearish zone.

4 hours RSI (Relative Strength Index) – The RSI for ADA/USD is now below the 50 level.

Major Support Levels – $0.245, $0.242, and $0.220.

Major Resistance Levels – $0.250, $0.255, and $0.285.

ADA Price Is Showing Early Signs of Fresh Drop, But 100 SMA Is The Key

Cardano’s price started a fresh decline below $0.264. ADA is struggling and might accelerate lower if there is a close below the $0.250 support.

  • ADA price is gaining bearish momentum below the $0.265 level against the US dollar.
  • The price is trading above $0.250 and the 100 simple moving average (4 hours).
  • There was a break below a key bullish trend line with support near $0.258 on the 4-hour chart of the ADA/USD pair (data source from Kraken).
  • The pair must stay above the $0.250 support to start a fresh increase in the near term.

Cardano Price Trims Gains

In the past few days, Cardano’s price climbed higher above the $0.255 level. The price was able to clear the $0.265 resistance, but the upsides were limited. The price traded as high as $0.2741 and recently corrected lower, like Bitcoin and Ethereum.

There was a drop below the $0.265 support level. Besides, there was a break below a key bullish trend line with support near $0.258 on the 4-hour chart of the ADA/USD pair.

Cardano is now testing the 61.8% Fib retracement level of the upward move from the $0.2426 swing low to the $0.2741 high. However, ADA is still above $0.250 and the 100 simple moving average (4 hours).

ADA Price Cardano

Source: ADAUSD on TradingView.com

On the upside, immediate resistance is near the $0.258 zone. The first major resistance is forming near the $0.265 zone. The next key resistance might be $0.274. If there is a close above the $0.274 resistance, the price could start a decent increase. In the stated case, the price could rise toward the $0.300 resistance zone.

More Losses in ADA?

If Cardano’s price fails to climb above the $0.265 resistance level, it could continue to move down. Immediate support on the downside is near the $0.250 level.

The next major support is near the $0.242 level. A downside break below the $0.242 level could open the doors for a sharp fresh decline toward $0.220. The next major support is near the $0.200 level.

Technical Indicators

4 hours MACD – The MACD for ADA/USD is gaining momentum in the bearish zone.

4 hours RSI (Relative Strength Index) – The RSI for ADA/USD is now below the 50 level.

Major Support Levels – $0.250, $0.242, and $0.220.

Major Resistance Levels – $0.265, $0.274, and $0.300.

PrimeXBT Lists Cardano Following Alonzo Hard Fork And Smart Contract Update

Over the last several weeks, the peer-reviewed blockchain Cardano and its native crypto asset ADA have been on an absolute tear, adding to a year-to-date rally of more than 1,000% ROI.

From Black Thursday 2020 lows of around two pennies, the now third-ranked cryptocurrency by market cap trades for $2 apiece, highlighting a monster 18,000% surge from the bottom.

Now, PrimeXBT traders can get a piece of the action with Cardano as part of seven new crypto assets that were listed as part of the latest update from the company.

PrimeXBT Lists Cardano, Solana, Polkadot, Chainlink, XRP, Uniswap, And Dogecoin

According to a blog post from the award-winning PrimeXBT via the company’s official blog, seven new altcoins and a variety of trading pairs have been added to the platform’s already staggering lineup of digital and traditional assets.

Few platforms offer forex, commodities, stock indices, and more next to cryptocurrencies, and never this many crypto assets on a single platform with so much else under just one roof. And now, there’s even more.

The update to the growing lineup includes Dogecoin, Solana, XRP, Uniswap, Polkadot, Chainlink, and, as we mentioned, Cardano. Each altcoin trades at up to 1:20 leverage using BTC, ETH, USDT, and USDC margin accounts or at up to 1:10 for Covesting strategy managers, who now can access more profits than ever before with the new listing of Cardano. 

“Ethereum Killers” And Why Cardano Is One To Watch

Cardano is worthy of a separate callout because it leads the charge of rapidly growing altcoin market share. Cardano was once ranked around tenth or lower in the top cryptocurrencies by market cap, while today, it is number three, right behind only Ethereum and Bitcoin.

Cardano is the most environmentally sustainable proof-of-stake blockchain, as well as the first peer-reviewed blockchain based on real-world evidence and evidence-based methods. It is said to be the blockchain for “changemakers, innovators, and visionaries” and is among the Ethereum killers gunning for the number two spot.

Although it competes directly with Ethereum, Plutus smart contracts have only just been deployed following the Alonzo hard fork. Looking ahead, the Cardano Summit 2021 runs September 25 and 26, which could lead to more positive fundamental news for the cryptocurrency project founded by Charles Hoskinson.

The debut of Cardano’s Plutus scripts will allow dapps to run and for DeFi to blossom on the platform. Developer Input Output reminded the Cardano community that there could be “bumps in the road.” However, the crypto community remains bullish on the altcoin, with price targets reaching as high as $10 per coin.

ADA Trading Pairs Now Live At PrimeXBT

At only $2 per ADA currently, going long on the ADAUSD or ADABTC trading pairs recently added by PrimeXBT to the price predictions above could be a trade of a lifetime. If markets turn bearish and those targets aren’t reached before the next downtrend, PrimeXBT lets traders short these trading pairs as well. 

Alongside record-smashing assets like Cardano, PrimeXBT has also listed Dogecoin, Polkadot, Chainlink, XRP, Uniswap, and Solana, joining Bitcoin and Ethereum Litecoin, forex currencies, stock indices, commodities, and much more available from a single account. Never has there been an opportunity for such portfolio diversification under one roof. 

The multi-asset margin trading platform also offers built-in charting tools, personalized service with dedicated account managers, the highest level of asset protection, advanced order types, Covesting copy trading module and several other advantages and features designed for novices and professionals alike. As part of constant innovation, the Covesting Yield Account system is due to be released next with the new asset listing now in the rear view. Within the next several weeks, the APY-generating tool will go live. Don’t miss it, the new assets, or whatever the award-winning platform comes up with next.