Analyst Predicts Shiba Inu to Soar 50% Amidst Meme Coin Market Rise

Well-known cryptocurrency expert and enthusiast Dami Defi has offered his insights on the price action of Shiba Inu, predicting a surge in the crypto asset as the Meme coin market sees a fresh wave of demand.

Given the optimism around meme coins lately, Dami Defi is confident that Shiba Inu could rise by over 50% shortly.

Shiba Inu Price Could Rise By 20%

Shiba Inu (SHIB) has become one of the leading meme coins, attracting positive outlooks from several analysts in the crypto space today. Even though Shiba Inu began the week on a negative note, Dami Defi believes the meme coin can potentially surge in the short term.

Related Reading: Crypto Analyst Predicts 350% Surge For Shiba Inu – Here’s The Target

According to Dami Defi, the digital asset’s price has formed a descending wedge pattern in the 1-day timeframe. Should SHIB break out of this falling wedge pattern, Dami Defi anticipates an over 50% surge in Shiba Inu’s price. This 50% increase will take the crypto asset from its present price to the $0.000035 level.

Shiba Inu

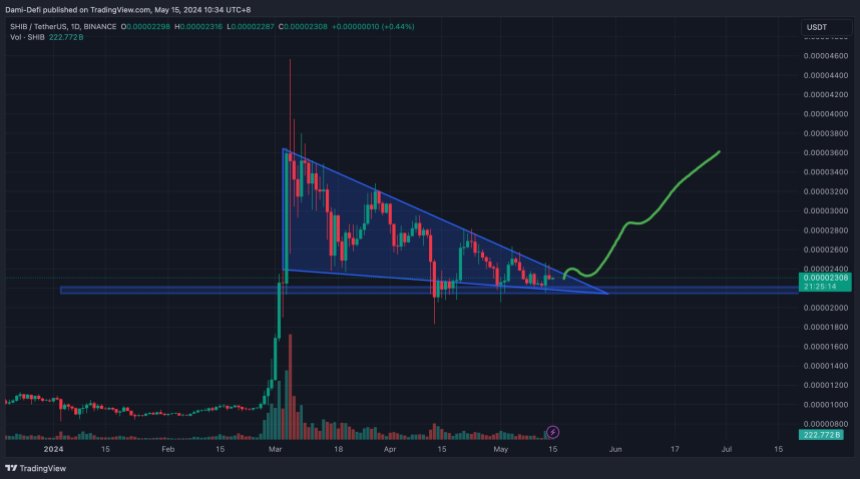
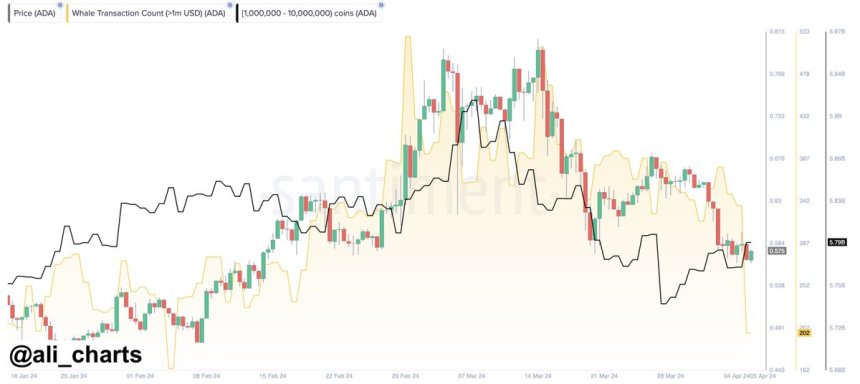
The analyst predictions align with Ali Martinez’s forecast, highlighting that the digital asset’s price is moving in a descending parallel channel. 

While Dami Defi anticipates an over 50% price surge for Shiba Inu, Martinez expects the crypto asset to rise by over 20% in the short term. Martinez’s anticipated 20% increase will take the crypto asset from the $0.00002444 price to the $0.00002954 level.

Martinez appears bullish on Shiba Inu, as he had predicted the asset to reach $0.000072323. He highlighted that SHIB on the daily chart seems to be forming a bull flag, indicating an impending movement on the upside. Due to this, the expert opened trade at around $0.000018343 in hopes of a strong breakout that will take Shiba Inu to $0.000072323.

Martinez’s prognosis, fueled by March’s rally, indicates that SHIB’s value may rise even further, providing investors in this thriving and active sector of the cryptocurrency market with a positive outlook for the meme coin.

SHIB Predicted To Repeat 2021 Price Trend Or Even Better

Shiba Inu’s marketing head, Lucie, delved into the memecoin’s price action. Lucie claims that during October 2021, SHIB, with no burns and no significant adoption at the time, witnessed a surge from $0.000007 to $0.000088 in just a matter of days, indicating an over 1,100% rise.

With the massive burns and widespread seen today within the SHIB ecosystem, Lucie might be suggesting the potential for the asset to reiterate this move or even further in this bull cycle. If this trend repeats, SHIB’s price might reach $0.00025 in this bull cycle.

Lucie also underscored the consistent support by SHIB’s robust community and strong Shibarium ecosystem since 2021, which might also catalyze Shiba Inu’s growth.

At the time of writing, SHIB was trading at $0.00002366, demonstrating an increase of over 4% in the past week. Despite the price rise, its market cap has been down by 2.59%, while its trading volume has been up by 1.79% in the past day. Given the momentum in the meme coin market, SHIB may be able to see more gains in the coming months.

Shiba Inu

Analyst Pinpoints $61,500 As Critical Bitcoin Price Level To Monitor

Amidst the recent decline in Bitcoin’s price and the general cryptocurrency market, popular cryptocurrency analyst and enthusiast Titan of Crypto has highlighted the $61,500 price level as a crucial threshold to watch for the largest cryptocurrency.

Titan of Crypto analysis examines the aforementioned level as a pivotal point for Bitcoin that could determine the coin’s next price trajectory.

$61,500, A Level To Watch For Bitcoin

Today, May 14, BTC witnessed a sharp decline to nearly $61,500, demonstrating little momentum for a price recovery. While many would see this as a worrying development, Titan of Crypto considers it a noteworthy development. He sees this level as significant and is one to watch out for for Bitcoin.

Bitcoin

The crypto expert further warns of an impending volatility in the market around Federal Reserve Chair Jerome Powell‘s speech later today. Thus, Titan of Crypto has urged the community to remember that it’s better to hold off on making decisions until after the BTC daily candle closes and until the next one confirms the previous one.

The post read:

Bitcoin $61,500 is the level to watch. Expect volatility in the markets around today’s Powell speech. In any case, remember it’s wiser to wait for the BTC daily candle close and confirmation with the following one before jumping to a conclusion.

Although the expert anticipates volatility for Bitcoin, he is confident that the crypto asset’s bull run is far from over, suggesting a movement on the upside is still possible. 

According to Titan of Crypto, Bitcoin’s Risk-Adjusted Return Oscillator (RAR) indicator has recently moved into the overbought area. However, the analyst asserts that this does not call for alarm, given that Bitcoin took over eight months to peak following the development based on previous bull cycles.

Looking at Bitcoin’s price action from the daily timeframe, the expert confirms that the digital asset is “looking good.” As a result, BTC is following the bullish target to unprecedented heights, specifically around $112,185. “This game is a zero-sum game where impatient people give their money to the patient,” he added.

Possible Retracement To $62,000

While Titan of Crypto anticipates a rally, Ali Martinez, another crypto, has predicted an early price retracement. The expert has highlighted the possibility for BTC to decline to $62,000 in the short term.

According to the analyst, the 4-hour chart’s 200 Exponential Moving Average (EMA) appears to be rejecting Bitcoin, whereas the TD Sequential indicator suggests a sell signal. Should the development be confirmed, Martinez expects BTC to drop to $62,000. 

However, for BTC to witness an upward movement, it needs to maintain a 4-hour candlestick close above the $64,000 threshold. Thus, with the coin trading below the $62,000 level, Martinez’s prediction appears to have already manifested.

At the time of writing, the coin was trading at $61,512, indicating about 1.98% in the past day. Its trading volume was up by 9.67%, while its market cap was down by 2.65% in the last 24 hours.

Bitcoin

Blast From The Past? Analyst Identifies Pivotal Summer For VeChain With This Bullish Fractal

Over the past few weeks, the price of VeChain (VET) has struggled to live up to the promise and vigor it showed at the start of the year. This has been the story with a significant portion of the cryptocurrency market, with several large-cap altcoins down by double-digits in the past month.

However, the VeChain token has been a hot subject of discussion in the circle of cryptocurrency analysts and pundits. Popular crypto analyst Ali Martinez is amongst the latest to put forward future projections for the token.

Can VeChain Price Reach $0.6 By December 2024?

The crypto pundit took to the X platform to share an interesting update on the monthly chart of the VET price. According to Martinez, the cryptocurrency is gearing up for a price rebound this summer, which might be crucial to its performance in the rest of the year.

This projection is based on the return of a previously identified consolidation range in the VeChain price, with the analyst suggesting that the token could follow this historical fractal. Martinez pointed out that the fractal appeared in 2020 when VET’s price reached its all-time high of $0.281.

Most recently, VET broke out of a consolidation range following its significant price surge to $0.04664 in February. The altcoin has been experiencing a price correction since then, although what looks like a “resistance retest” seems to be complete. 

According to Martinez, the price of VeChain is set for a “rebound” this summer after retesting the channel’s upper boundary at around $0.32. Following the price recovery, the analyst said the cryptocurrency is likely to experience a “potential explosive growth” in the fall.

VeChain

As highlighted in the chart above, VET’s price could travel as high as $0.6 by December 2024. If this fractal does play out as the analyst anticipates, the price target would be a new all-time high and a massive 1,600% surge from the current price point.

VET Price Overview

As of this writing, the VeChain token is valued at  $0.03469, reflecting a 2.6% price dip in the last 24 hours. VET’s struggles in the past day underscore the altcoin’s sluggish performance on even broader timeframes.

According to data from CoinGecko, the cryptocurrency is down by 7% and 23% on the weekly timeframe and monthly timeframe, respectively. Nonetheless, VeChain has managed to retain its position amongst the top 50 largest cryptocurrencies, with a market capitalization of more than $2.5 billion.

VeChain

Bitcoin Whale Activity Declining – Why A Turnaround Is Important

According to the latest on-chain revelation, the Bitcoin network has been experiencing a steady decline in high-value transactions over the last few weeks. This sluggish activity has been mirrored by the price of the premier cryptocurrency, which has struggled to break out of consolidation throughout the month of April.

In the past week, the Bitcoin price struggled to hold above $67,000 despite touching the level multiple times. The price of BTC has since been in a tumble and is down by more than 2% in the last seven days, according to data from CoinGecko.

Interestingly, the recent on-chain data suggests that this underwhelming price performance might persist for the market leader unless there is a turnaround, especially in terms of network activity.

Can Whale Activity Push BTC Price Beyond $73,000?

Prominent crypto analyst Ali Martinez took to the X platform to reveal that the Bitcoin whale activity has been declining steadily in the past six weeks. This revelation is based on Santiment’s Whale Transaction Count metric, which tracks the number of BTC transactions worth more than $100,000 and $1 million.

Whales refer to entities or individuals that own substantial amounts of a particular cryptocurrency (Bitcoin, in this case). As such, they hold significant influence over market dynamics due to their capacity to execute large transactions, which can trigger speculation and potential price shifts.

Martinez highlighted in his post that there has been a noticeable decline in Bitcoin whale activity since March 14, the same day the premier cryptocurrency hit a new all-time high price of $73,737. This dip in activity has coincided with the recent underperformance of Bitcoin’s price.

However, the crypto analyst mentioned that an increase in high-value transactions could breathe life into the price of BTC. This is based on the reasoning that a surge in network activity could imply high demand for Bitcoin, leading to elevated prices. 

As shown in the chart below, the peak of the whale transaction count correlates with the new record-high price of BTC.

Bitcoin

Active Bitcoin Wallets On The Rise: Santiment

An interesting piece of on-chain data that may suggest increasing demand for Bitcoin and a bullish future for its price has come to light.  According to Santiment, the number of active Bitcoin wallets is increasing rapidly despite the choppy state of the market.

Active Bitcoin wallets refer to the total number of unique addresses holding BTC. Santiment data shows that the number of these “non-empty BTC wallets” has climbed by more than 2.5% in the last three months.

As of this writing, Bitcoin trades just above $64,000, reflecting a 1.6% price increase in the past day.

Bitcoin

Crypto Analyst Sounds Buy Alarm For Dogecoin – Can DOGE Price Reclaim $0.2?

The DOGE price has largely struggled to make a return to $0.2 since losing this price level early in April. And the meme coin has mostly been on a descent over the past few weeks, going as low as $1.4 at some point.

However, the tides appear to be shifting for the Dogecoin investors, with the meme token putting in a positive price performance in the past week. The double-digit gain and optimistic price action over the last seven days haven’t gone unnoticed by experts, as many anticipate a continued bullish run for the DOGE price in the near future.

Is A Price Rally Imminent For Dogecoin?

Prominent crypto analyst Ali Martinez took to the X platform to share an interesting analysis and projection for the Dogecoin price. According to the pundit, DOGE’s recent price action is signaling a potential rally to the upside over the coming days.

The reasoning behind this bullish prediction revolves around the TD (Tom Demark) Sequential indicator. Martinez mentioned that this indicator has flashed a buy signal on Dogecoin’s daily chart, suggesting that a price upswing lasting between one to four days might be on the cards.

The Tom Demark Sequential is an indicator in technical analysis used to identify potential points of trend exhaustion and price reversal. Typically, the TD Sequential indicator comprises two major phases known as the “setup” and the “countdown.” 

The setup phase consists of nine consecutive candlesticks depending on whether the token is in a bullish or bearish trend. The countdown phase, on the other hand, consists of 13 consecutive candlesticks, which start immediately after the completion of the “setup.” 

DOGE price

In the chart highlighted above, the DOGE price just completed the nine-candle setup phase, which may be signaling a potential price reversal. Given that this phase was mostly formed by bearish candles, the TD Sequential might be indicating a bottom for Dogecoin’s price.

Ultimately, it is likely that investors will see the DOGE price return to $0.2 if the potential rally produces four consecutive bullish candles. However, they might keep an eye out for the formation of the “countdown” phase.

The completion of the countdown phase on Dogecoin’s daily chart could signal an even stronger and longer-lasting price reversal. This could see the meme token break out of its current bearish trend and gather some momentum for higher price levels.

DOGE Price At A Glance

As of this writing, the DOGE price stands at around $0.1618, reflecting a significant 4.7% increase in the past 24 hours.

DOGE price

Uniswap Resurgence Incoming? Analyst Predicts 30% Surge For UNI Price

Uniswap’s native token, UNI, has been struggling in terms of its price action over the past few weeks. Although the general state of the crypto market may be blamed for this gloomy price performance, other factors, such as the Wells Notice from the US Securities and Exchange Commission (SEC) to the Uniswap protocol, have also played a role.

However, the UNI price appears to be recovering well, as the token has jumped by more than 2% in the past day. A popular crypto pundit on X has predicted that a bullish rally might only just be beginning for the DeFi coin, but the question is – how far can Uniswap’s price go?

Analyst Sets $10 Target For Uniswap Price

In a recent post on the X platform, prominent crypto analyst Ali Martinez put forward an exciting bullish prediction for the price of UNI. According to the expert, the cryptocurrency might be getting ready for a run to the upside in the coming days.

The rationale behind this bullish prognosis for the Uniswap token is based on the TD (Tom DeMark) Sequential Indicator. The Tom Demark Sequential is an indicator in technical analysis used to identify the probable time and points of trend exhaustion and price reversal.

Uniswap

The TD Sequential indicator consists of two stages, namely the “setup” and the “countdown” phases. As shown in the chart above, UNI’s price just completed the setup phase, which comprises nine consecutive candles that closed lower than the candle four periods ago.

The completion of this phase usually signals a potential trend reversal for the token’s price. The direction of the reversal depends on the type of candles that formed the “setup” (I.e., red candles would suggest a bottom for the asset, while green candles would imply a top).

Martinez noted in his post that the TD Sequential has flashed a buy alarm on the UNI daily chart, and the token might be “gearing up for a 1 – 4-day rally. According to the analyst, the DeFi coin could jump as high as $10, representing an over 31% surge from the current price point.

UNI Price Overview

As of this writing, the price of UNI stands at around $7.46, reflecting a 2% jump in the past 24 hours. However, this latest price increase is not enough to bring the coin to profit on the weekly timeframe.

According to CoinGecko’s data, Uniswap’s price is down by more than 4% in the past seven days. The cryptocurrency would look to regain the $10 level, having lost it due to the news of the SEC’s looming action. 

Uniswap

Analyst Predicts Cardano (ADA) To Rally By 75% As MVRV Ratio Plummets

In recent weeks, ADA, the native token of the Cardano network. has drawn much speculation due to a rather turbulent price performance resulting in a decline of 18.77% in the past month. This negative price movement is similar to the majority of the cryptocurrency market following unprecedented massive dips in the price of Bitcoin. 

However, despite ADA’s troubles, popular crypto analyst Ali Martinez is backing the coin to pull off a remarkable rebound. Interestingly, Martinez’s prediction comes as the digital asset attempts to find its feet, gaining by 9.92% in the last day, according to data from CoinMarketCap.

ADA Tipped To Hit $0.80, Record Yearly High

In a post on X on April 19, Ali Martinez shared that ADA may soon record an impressive price surge. Martinez predicted the tenth largest cryptocurrency could soon record a 75% gain due to its MVRV Ratio being lower than -22%.

For context, the Market Value to Realized Value (MVRV) ratio is a metric used in crypto technical analysis to assess the valuation of a digital asset relative to its realized value. It is basically used to know if a token is overvalued or undervalued based on its market price compared to the average cost basis of its holders.


An MVRV ratio of -22% indicates that the market value of ADA  is significantly less than its realized value. However, Ali Martinez notes the last time the coin was this undervalued was in June 2023, after which it rose by 75% in the next month. 

Based on such historical price data, the crypto analyst predicts ADA could replicate a similar performance over the next few weeks, attaining a market price of $0.80, which would represent its highest value in the last year. At the time of writing, ADA trades at $0.46, with a 2.43% gain in the last hour. In a similar fashion, the token’s daily volume is up by 43.07% and $595.30 million.

Cardano Launches New Era Of Decentralized Governance 

In other news, the Cardano network is set to commence a new era in decentralized governance, according to an announcement by the CEO of the Cardano Foundation, Frederick Gregaard. In an X post on April 18, Gregaard stated the full constitution for this change in government “is on the horizon,” with an interim constitution now going into effect.

According to the Cardano Foundation boss, the interim constitution emphasizes core network values such as transparency, openness, and responsible decision-making. It aims to grant each ADA holder an influence in determining the future of the Cardano ecosystem via an inclusive government in which all stakeholders are privileged to certain rights and responsibilities as listed in the constitution. 

Bitcoin Could Hit $86,000 If This Key Level Is Surpassed: Analyst

In a compelling forecast for Bitcoin, Ali Martinez, a well-known cryptocurrency expert and trader, has pointed out a possible development that could propel the crypto asset’s price to the $86,000 threshold in the foreseeable future.

Bitcoin Movement Determined By Key Levels

The analyst’s positive perspective highlights the possibility of a large upward shift in the price trend of Bitcoin, igniting interest and speculation in the cryptocurrency space.  Ali Martinez’s analysis primarily focuses on several key support and resistance levels, of which a break out from these levels will determine the future trajectory of Bitcoin. 

According to the expert, it appears the digital asset has been gathering momentum in a parallel channel. As a result, the $61,000 mark becomes the most significant support level, while the $72,400 mark becomes the most crucial resistance level.

Martinez affirms that Bitcoin might plummet toward the $56,200 and $51,600 range if it manages to surpass the aforementioned support level. However, should it break out from the $72,400 resistance zone, $79,000 and $86,000 are the next price targets to expect.

Bitcoin

Considering the UTXO Realized Price Distribution (URPD) chart, Martinez notes that $62,000 also proves to be an important support area for Bitcoin. If this level is lost, attention might move to the following significant demand region, which is situated around $51,500.

On the other hand, the likelihood of the bull run rekindling would be largely increased should there be a rise back above $66,250. This suggests a new wave of confidence and enthusiasm from market investors and players.

Martinez has also identified a notable shift in the accumulation trend score for Bitcoin lately. Specifically, the recent development marks the first time it has happened in six months, and it is now pegged at 0.27. This change suggests that BTC whales might be selling off their holdings rather than hoarding the crypto asset even more.

Interest From ETF Investors To Impact Price Substantially

Despite the negative performance of BTC lately, several analysts still believe the coin is headed for unprecedented heights. Crypto expert Willy Woo recently made a bold forecast, putting his price target at $650,000 at the bull market top and $91,000 at the bear market bottom.

Willy Woo expects the coin to top out at this level when ETF investors have completely deployed their capital based on asset manager recommendations. Furthermore, Woo stated that while these figures are quite cautious, Bitcoin will surpass the gold cap after ETFs have served their purpose. “Gold went on a 12-year bull run when its ETF was approved, now it is Bitcoin’s turn,” he added.

In the last day, the price of Bitcoin has fluctuated between a low of $62,000 and a high of $66,000, ultimately concluding around $63,000. Its daily trading volume has decreased by 20%, indicating a declining intreest from traders.

Bitcoin

111,000 BTC Move Out Of Exchange Wallets In A Month – Impact On Bitcoin Price?

The Bitcoin price has somewhat slowed down since reaching the unprecedented high of $73,000, moving mostly sideways since mid-March. However, with the halving event less than a fortnight away, all eyes will be on the premier cryptocurrency and all that pertains to it over the next couple of weeks.

According to a recent on-chain observation, the BTC supply on exchanges has been on a steady decline over the past few months. This trend has sparked discussions on what this could mean for the Bitcoin price, both in the short and long term.

$7.55 Billion Transferred Out Of Exchange Wallets In The Past Month

Prominent crypto pundit Ali Martinez took to the X platform to share that a significant amount of Bitcoin has been moved out of crypto exchanges over the past month. The relevant metric here is Glassnode’s Balance on Exchanges, which tracks the total amount of a cryptocurrency (Bitcoin, in this case) held across all exchange addresses.

A decrease in the value of this indicator implies that investors are making more withdrawals than deposits of Bitcoin into centralized exchanges. The metric’s increase, on the other hand, indicates that more BTC is flowing into these exchanges than leaving.

Bitcoin price

According to Martinez, about 111,000 BTC (worth approximately $7.55 billion) have been transferred out of known crypto exchange wallets in the past month. Typically, an exodus of funds (of this magnitude) suggests a significant shift in the sentiment of Bitcoin investors.

While the exact rationale behind such a massive movement of Bitcoin remains unclear, the flow of funds from trading platforms suggests a growth in investor confidence. This implies that BTC owners are more interested in holding their assets in the long term rather than selling for short-term gains.

Furthermore, this continuous downward trend in BTC’s balance on exchanges could set the stage for a bullish rally for the Bitcoin price. A sustained drop in the BTC’s supply on centralized exchanges could result in a supply crunch – a scenario where the supply of a particular asset is lower than its demand, leading to a surge in its value. 

Another potential bullish catalyst for the Bitcoin price is the upcoming halving event, which is expected to occur on April 18, 2024. With the miners’ rewards slashed in half and the production of Bitcoin slowed, this event is expected to impact the value of BTC positively.

Bitcoin Price At A Glance

As of this writing, the Bitcoin price stands at around $69,537, reflecting a 2.7% increase in the last 24 hours.

Bitcoin price

Cardano Price In Turmoil: Can Whales Drive ADA’s Resurrection From Recent Dump?

The Cardano price has been facing a significant amount of bearish pressure over the past week, declining by more than 12%. This recent fall coincides with a broader crypto market downturn, with other major altcoins suffering huge losses over the past week.

Specifically, Cardano’s price decline has been largely linked to the recent sell-off of all ADA holdings by the Grayscale Digital Large Cap Fund (GDLC). On Thursday, April 4, the fund disclosed its decision to rebalance its portfolio by liquidating its Cardano assets (about 1.6% of the entire holdings).

Registering such a negative start to April after an underwhelming performance in March doesn’t do well to dispel the increasing concerns of investors. Moreover, the latest on-chain data suggests that the Cardano price might continue to succumb to the bearish pressure.

Analyst Predicts ADA Price Slump As Whale Activity Slows Down

Popular crypto pundit Ali Martinez has shared a post on X that Cardano whales have been making fewer moves in the market in recent days. This revelation is based on Santiment’s Whale Transaction Count metric, which tracks the number of ADA transactions worth more than $1 million.

Whales refer to entities or individuals that own significant amounts of a particular cryptocurrency (Cardano, in this case). They are often viewed as key players in the market, as their buying or selling activities can have a significant impact on the Cardano price, leading to speculation and potential market shifts.

According to Martinez, the on-chain data shows that there has been a noticeable dip in the activity of Cardano whales, suggesting a possible decline in significant ADA transactions. In an almost vertical move, the whale transaction count dropped from around 400 daily transactions at the beginning of last week to 200 daily transactions by Friday, April 5.

Cardano Price

The crypto analyst mentioned that the recent downturn in whale activity could be a signal for “further price consolidation” or an imminent decline in the Cardano price. A loss of substantial buying activity from large investors can cause the cryptocurrency to succumb to bearish pressure, especially from small traders looking to take some profit.

Indeed, the Cardano token has made a positive start to the year, reaching a high of $0.8 in early March. However, the altcoin has been on a downward trend since hitting the 2024 peak – collapsing under the pressure of Bitcoin’s price decline.

Cardano Price At A Glance

As of this writing, the Cardano price stands at around $0.577, reflecting a 1% decline in the past 24 hours.

Cardano Price

Featured image from iStock, chart from TradingView

Can This Bullish Chart Pattern Propel Bitcoin Price To $75,000?

The Bitcoin price has experienced a notable resurgence over the past week, drawing parallels to the optimism often associated with Holy Week among Christians. This renewed momentum has infused the entire market, leading to significant profits for other major cryptocurrencies in the last seven days.

The resurgence of the Bitcoin price seems to be at its nascent phase, with a popular crypto pundit on the X forecasting a bullish trajectory for the premier cryptocurrency over the coming days.

Bitcoin Price To Reach $75,000?

In a recent post on the X platform, Ali Martinez put forward an optimistic prediction for the price of Bitcoin. According to the crypto analyst, the premier cryptocurrency’s current price action indicates that BTC might be ready for another run to the upside.

This bullish prediction is based on the formation of an inverse head-and-shoulders chart pattern in the 30-minute timeframe. Considering the short timeframe, this projection, if it comes true, will likely play out over the next few days.

Typically, a head-and-shoulders price pattern signals a bullish-to-bearish trend reversal and indicates that an upward trend might be coming to an end. In contrast, the inverse head-and-shoulders chart formation suggests the possible reversal of a downward trend, with potential bullish movement on the horizon.

Bitcoin Price

According to the highlighted chart above, the Bitcoin price is currently following a trend above the 200 exponential moving average (EMA). If the coin maintains its position above this moving average and manages to cross the neckline resistance at $71,580, Martinez expects the price of BTC to move further upward toward $74,760.

This almost $75,000  target would be a new all-time high for the Bitcoin price and an almost 5% move from the current price point. The current record-high price for BTC stands at around $73,700, which was set a little over two weeks ago.

BTC Price Overview

As of this writing, Bitcoin is valued at $69,875, reflecting a 0.7% price decline in the past day. While the premier cryptocurrency is back below the $70,000 level, this slight dip is not substantial enough to erase its profit over the past week.

According to data from CoinGecko, the Bitcoin price is up by nearly 10% in the last seven days. After climbing as high as $71,500 earlier in the week, BTC now trails its all-time high price by about 5%.

Nevertheless, Bitcoin still maintains its position as the largest cryptocurrency in the sector, with a market capitalization of over $1.37 trillion.

Bitcoin price

Bitcoin Pullback Has Ended? Analyst Declares “Worst Is Over”

After a stunning retrace, Bitcoin witnessed a notable recovery as Wednesday closes rising from the $61,000 price mark to $67,000, triggering hopes within the cryptocurrency community that a bullish movement might be imminent. However, the crypto asset has not exactly returned to the point it was a week ago, especially since BTC reached a new all-time high last week when it surged beyond $73,000.

Bitcoin Correction Has Bottomed Out

With Bitcoin surpassing its previous all-time high and rising even further to set a new peak of $73,000, March has been a momentous month for the cryptocurrency. And following the recent recovery, several cryptocurrency experts and traders believe that the recent price correction has reached rock bottom.

Crypto analyst and enthusiast, Crypto Jelle has offered a positive prediction regarding the price action of Bitcoin and its potential to move upward. His analysis delves into the current state of BTC’s price and the possibility of the retracement coming to an end.

According to Crypto Jelle, the average correction in “this bull market is almost 20%.” Meanwhile, the pullback is “roughly 18% deep” presently. As a result, Jelle believes that “we have most likely witnessed the worst of the drop,” suggesting that the price might be ready to undergo full recovery. 

Bitcoin

Jelle claims that the fall “should be bottoming out” any moment from now. However, this might not be happening soon, since “these things take time to form,” urging the crypto community not to rush it.

The post read:

The average pullback in this bull market is almost 20%. Since the current downturn is just about 18% deep, the worst is most likely behind us. Although these things take time to form, the bottom should be close. Do not rust it.

In another X post, Crypto Jelle noted that the market has once again begun to “display signs of a local bottom.” Due to this, the largest cryptocurrency asset by market cap still has “work to do.”

Crypto Jelle anticipates Bitcoin to hold above the $65,300 threshold, in order for the price to “regain that 2021 bull cycle peak.” Additionally, when his forecast takes place, he believes that prices “will be off” in the upward direction in no time.

Amount Of BTC To Buy Using DCA Strategy

As Bitcoin continues to struggle, crypto analyst Ali Martinez has underlined the amount of BTC to purchase within specific price levels using the Dollar-Cost Averaging (DCA) strategy.

According to Martinez, when BTC is within the range of $65,130, $64,130, $63,130, and $62,130, investors should buy 0.5 BTC. Meanwhile, at the $61,130, $60,130, $59,130, and $58,130 levels, investors should acquire about 0.65 BTC.

Furthermore, around $57,130, $56,130, $55,130, and $54,130, Martinez advocates the acquisition of 0.8 BTC. Lastly, a portion of 0.95 BTC should be purchased around $53,130, $52,130, $51,130, and $50,130.

At the time of writing, Bitcoin was trading at $67,299 on the daily timeframe, indicating an increase of over 4%. Its market cap has risen by 4.97% in the past day, while its trading volume is down by over 12%.

Bitcoin

MATIC Price Slumps 10% Amidst Market Downturn – Here Are Key Levels To Watch

MATIC, the native token of the Polygon network, has witnessed a significant decline in its value. It has fallen by more than 10% in the past week and 8% in less than 24 hours as the general cryptocurrency market continues to grapple with a cloud of negative sentiment.

Fortunately, the latest on-chain analysis has revealed the important levels that investors should look out for following the latest decline in the MATIC price.

Over 10,900 Addresses Bought 600 Million Polygon Tokens At This Price

According to a recent post on X by crypto pundit Ali Martinez, the price of MATIC has established a key support around its current price point. This evaluation is based on analytics firm IntoTheBlock’s on-chain data, which tracks the average acquisition price for any given wallet address.

MATIC


Above is the chart highlighted by Martinez that shows the distribution of the Polygon token supply across various price ranges. The size of the dots in the chart represents the magnitude of coins purchased around the corresponding price range.

Most notably, over 10,900 wallet addresses bought a whopping 608 million MATIC around the $1.02 and $1.05 zone. According to the crypto analyst, this massive buying activity has supported the establishment of crucial support around this price region.

While the large size of the dot reflects the strength of this particular level, sustained bearish pressure could cause the price of MATIC to breach and fall beneath this support. In this case, investors could see the cryptocurrency drop to around $0.91.

This makes the $0.89 and $0.92 price range another level to watch, as it represents the next vital support area, where 35,680 wallet addresses purchased nearly 400 million Polygon tokens.

MATIC Price Overview

As of this writing, the price of MATIC stands at $1.04, reflecting an 8% decline in the past 24 hours. This price dip comes after the altcoin printed a multi-month high of $1.28 on Thursday, March 14.

According to data from CoinGecko, the Polygon coin has suffered a 9.7% price slump in the last seven days. From a broader perspective, though, the cryptocurrency has had a fairly positive performance in the past month.

With a market capitalization of more than $9.7 billion, the MATIC token ranks as the 18th-largest cryptocurrency in the sector.

MATIC

Analyst Cites Key Indicators That Signal Bitcoin Correction

The price of Bitcoin witnessed a pullback on Tuesday amid a general bearish sentiment around the crypto market, after the digital asset reached the $69,000 threshold.

Bitcoin Might Undergo Further Correction

Following the correction, several predictions of a further decline in the price of Bitcoin from top crypto analysts have surfassed. Cryptocurrency analyst and trader Ali Martinez has highlighted a few indicators that suggest a continuous retracement in price.

Martinez took to the social media platform X (formerly Twitter) to share his projections with the crypto community. According to Ali Martinez, on the daily chart of Bitcoin, the Tom DeMark (TD) Sequential indicator presently “flashed a sell signal.”

The crypto analyst believes that this development deserves to be closely monitored. This is because the indicator “boasts a solid history of predicting Bitcoin trends” since the beginning of the year.

Bitcoin

He further pointed out that the indicator suggested a buy signal earlier in January, which was followed by a 34% rise in Bitcoin’s price. In addition, in the middle of last month, the indicator also suggested a sell signal, after which Bitcoin plummeted by over 4%.

With the TD Sequential presently developing a sell signal, BTC might be poised to undergo a correction in the short term. However, there is no guarantee that the price of BTC will see a correction following the signal.

Martinez also underscored the accuracy of the pointer in predicting BTC’s price movement, which he believes to be “remarkably insane.” In a previous projection, Martinez asserted that BTC has declined by “1.5% to 4.7%, each time the indicator recommends a selling” since February 15.

As a result, short-term traders should carefully observe the trend in order to position themselves for future gains. So far, some market watchers feel that Bitcoin’s retracement was necessary, and they perceive the fall as a positive move.

BTC Could See A 20% Drop This Time Around

Martinez is not the only expert that has predicted a pullback in the short term. Crypto Jelle has also shared his negative forecast for BTC, pointing to a 20% price correction.

Jelle noted as BTC moves towards its all-time high of $69,000, “there will be downturns along the way.” He further stated that this “time around,” it seems BTC might decline by 20%.

Thus, the crypto analyst has urged not to be shaken by the outcome while telling them to “take advantage” of the development when it occurs. This is because Jelle believes that the key to making it in the crypto space is patience.

Currently, the price of Bitcoin is down by over 2% in the last 24 hours, trading slightly above $66,000. Despite the price drop, its trading volume is up by over 37%, while its market cap is down by 2%.

Bitcoin

Bitcoin Crossroads: Analyst Identifies Level Set To Determine Next Move

Bitcoin has been on an upward trajectory for a while now, witnessing a significant rally within the broader crypto market and reaching the $64,000 threshold on Sunday, as analysts have identified trends that could decide the asset’s next direction.

Bitcoin Poised To Witneesed A Rally Or Dip In Short Term

Cryptocurrency analyst and trader Ali Martinez has taken to the social media platform X (formerly Twitter) to share his insights on Bitcoin’s price action in the short term with the crypto community.

Martinez has spotted an area that could either lead to an uptick or a correction. Ali Martinez highlighted that more than half a million Bitcoins have been transacted within the range of $61,100 and $61,800, and as a result, the crypto asset has formed a “substantial support area.”

According to the analyst, BTC is expected to rise towards $65,900, if it manages to hold above this level. However, the experts expect this to happen considering the lack of obstacles that lie ahead.

Bitcoin

Furthermore, Martinez has also pointed out the potential for Bitcoin to undergo a correction if it falls below the support level. The crypto analyst stated that if this happens, BTC could decline to “$56,970 or even deeper to $51,500.”

The Post read:

Over 500,000 BTC have been transacted in the range of $61,100 to $61,800, which has created a substantial support area. If Bitcoin remains above this threshold, it could climb towards $65,900, given the minimal resistance ahead. Conversely, should BTC dip below support, a correction could lead it down to $56,970 or even $51,500.

Ali Martinez’s predictions came in light of the broader crypto market experiencing a significant rally. Presently, the entire crypto market is seeing a substantial capital inflow not recorded in over 2 years.

Martinez noted in another X post that approximately $48.54 billion is entering the crypto market, indicating a rise in investors’ interest in crypto. He further underscored that the development marks the “largest inflow of capital since October 2021.”

So far, experts forecast that in the upcoming months, there will be bigger financial inflows due to more lucid cryptocurrency regulatory frameworks.

BTC ETFs To Control 10% Of The Crypto Asset’s Supply

Bitcoin Spot Exchange-Traded Funds (ETFs) continue to gain traction as BTC maintains its upward momentum. Due to this, SkyBridge founder Anthony Scaramucci has predicted that the products could “take control of 10% of BTC’s supply.”

Scaramucci noted that a lot of BTCs have been “lost since the ETFs were introduced.” Consequently, ETFs now boast about 776,000 BTC since the products began trading. 

However, he expects the products to take control of the aforementioned percent “when it hits 1.7 million BTC.” Anthony Scaramucci is confident that when this happens, there will be a swift rise in Bitcoin’s price.

Currently, the price of Bitcoin is trading at $65,184, demonstrating an increase of over 5% in the last 24 hours. Meanwhile, its market cap and trading volume are both up by 5% and 79% respectively in the past day.

Bitcoin

XRP Price Soars: Analyst Predicts Surge Beyond $200

In spite of a slight adverse trend in the crypto market, XRP has been gradually rising in recent days, fueling positive and bullish predictions from market analysts to unprecedented heights.

XRP Might Rally To New All-Time High Sooner Than Expected

Javon Marks, a cryptocurrency expert and internet personality, has revealed his optimism towards XRP, sharing a daring prediction regarding the crypto asset’s future with the community on the social media platform X (formerly Twitter).

According to the crypto expert, XRP might be poised to undergo a significant movement that will send prices to unprecedented heights, where he highlighted that there is a possibility that XRP can rally beyond the $200 price mark.

Marks noted that the digital asset is presently experiencing “another set of higher lows” that are holding. In addition, he pointed out that “another breakout” has taken place in the XRP chart.

XRP

As a result of this, XRP could witness “a massive upward movement” to New All-Time highs (ATHs), which Javon Marks expects to commence soon.

The post read:

A $200+ XRP (Ripple) can be possible. Another set of Higher Lows are holding and another breakout has taken place, meaning that a massive upside move to new All Time Highs can be commencing soon.

The crypto analyst’s analysis aligns with a historical trend that had previously occurred in 2018, sending XRP’s price to its current ATH of $3.3. Prior to the surge, the token fell from the December 2013 high of $0.06, creating a bearish declining trendline.

For several years, XRP was below this declining trendline, with two unsuccessful breakout trials during that timeframe. Nonetheless, after failing to break out twice, the coin persisted and managed to break out in 2017.

After this breakout, it increased by over 63,000% to its present all-time high price of $3.3. Based on Mark’s predictions, it indicates that this precise trend is manifesting right now.

However, some community members have expressed their displeasure with the analyst’s projections. A pseudonymous X user disagreed with Marks saying “It does not make any sense” given the “basic tokenomics” of the crypto asset.

The Crypto Asset Poised For A Move Above $0.60

Cryptocurrency analyst Ali Martinez has underscored the potential for XRP to move past the $0.60 price mark. According to his post, Martinez’s position was influenced by the observation made by the Tom DeMark (TD) Sequential.

He stated that the TD Sequential indicator has formed a buying signal on the token’s chart. Consequently, this indicates a possible bullish momentum for XRP to move higher. 

He further asserted that if it manages to maintain its weekly close above $0.57, it could serve as a catalyst for an upswing to $0.63 or even further, setting his target at $0.65 

As of the time of writing, XRP was trading at $0.538, demonstrating a decline of 1.39% in the past day. Its market cap is down by 1.42%, while its daily trading volume is up by over 4%, according to CoinMarketCap.

XRP

Bitcoin Bulls In Jeopardy? Analyst Sounds Warning Of Possible Retest

Bitcoin has been on a bullish trend, reaching $50,000 for the first time in two years, but some crypto analysts still anticipate that the token might be gearing up for a potential correction.

Bitcoin Could See A Pullback At Any Moment

According to the recent analysis by cryptocurrency expert Crypto Jelle, Bitcoin could undergo a retest anytime soon. Jelle shared his latest projections with his thousands of followers on the social media platform X (formerly Twitter).

A chart of Bitcoin accompanied his X post to demonstrate his observations and further back up his claims visually. Crypto Jelle’s analysis examines the current and past position of Bitcoin and has identified the presence of a “rising channel.” 

He stated that Bitcoin has been in this rising channel “over the past 6 years.” He further pointed out that the crypto asset is not breaking out of the “channel anytime soon.”

Bitcoin

Due to this, Crypto Jelle believes that the price of BTC might witness a “retest of the mid-range.” Thus, he has urged investors to get involved with the token to increase prices and avoid the impending pullback.

The post read:

Bitcoin has spent the past 6 years inside this rising channel. Doesn’t look like that’s going to change anytime soon. In fact, it seems about time for a retest of the mid-range. Send it higher.

Jelle has also underscored the potential for the digital asset to soar higher to a new all-time high. In another X post, he highlighted that today is “one of those days to recall the part of the cycle we are in.”

Jelle has underlined two distinct timeframes for Bitcoin, which include the lower timeframe and the higher timeframe. He asserted that in the lower timeframe, BTC’s performance looks like “dog poop.”

Meanwhile, in the higher timeframe, BTC’s performance looks promising, suggesting a move to a new price level. Jelle appears bullish on Bitcoin as he has encouraged the community not to be “shaken out” of the market.

Massive Sell-Off By BTC Whales

Despite the upward momentum, reports have revealed a significant selling spree from BTC whales. Ali Martinez, a well-known crypto analyst, reported Tuesday’s development on the X platform.

Per Martinez’s post, Bitcoin whales might lose their confidence in the token. Martinez asserted that whales have sold over 30,000 BTC valued at $1.56 billion in the past 2 days.

The report has sent quite a frenzy in the community, leaving crypto enthusiasts to ponder the impact of the sell-off. However, it is believed that this could be a notable development, indicating the start of a distribution phase, which could extend the low timeframe bearish action. 

Bitcoin

Is Bitcoin Price Facing A Correction To $46,000? Here’s What This Analyst Thinks

Over the past week, the Bitcoin price put in one of its finest performances since the start of 2024, breaking above $50,000 for the first time since 2021. While the premier cryptocurrency has been moving mostly sideways in the past few days, it continues to hold its own above the $51,000 mark.

However, a popular crypto analyst on the X platform has put forward an interesting prognosis for the Bitcoin price, stating that the coin might experience some bearish pressure in the near future.

Is BTC Headed To $46,000?

On Thursday, February 15, prominent crypto analyst Ali Martinez sounded the sell alarm – based on the Tom Demark Sequential indicator – for Bitcoin. According to the analyst, investors should anticipate a one-to-four candlesticks correction on BTC’s daily chart in the coming days.

Ali Martinez took to the X platform on Saturday, February 17, to share an in-depth analysis of an impending correction for the Bitcoin price. This evaluation is based on the distribution of holders’ cost basis across the various BTC price zones near the current price of the cryptocurrency.

With this on-chain indicator, the strength of any resistance or support level depends on the number of coins acquired by investors within the price range. And this strength is portrayed by how large or small the circles (representing the price ranges) are.

Bitcoin price

As shown in the chart above, the price of Bitcoin seems to be facing significant resistance between $51,099 and $52,582. Recognizing this pattern, Martinez said in his post that if the flagship cryptocurrency fails to reclaim the $52,000 level, then it is at risk of an 8% price correction. 

An 8% decline from the current point would see the Bitcoin price drop to between the $48,000 and $46,500 zone. According to the on-chain resistance data, more than 1 million addresses bought 544,870 BTC within this range, making it a significant support level.

Bitcoin Price Overview

As of this writing, the Bitcoin price stands at around $51,650, reflecting an almost 0.9% dip in the past 24 hours. Despite the recent bearish pressure slowing down its momentum, the market leader has maintained most of its profit from the past week.

According to data from CoinGecko, Bitcoin’s value has jumped by more than 8% in the last seven days. Meanwhile, the cryptocurrency has registered over 20% growth so far in the month of February.

Thanks to the recent price rise, BTC surpassed the $1 trillion mark in terms of market capitalization, solidifying its position as the largest asset in the cryptocurrency sector.

Bitcoin price

Bitcoin Bull Run: On-Chain Data Points To Declining Retail Participation

The price of Bitcoin has continued to soar this week, with the premier cryptocurrency consolidating its place above the $50,000 mark. Interestingly, on-chain data shows that a particular class of investors had less to do about the recent rally, sparking conversations about their participation in the current bull cycle.

Recent BTC Price Primarily Fueled By ‘Institutional Demand’

In a recent post on X, analyst Ali Martinez pointed out that there has been an apparent decline in the involvement of retail investors in the Bitcoin market. This shift comes despite the recent surge in the flagship cryptocurrency’s price.

This revelation is based on the noticeable fall in the daily creation of new Bitcoin addresses. According to the crypto intelligence platform Glassnode, this metric tracks the number of unique addresses that appeared for the first time in a transaction of the native coin in the network.

Bitcoin

Typically, more individuals are inclined to enter the market as the value of Bitcoin increases, often resulting in a spike in new addresses to store and transact the coin. However, there is currently a deviation between the BTC price and the creation of new addresses.

According to Martinez, this curious trend suggests a lack of retail participation in the ongoing Bitcoin bull run. The crypto analyst, however, tied the flagship cryptocurrency’s recent positive performance to institutional players’ activity.

This analysis seems to hold some weight, considering it’s been a little over a month since the Securities and Exchange Commission approved the trading of spot BTC exchange-traded funds in the United States. These investment products are issued and managed by some of the world’s largest financial companies, including BlackRock, Grayscale, Fidelity, and so on.

Bitcoin Whales Show Highest Activity Since 2022

Another on-chain revelation that somewhat supports the argument of increased institutional participation has emerged. According to analytics platform Santiment, BTC whale activity has been heating up lately, reaching its highest level in over 20 months.

Data from Santiment shows that wallets with 1,000 – 10,000 BTC are on an accumulation spree, adding roughly 249,000 coins (worth about $12.8 billion) in 2024 only. However, it is worth mentioning that a lower tier of investors (100 – 1,000 BTC) has sold more than 151,000 Bitcoin since the year started.

As of this writing, Bitcoin is valued at $51,950, reflecting a 0.6% decline in the past day. Nonetheless, the premier cryptocurrency has retained most of its weekly profit, having gained almost 10% in the last seven days.

Bitcoin