
The personal and crypto-transaction related details could help identify users who failed to report their tax obligations, according to the Australian Tax Office.
Cryptocurrency Financial News
The personal and crypto-transaction related details could help identify users who failed to report their tax obligations, according to the Australian Tax Office.
Over the weekend, the crypto market started recovering from the largest retrace of this bull cycle. The strong correction caused Bitcoin and the altcoins market to drop to levels not seen since February.
While some sectors of the crypto community felt like the bull run was over or needed to “cool-off”, others seemed optimistic about the cycle’s future. Now that the market is back from the correction, analysts foresee that the altcoin season might come soon.
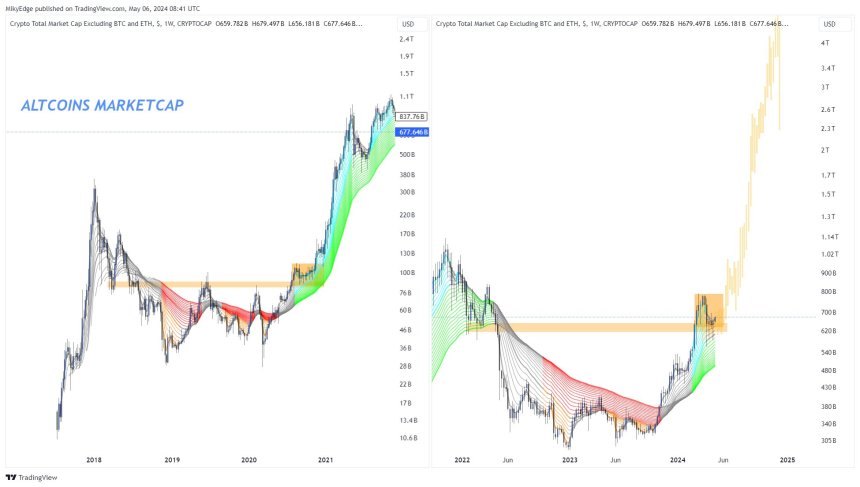
Over the weekend, crypto analyst and trader MilkybullCrypto shared with his X followers that the Altcoins market capitalization was at “an RSI level that initiates an explosive rally.”
Per his chart, this level is a “reset for a healthy rally,” as seen in 2016 and 2020. During these two cycles, when the altcoins reached this level, a “huge rally” followed.
The analyst shared his latest forecast on Monday after seeing the market strengthen its recovery. To Milkybull, the altcoins market cap finished a “Heatly retest.”
The market displayed a similar correction during the 2020-2021 rally before skyrocketing to all-time high (ATH) levels. The chart seems to display the same performance, which could mean that altcoins are “in preparation for an explosive rally,” if history repeats itself.
Similarly, crypto trader and analyst Captain Fabik considers the “Healthy Correction is done.” In his X post, the analyst identified a bullish falling wedge pattern, which signals a “bullish rally incoming.”
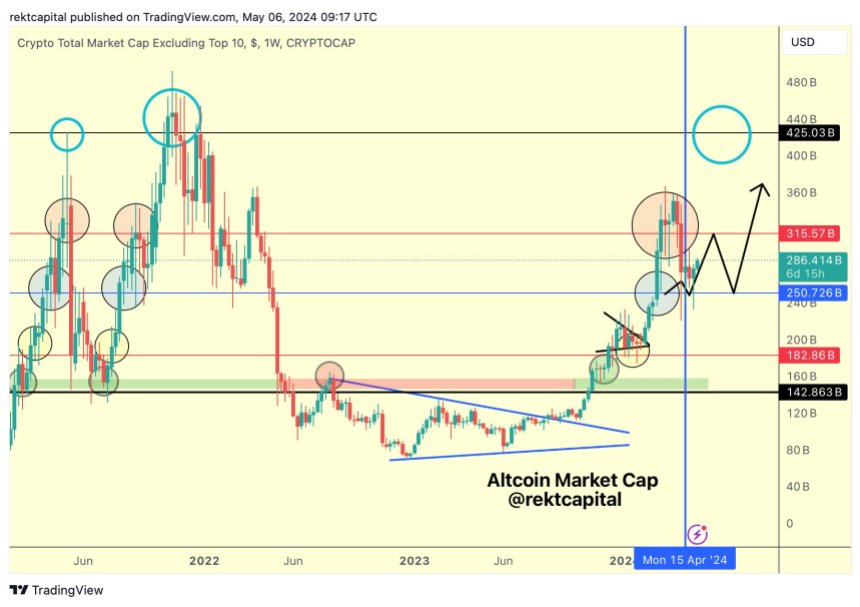
According to analyst and trader Rekt Capital, the Altcoin market cap, excluding the top 10 cryptocurrencies, has “successfully retested the $250 billion level as a support level” over the last several weeks.
Per the trader, the altcoins are following the proposed path of his “Ultimate Altcoin Market Cap Game Plan For The Coming Months.” On this plan, Rekt Capital forecasted altcoins market cap would surge to the $315 billion level before retracing back to the $250 billion mark. This retrace would be followed by an explosive surge above the $440 billion market capitalization.
Altcoins have stayed above the $250 billion support zone despite the strong corrections, as seen in the chart below. To the analyst, this suggests the market is “now showing initial signs of trying to curl up from here.”
Renowned figures have expressed their “disappointment” in altcoins’ performance this cycle. Altcoin Sherpa considers that “many alts didn’t even run that hard over the last few months,” which could suggest that it’s time for a “cool-off.” At the time, the analyst deemed altcoins’ rally was “done” for the next 1-4 months.
However, others believe the “euphoria phase” for altcoins is coming. According to Crypto Yhodda, “The alts will rise again, and by the end of 2024, they will go crazy.” Moreover, the analyst believes that “Altcoins Cycle III” will give us some crazy pumps.
According to his chart, the altcoins’ cycle I and II displayed a symmetrical triangle pattern before the breakout. The surge was followed by a slowdown before the upward trajectory continued, called “Round 1” by the analyst.
Subsequently, the rally would repeat the pattern on a second round before reaching the cycle’s top. “Cycle III” appears to be in the middle of Round 1, which suggests to the analyst there is a long road ahead before it “hits the euphoria phase.”
Many investors expressed worries about the crypto market corrections during this cycle. Bitcoin’s price drop has dragged altcoins with them, and, as a result, a more pessimistic sentiment has started to brew among some sectors of the crypto community.
Analysts and traders have reassured investors that the market fluctuations are a normal part of the journey. Some urge the community to look at the bigger picture, as altcoins remain above levels not seen in years.
Renowned crypto analyst Altcoin Sherpa weighed in on the matter, exploring some of the reasons and differences that make this bull cycle different from the 2020s.
In an X post, Altcoin Sherpa asserted that there’s a high possibility “that altcoins are done for the next 1-4 months.” The analyst considers that, right now, most of the market needs “time to chill out and consolidate after such a big run.”
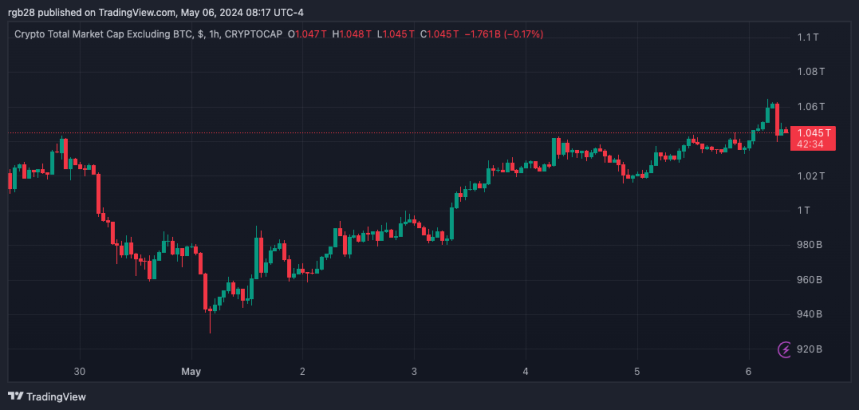
Despite recently falling below the $1 trillion market capitalization, altcoins have performed remarkably in the last few months. In 2024, cryptocurrencies’ market cap, excluding Bitcoin’s, has increased by 22.79%, according to TradingView data.
Altcoins market cap has also considerably surged in longer timeframes, with a 91.31% and 52.46% jump in the last six months and the past year. This “big run,” as Sherpa called it, sits the cryptocurrency market at levels like those seen in 2022.
However, what worries the crypto analyst is, despite the overall performance, “many alts didn’t even run that hard over the last few months.” He illustrated his point with Chainlink’s native token, LINK.
Despite the +500 days of accumulation, LINK investors only got 3-4x gains depending on when they go in. Now, the token’s price is “strongly pulling back.” Expectations for altcoins during this cycle seemingly play a significant role in the current sentiment.
As one X user pointed out, LINK was anticipated to be one of the biggest winners of this cycle, Sherpa replied that he “expected more lol.” The user playfully commented, “No dino coins and new and shiny coins are the better bet.”
How Did The Market Change?
The previous comment highlights what appears to be a significant difference between this bull run and the 2020s. Choosing your bag has become more difficult since the market has expanded significantly.
Sherpa considers that “now more than ever, it is super important to choose the altcoins that are going to run hard.” In 2020, the massive altseason made “everything go up consecutively.”
This time, the liquidity is more fragmented, and “only a few sectors are pumping.” The AI and memes sectors have been the hottest topic in 2024, and layer-1 (L1) tokens, like SEI, have also performed well. “Everything else? Not great,” remarked Sherpa.
The massive number of tokens, both newly launched and old ones, are finding it more difficult to “capture mindshare/attention.”
Regarding retail investors, the analyst is not surprised that the default choice is memecoins instead of “trying to learn about some DeFi veRewards type of stuff. Or Oracle or L1s or modular or anything else.”
The analyst suggested investors “move to real value” like ETH and SOL. He also considers that big token launches, with significant money behind them, “have some real value.” These coins, as stated in the post, have the potential to “do very well” once Bitcoin stabilizes.
Sherpa’s market analysis closes with a “pretty bearish” outlook for the following months. The growing difficulty in keeping user attention and “for people to become strong users/community members” for many projects has made the market a different playground.
Ultimately, the analyst pointed out that “portfolio rebalances are necessary” and said he still believes this run is not over.
In a post on X, one analyst observes that the altcoin market capitalization has broken from the Wyckoff accumulation phase. With this upswing, the trader expects altcoin prices to move higher.
This refreshing breakout coincides with Bitcoin’s (BTC) stellar performance when writing on February 28. At spot rates, the coin is trading above $60,000, a psychological round number- now supported- and is closely approaching $70,000.
The “Wyckoff accumulation pattern” is a concept developed by technical analysts to pick out potential buying opportunities, in this case, altcoins. Whenever prices are in this phase, it is widely believed that the so-called “smart money” or large institutional players are accumulating at low prices.
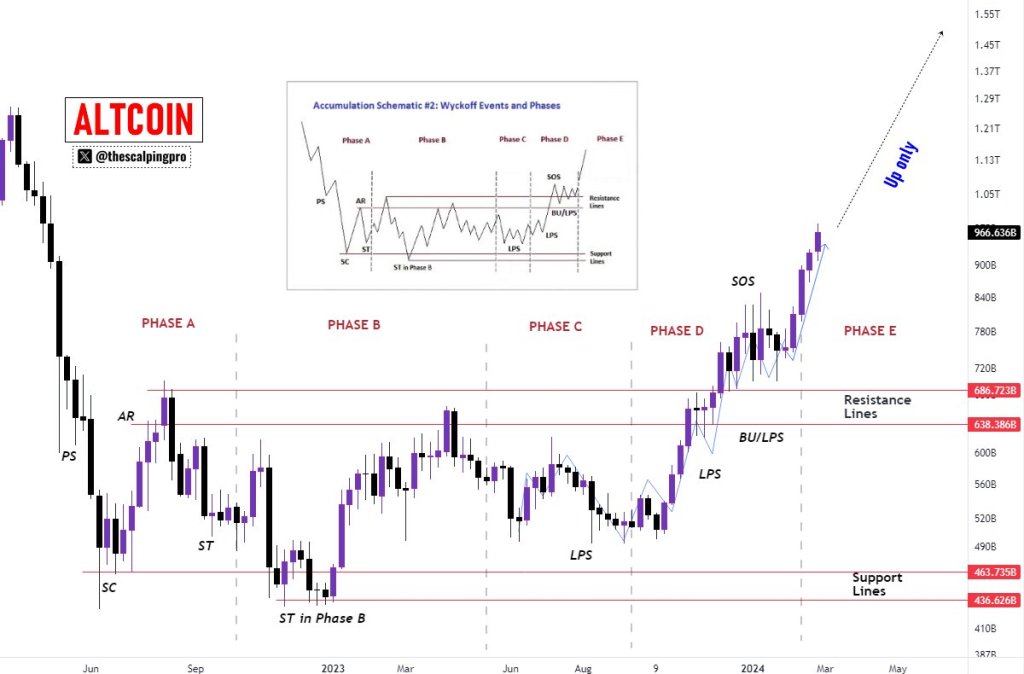
Currently, prices consolidate at tight ranges and with low trading volumes. A signal marking the end of this accumulation is a sharp breakout, lifting prices above the defined range. Often, this upswing is with rising trading volume.
Looking at the chart, the altcoin market cap has broken above the accumulation phase. With previous resistance and support, the altcoin market cap will likely continue floating higher. As such, top altcoins, including Ethereum (ETH), Solana (SOL), and XRP, will follow suit, posting fresh 2024 highs.
So far, Bitcoin is leading the way, posting over $10,000 in less than a week. However, with the coin trading above $60,000, its demand-side drivers differ entirely from what’s influencing altcoins. The approval of spot Bitcoin exchange-traded funds (ETFs) by the United States Securities and Exchange Commission (SEC) has seen billions of dollars flow to the world’s first cryptocurrency.
Therefore, while altcoins have historically outperformed BTC when crypto prices rally, there is an edge with spot Bitcoin ETFs. As such, this bull run will likely differ from 2017 and 2021. This forecast is because institutions will likely favor a regulated asset over altcoins whose status remains undefined.
As of late February 2024, the United States SEC has not approved spot ETFs of any altcoin, including that of Ethereum. Additionally, the agency has labeled several top altcoins, including Cardano (ADA), unregistered securities. The agency even filed lawsuits against major exchanges like Binance and Coinbase, accusing them of facilitating the trading of what the commission described as “unregistered securities.”
It is not immediately clear whether the United States SEC will change their preview of leading altcoins, especially Ethereum (ETH), which has a market of over $400 billion. Wall Street heavyweights like BlackRock and Fidelity remain interested in launching spot Ethereum ETFs.
Altcoins have witnessed a significant surge recently, with their collective market capitalization rising from $575 billion to $615 billion in just a few days – an increase of 7%. This momentum hints at the potential for further growth in the Altcoin sector.
The Altcoin market capitalization had been trading within a descending triangle pattern since its yearly peak in April. This technical pattern, characterized by a series of lower highs but consistent lows, typically signals a bearish sentiment – suggesting that each rally is met with increasing selling pressure, keeping upward price movements in check.
Related Reading: November Outlook For Bitcoin Price: Another Pump Or Retrace?
However, this past weekend marked a pivotal change. The market capitalization decisively broke through the pattern’s upper resistance line, surging by 7%. Such a breakout from a descending triangle is a bullish pattern, often indicating a reversal of the prior downtrend. With this breakout, the market cap is now eyeing the target set by the initial peak of the pattern, which could mean an additional increase of 7%.
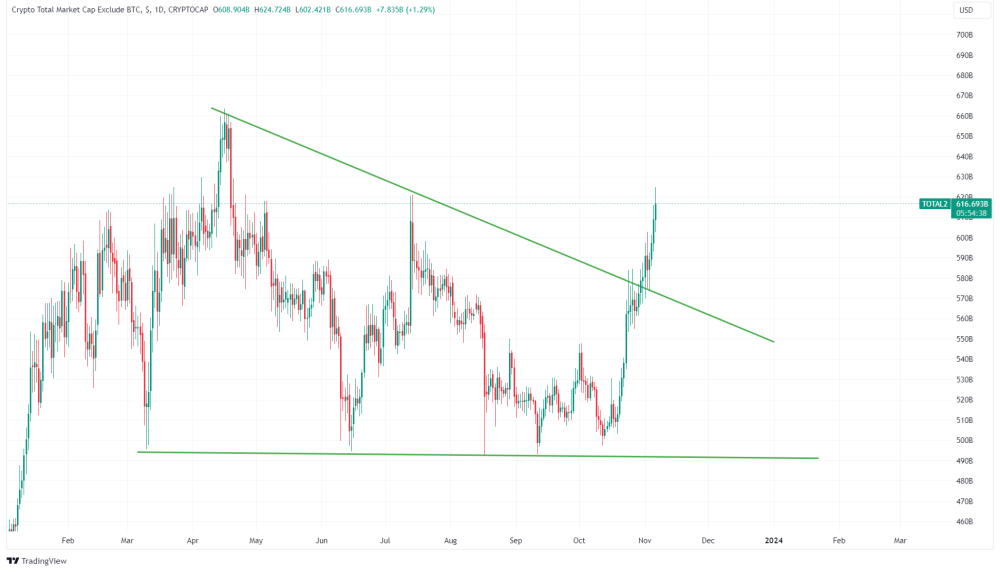
The significance of this breakout is further highlighted by the fact that the Altcoin market cap has not only broken through the resistance but also surpassed the previous high set in July. This breach could signal that the market is transitioning from a bear-dominated phase to a bullish one, where buyers are regaining control and pushing the market to new heights.
Bitcoin’s dominance on the market has recently slipped to 52.50%, down from its annual peak of 54%. This is a normal market fluctuation, considering Bitcoin had been on a ten-week streak of increasing dominance.
Related Reading: Bitcoin Season: Leading The Charge In The Crypto Market
Yet, it’s crucial to note that Bitcoin’s market share has dipped below the pivotal 53% support level. Should Bitcoin fail to reclaim dominance above this support level, we could anticipate a further decrease to the next support at 49%, opening the door for Altcoins to capture a greater portion of the cryptocurrency market cap.
In bear markets, Bitcoin’s dominance tends to increase as the market pulls back, which suggests that if Bitcoin manages to hold or increase its price, Altcoins could experience further rallies.
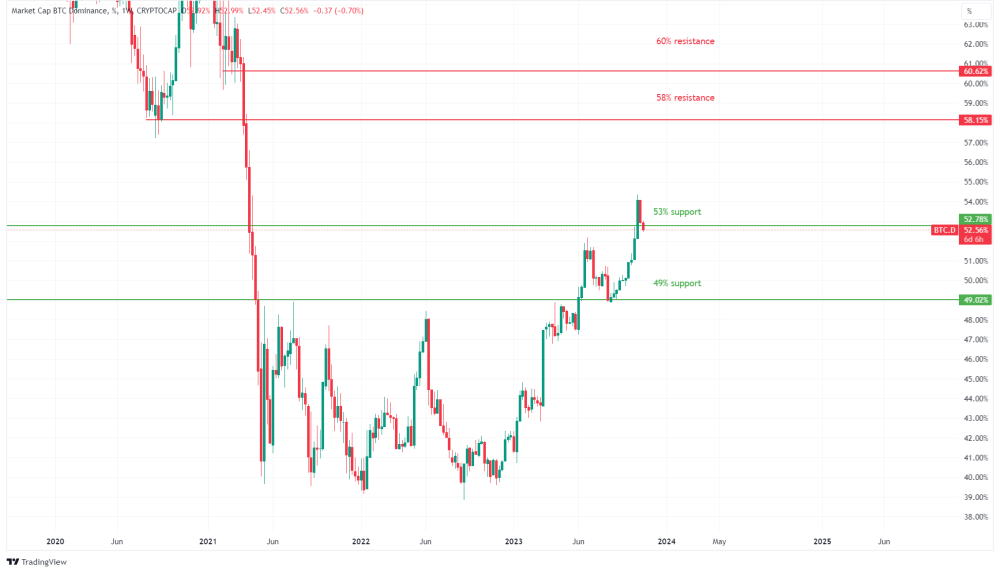
Conversely, an increase above the 53% support could set Bitcoin out for the next resistance at 58%, at the expense of Altcoins’ market share.
Historically, bull markets often begin with Bitcoin leading the way due to events like the halving event, which reduces the inflow of new Bitcoin.
Nonetheless, there are still phases when Altcoins rapidly gain momentum, experiencing significant and rapid price increases. The current market breakout, along with a reduction in Bitcoin’s dominance, hints that such a phase could potentially unfold now.
Top Altcoins Gains
In the past week, many Altcoins have witnessed remarkable gains. Here are the top performers:
Predycto is the author of a cryptocurrency newsletter. Sign up for free. Follow @Predycto on Twitter.
In its latest update on October 18, renowned crypto analyst Rekt Capital has highlighted six altcoins that have caught his attention, showing potential for the remainder of 2023, Ocean Protocol (OCEAN), Dogecoin (DOGE), Woo Network (WOO), Verasity (VRA), Stellar (XLM), and Injective (INJ).
Rekt Capital’s analysis suggests a crucial moment for the Ocean Protocol. Whether the current price deviation will result in a downside wick below the red channel placed at $0.2763 or if the price will close below it weekly.
While a downside wick followed by a recovery could lead to a move toward the Channel Top at $0.3247, a weekly close below the Channel Bottom would necessitate keen observation for price rejection as new resistance.
On the other hand, Rekt Capital notes that Dogecoin has been meandering at the bottom of its channel at $0.058890.
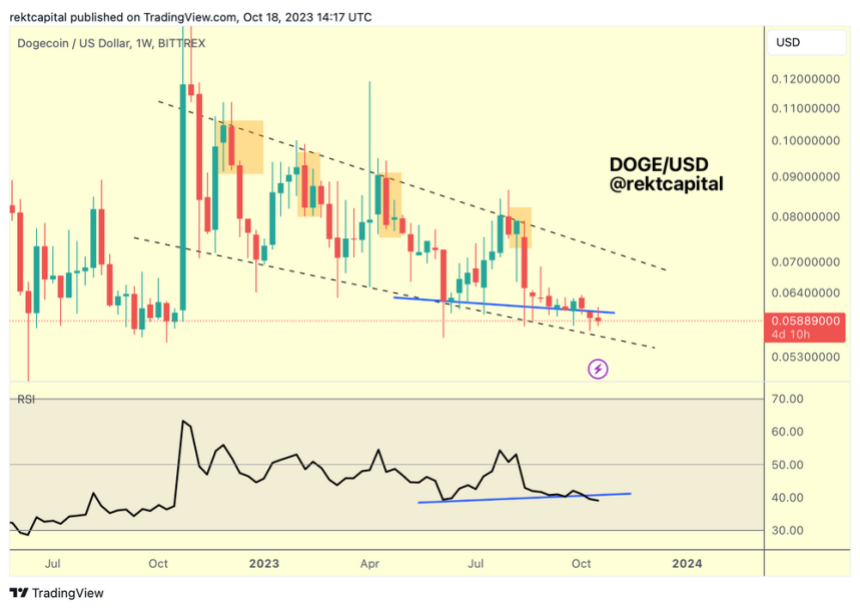
However, recent price developments indicate that the potential bullish divergence in its 1-week chart is likely no longer valid.
The lower low has shifted from support to resistance, confirmed by price action and a breakdown in the RSI’s trendline. Although a scenario of DOGE reclaiming its lower low remains possible, Rekt believes that a more definitive reaction is needed to confirm a potential fake breakdown.
Woo Network has experienced a relatively subdued quarter compared to the first half of 2023. Despite the uncertain macro outlook, WOO Network remains confident in its vision and mission.
Notably, the network successfully negotiated the repurchase of shares and tokens from the estate of Three Arrows Capital, alleviating uncertainty for WOO Network’s community and investors.
Verasity is a protocol and product layer platform for esports, video entertainment, and digital content management. Rekt Capital acknowledges the breakout from the mid-term downtrend structure in Verasity’s native token.
The token has been establishing higher lows after reaching a low point on October 4, indicating a potential shift in momentum.
Stellar is a blockchain-based payments network that facilitates global, efficient digital asset issuance and exchange. XLM has recently displayed sideways price action, trading below its 50-day and 200-day moving averages. Nonetheless, Rekt Capital includes Stellar in their altcoin watchlist, suggesting it is one to watch.
Injective is an open and interoperable blockchain optimized for DeFi applications, utilizing the Tendermint PoS consensus mechanism. Rekt Capital highlights the significant uptrend in INJ’s native token in the past 24 hours and over the past year, with a remarkable surge of 290%.
As Rekt Capital’s analysis indicates, these six altcoins – OCEAN, DOGE, WOO, Verasity VRA, XLM, and INJ – have caught the attention of the crypto analyst.
While each cryptocurrency presents its unique opportunities and challenges, investors and enthusiasts can look forward to monitoring their performances and assessing their potential for the remainder of 2023.
Featured image from Shutterstock, chart from TradingView.com
Bitcoin, the top asset in the industry has noted a sharp fall in prices over the last 24 hours. At press time, the king-coin depreciated by almost over 9.7%. Bitcoin dropped its value by almost $7,000 and was exchanging hands at $38,233.95. This marked an almost six-month low for the coin. This price level is the lowest ever since the first week of August last year. Following Bitcoin’s price action, altcoins followed suit as a majority of them were seen trading in the red at the time of writing.
The global cryptocurrency market cap was at $1.95 trillion after a considerable fall of about 7.7% over the past day. The global crypto cap hadn’t dipped below the $2.11 Trillion mark in over 3 months now. This major plunge in value across the broader cryptocurrency market had caused roughly $200 Billion to leave the market. Ethereum, which is the second-largest cryptocurrency in regards to market capitalisation also registered a tumble of about 8% in the last 24 hours.
Related Reading |TA: Bitcoin Dives Below $40K, Why Bulls Could Struggle In Near Term
What Could Have Potentially Caused This Big Dump
The bears had taken over the market, however, it isn’t safe to assume that the market would continue with a bearish outlook just yet. This could also be a price correction from which Bitcoin and major altcoins might recover over the upcoming trading sessions.
This retracement in Bitcoin’s prices from $43,000 could have happened for a number of reasons. Needless to say, crypto markets are volatile, however, current price movements of the major cryptocurrencies can be tied to a couple of recent developments in the crypto space.
This sudden substantial sell-off in prices could have been caused due to stock market weakness after the US Federal Reserve introduced high-interest rates and tapered the stimulus. The Fed hiking the interest rates in the form of tightening the overall monetary policy has, in turn, affected the unregulated market of cryptocurrencies.
The cryptocurrency industry has also suffered the pangs of other recent regulatory measures. The most recent one is Russia’s blanket ban which has rocked the global cryptocurrency market. Other regulatory measures which have been set in motion to curb the rapid growth of digital asset has also had negative effects on the prices.
Securities and Exchange Commission has signaled at scrutinising cryptocurrency exchanges. Environmental factors have also raised eyebrows of regulatory bodies, European Securities and Markets Authority (ESMA) wishes for the EU to ban the proof-of-work model.
All of the above-cited reasons have sent shock waves across the crypto industry causing the fear index to point at 19, a number that corresponds to “Extreme Fear” in the market.
Related Reading | TA: Ethereum Nosedives, Indicators Show Signs of Larger Downtrend
Bitcoin Price Analysis: Crucial Trading Levels to Watch Out For
Bitcoin was priced at $38,233.95 after the coin nosedived close to 9% at press time. The asset flashed a death cross, which is considered to be extremely bearish in nature. The prices were beneath the 20-SMA line, indicating that sellers were responsible for driving the price momentum in the market.
Source: BTCUSD on TradingView.com
The Relative Strength Index hurtled as it reflected the excessive selling pressure in the market. Currently, Bitcoin’s RSI was hovering beneath the 25-mark which meant that the asset was oversold and undervalued.
The support level for the coin stood at $37,982.40 and a push from the bears could make BTC trade at that aforementioned level. The Average Directional Index was near the 50-mark, implying a strengthening of the current price trend in the market. The resistance price level for the coin was $39,829.16.
Featured image from The Motley Fool, chart from TradingView.com


