85% Of Altcoins In “Opportunity Zone,” Santiment Reveals

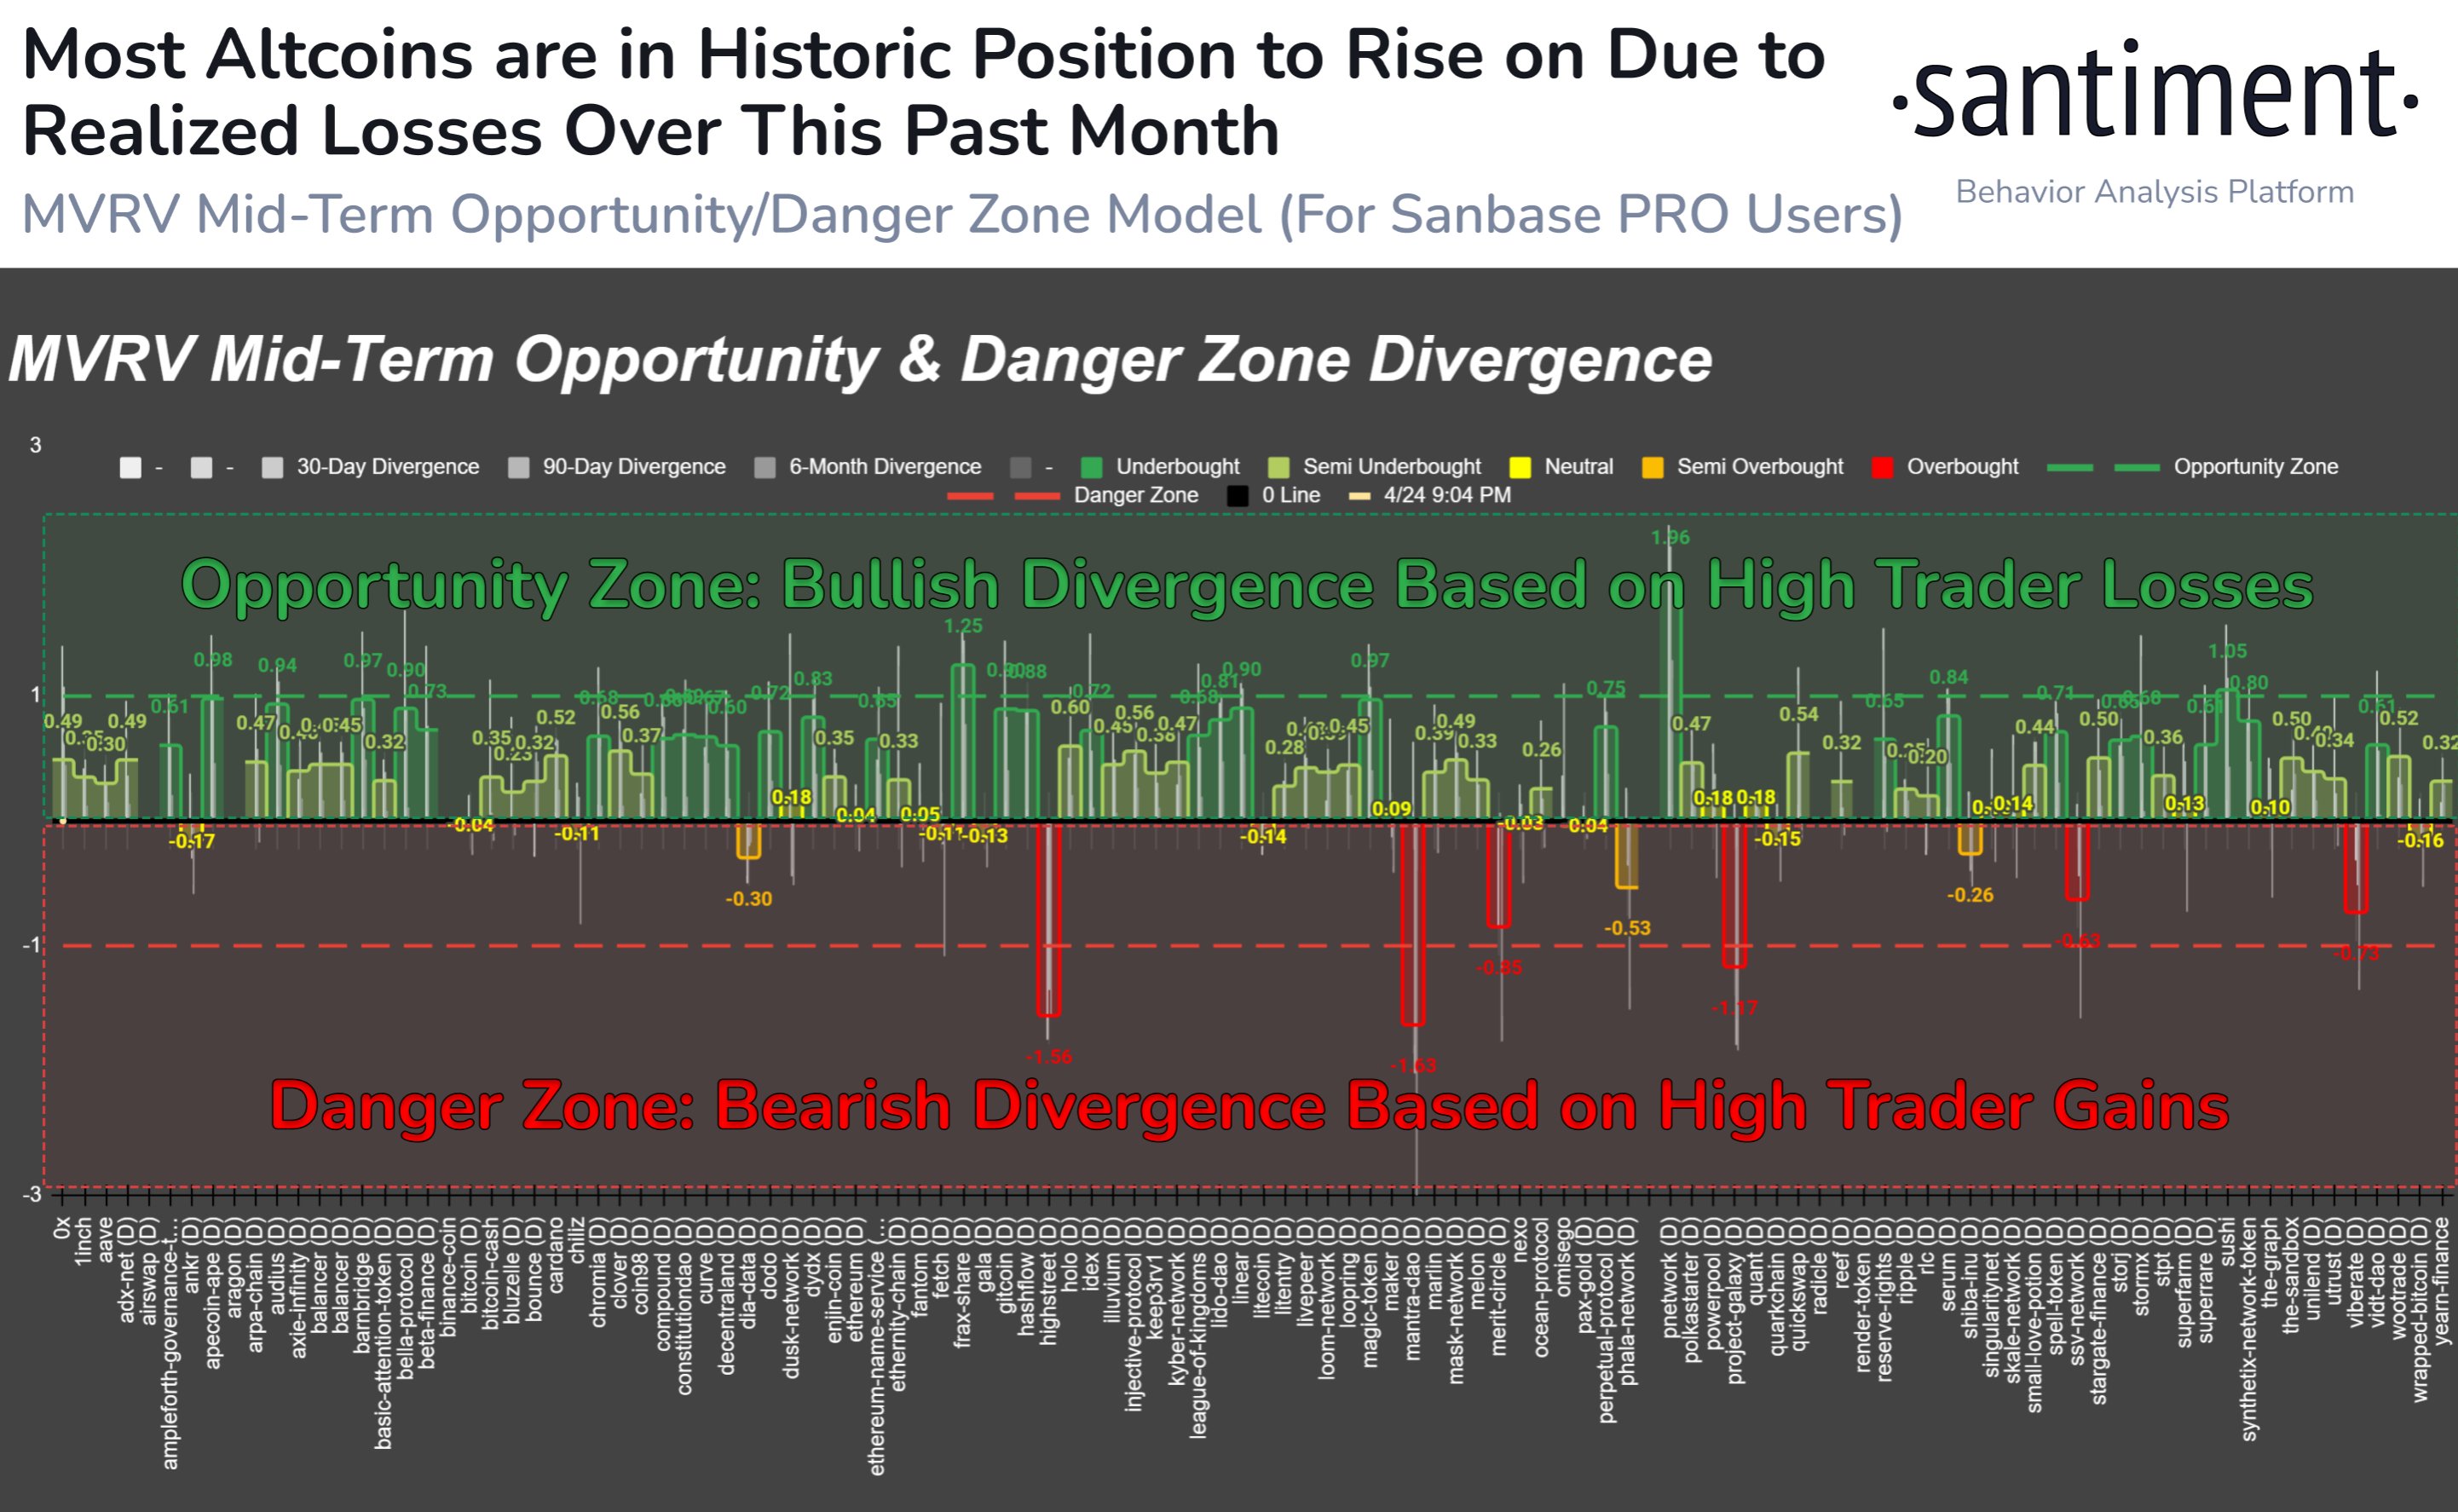
The on-chain analytics firm Santiment has revealed that over 85% of all altcoins in the sector are currently in the historical “opportunity zone.”

MVRV Would Suggest Most Altcoins Are Ready For A Bounce

In a new post on X, Santiment discussed how the altcoin market looks based on their MVRV ratio model. The “Market Value to Realized Value (MVRV) ratio” is a popular on-chain indicator that compares the market cap of Bitcoin against its realized cap.

The market cap here is the usual total valuation of the asset’s circulating supply based on the current spot price. At the same time, the latter is an on-chain capitalization model that calculates the asset’s value by assuming the “true” value of any coin in circulation is the last price at which it is transferred on the blockchain.

Given that the last transaction of any coin would have likely been the last time it changed hands, the price at its time would act as its current cost basis. As such, the realized cap essentially sums up the cost basis of every token in the circulating supply.

Therefore, one way to view the model is as a measure of the total amount of capital the investors have put into the asset. In contrast, the market cap measures the value holders are carrying.

Since the MVRV ratio compares these two models, its value can tell whether Bitcoin investors hold more or less than their total initial investment.

Historically, when investors have been in high profits, tops have become probable to form, as the risk of profit-taking can spike in such periods. On the other hand, a dominance of losses could lead to bottom formations as selling pressure runs out in the market.

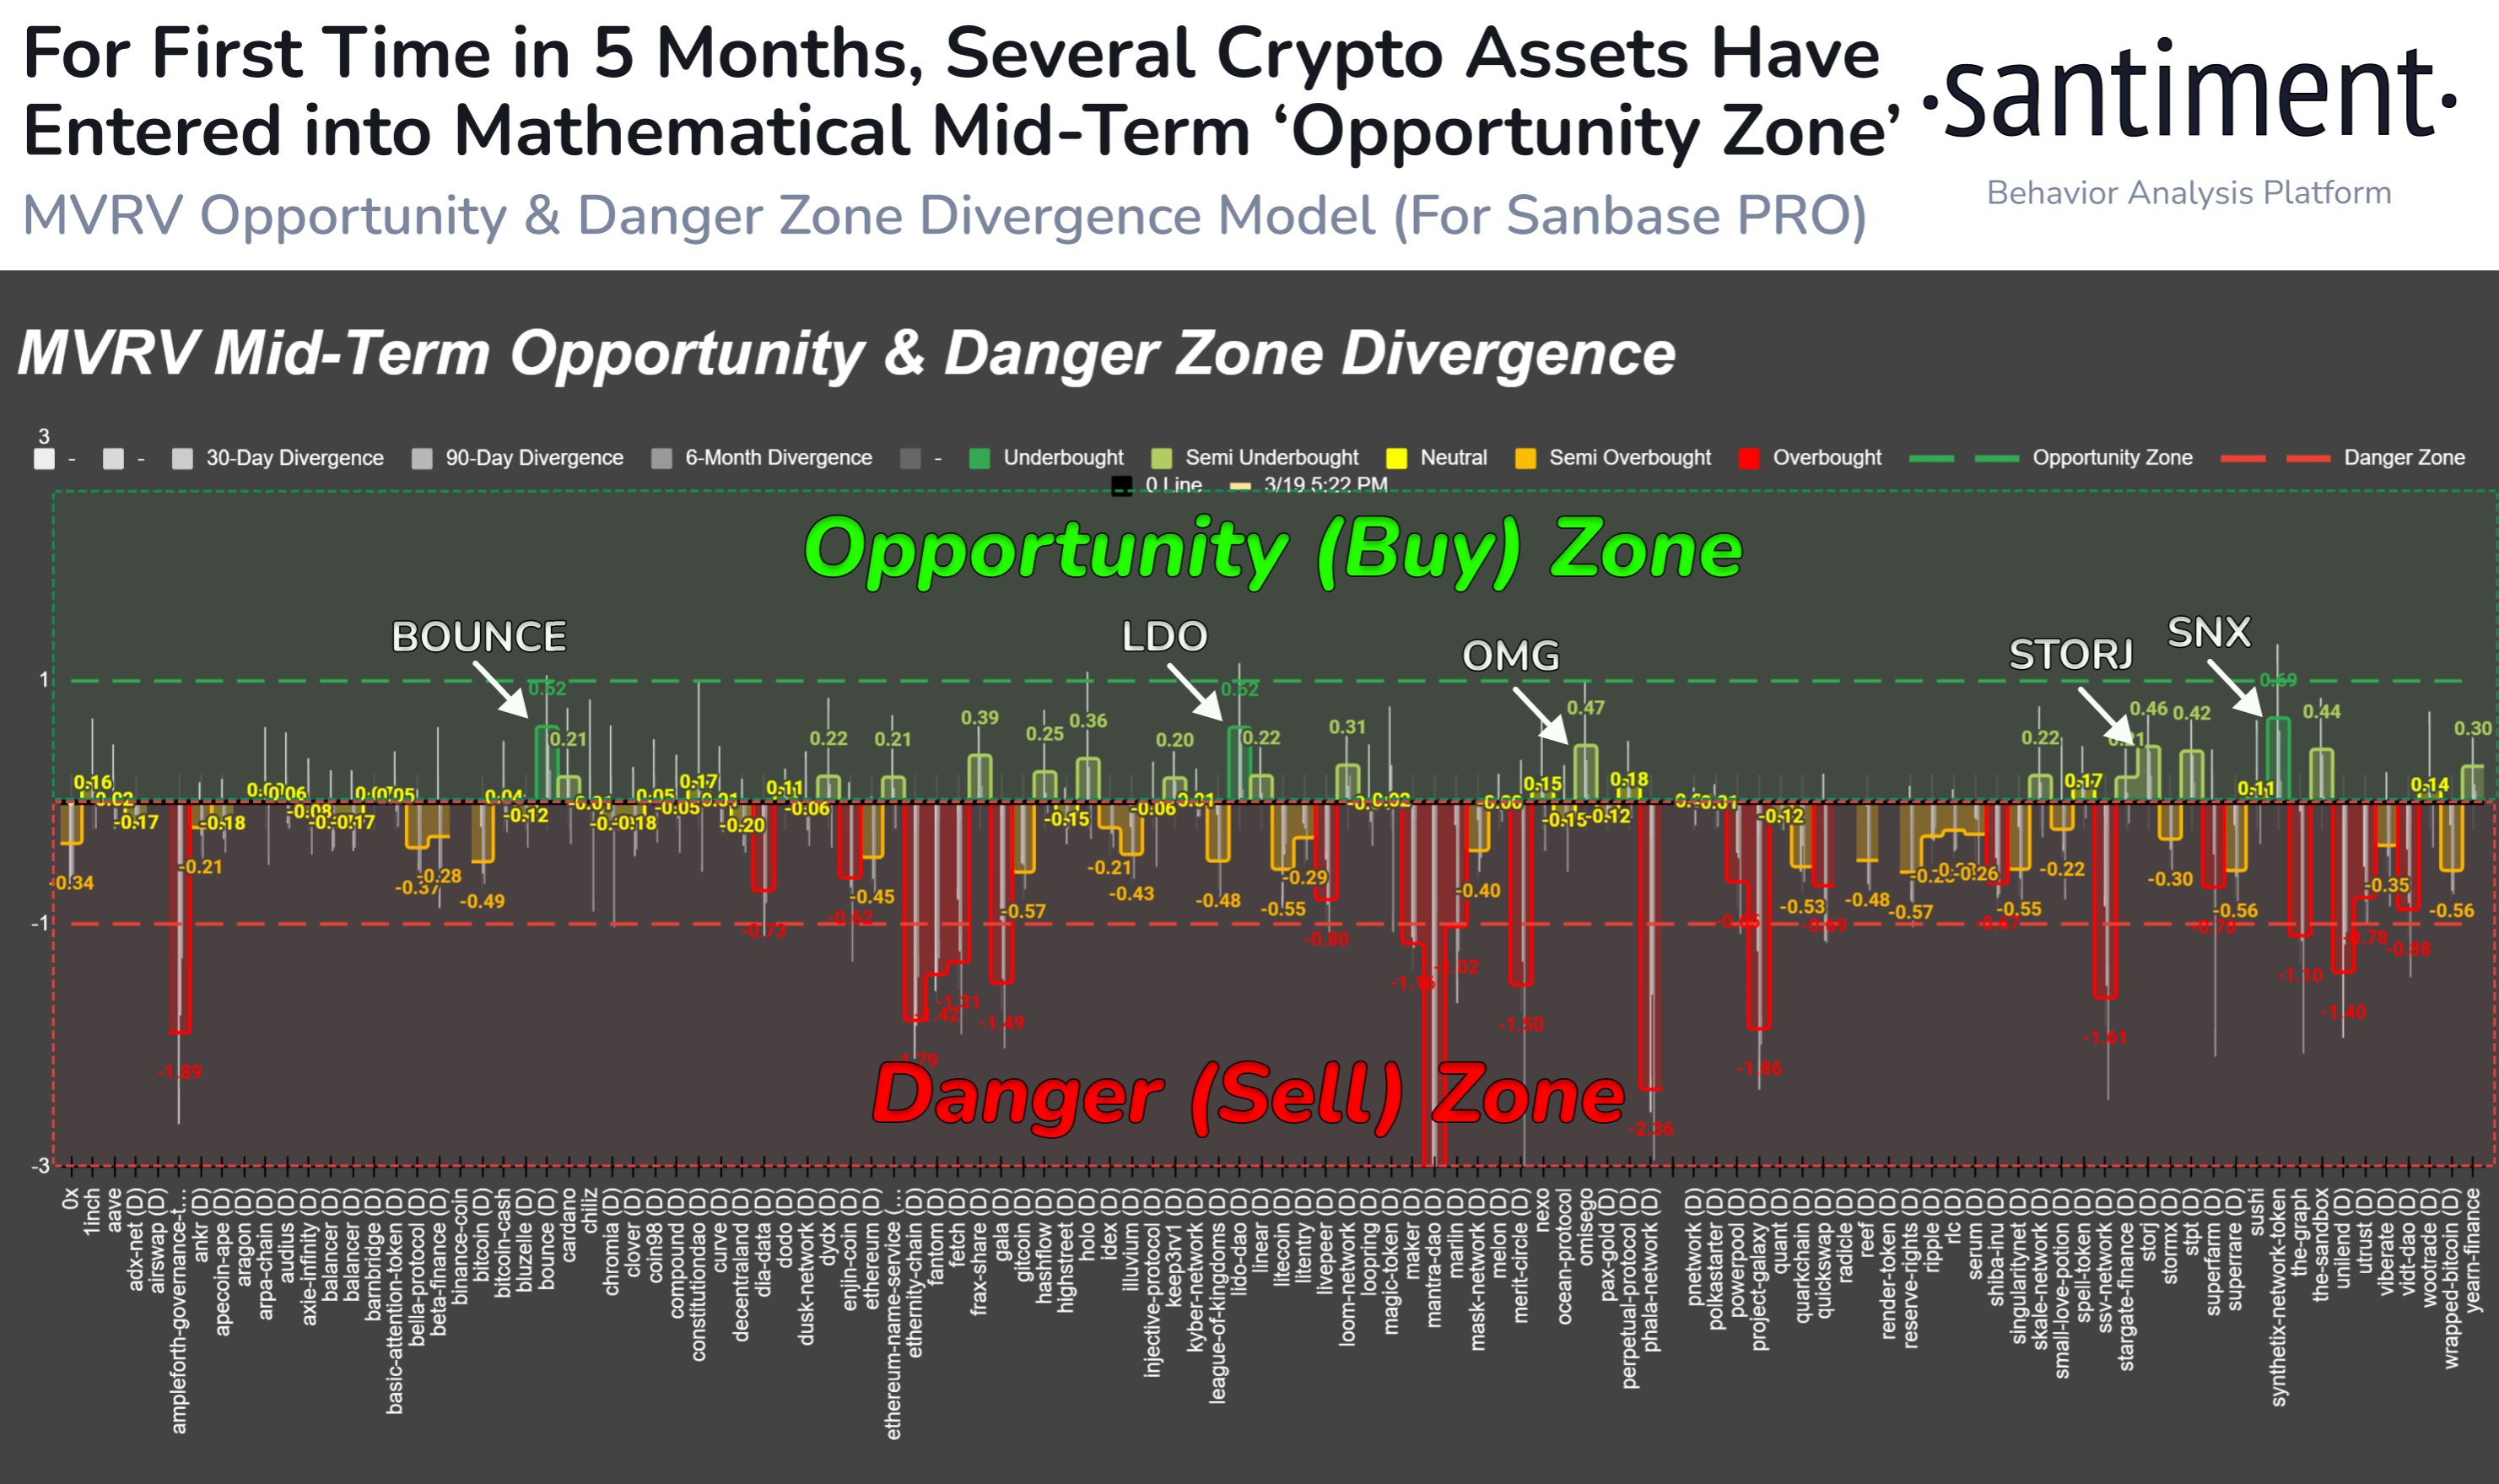
Based on these facts, Santiment has defined an “opportunity” and “danger” zone model for altcoins. The chart below shows how the market currently looks from the perspective of this MVRV model.

Bitcoin MVRV Ratio

Under this model, when the MVRV divergence for any asset on some timeframe is higher than 1, the coin is considered to be inside the bullish opportunity zone. Similarly, if it is less than -1, it suggests it’s in the bearish danger zone.

The chart shows that MVRV divergence for a large part of the market is in the opportunity zone right now. As the analytics firm explains,

Over 85% of assets we track are in a historic opportunity zone when calculating the market value to realized value (MVRV) of wallets’ collective returns over 1-month, 3-month, and 6-month cycles.

Thus, if the model is to go by, now may be the time to go around altcoin shopping.

ETH Price

Ethereum, the largest among the altcoins, has observed a 3% surge over the past week, which has taken its price to $3,150.

BNB Price Chart

Santiment Reveals Best Altcoins Currently In “Opportunity Zone”

The on-chain analytics firm Santiment has revealed the altcoins that have recently surged into the mid-term “opportunity zone.”

These Altcoins May Be More Likely To See Rebounds

In a new post on X, Santiment has discussed what the various altcoins in the market are looking like from the perspective of the MVRV. The “Market Value To Realized Value” (MVRV) refers to an indicator that keeps track of the ratio between the Bitcoin market cap and the realized cap.

The realized cap here is a capitalization model for BTC that measures the total sum of capital that the investors have used to purchase their coins. As such, the MVRV tells us about how the value that the investors are holding right now (the market cap) compares against this initial investment.

Historically, the more profits the investors have held (that is, the higher the market cap has been compared to the realized cap), the more likely tops have been to occur. This is naturally because investors become more likely to give in to the allure of profit-taking the higher their gains get.

On the other hand, cryptocurrencies have been probable to see rebounds when holders’ returns have dropped into the negative territory. In these conditions, there aren’t many profit-takers left, so selling pressure begins to run out.

Based on these facts, Santiment has come up with an “Opportunity & Danger Zone Model” that uses the MVRV’s divergence from the norm on various timeframes to determine if an asset is providing a potential window for selling or buying right now.

Below is the chart shared by the on-chain analytics firm that reveals what this model is saying for altcoins around the sector:

Altcoins MVRV Ratio

From the graph, it’s visible that a lot of coins are still inside the overbought territory, but several altcoins have managed to sneak into the mid-term opportunity zone following the recent market downturn led by Bitcoin’s plunge.

“This zone gets breached when an asset’s 30-day, 90-day, and 365-day average wallet returns are combining to be in negative territory,” explains Santiment. It should be noted, though, that while mid-term returns are red for these coins, they are still not yet inside the buy zone proper.

“In a zero sum game like crypto, projects with minimal returns compared to the rest of the sector have a higher probability of a more efficient rebound for those who are willing to #buythedip on projects traders are in the most pain on,” notes the analytics firm.

According to Santiment, some of the best altcoin candidates who are inside the mid-term opportunity zone include Lido DAO (LDO), Synthetix (SNX), Storj (STORJ), and OMG Network (OMG).

LDO Price

Lido DAO has had a bad time recently as its price has gone down more than 31% over the past week. With these red returns, it’s no wonder that the coin is becoming underbought on the MVRV.

Lido DAO Altcoin Price Chart

Altcoins Across The Sector Are Underbought: Santiment

On-chain data from Santiment suggests that altcoins across the entire cryptocurrency sector may be underbought right now.

MVRV Of The Various Altcoins Suggests Underpriced Conditions

According to data from the on-chain analytics firm Santiment, cryptocurrency assets have become underbought as traders are now capitulating following a failed price rebound.

The relevant indicator here is the “MVRV” (Market Value to Realized Value), which measures the ratio between the market cap and the realized cap of a given cryptocurrency.

Here, the “realized cap” refers to a capitalization model for BTC where the value of any coin in the circulating supply is assumed to be not the current spot price, but the price at which it was last transacted on the blockchain.

This model aims to calculate a sort of “fair value” for the asset. As the MVRV compares the market cap (that is, the current price) with the real value of the cryptocurrency, it can provide hints about whether the price is currently overinflated or not.

Santiment has defined an “opportunity” zone and a “danger” zone for this indicator. As their names already imply, the asset in question becomes underpriced when the metric is in the former area, while it becomes overpriced in the latter one.

Here is a chart that shows the trend in the divergence of the MVRV from these zones for the various altcoins in the sector:

Altcoins MVRV

Whenever the MVRV divergence has a value of 1 or more, the indicator is said to be inside the opportunity zone. Similarly, the danger area occurs below a value of -1.

While these are the two extreme zones, the metric being firmly inside either the positive or the negative zone (but not hitting either of these thresholds), still signals slight underbought or overpriced conditions, respectively.

This means that the chances of bullish rebounds can become greater whenever the indicator enters positive territory. From the chart, it’s visible that the vast majority of the coins in the digital asset sector are at least inside the positive territory at the moment.

This would imply that these coins may have become underpriced recently. Some of the altcoins are also outright inside the opportunity zone, suggesting that they may be offering low-risk buying opportunities right now.

There are a few cryptocurrencies, however, that are inside the negative zone, with a couple of them even being inside dangerous territory. Such alts have more chances of registering a decline in the near future.

Recently, the various altcoins have attempted to amass together a rebound, but so far, they have only seen failure. However, now that the prices have started to become undervalued, perhaps a break may be found soon.

BTC Price

At the time of writing, Bitcoin is trading around $26,400, down 1% in the last week.

Bitcoin Price Chart