Bitcoin Dominance: Traders Preferring The OG To Dogecoin & Other Altcoins

On-chain data suggests Bitcoin has recently experienced an influx of investors while Dogecoin, Cardano, and other altcoins have seen a slowdown.

Bitcoin Total Amount Of Holders Rise While Altcoins See Flat Movement

According to data from the on-chain analytics firm Santiment, the number of Bitcoin investors has sharply increased recently. The on-chain metric of interest here is the “Total Amount of Holders,” which keeps track of the total number of addresses on a given network carrying some non-zero balance.

When the value of this indicator goes up for any asset, it can be due to several things. The first and most obvious contributor to this trend would be adoption, as a fresh influx of users would naturally create more addresses.

Another contributor could be old investors returning to reinvest in the coin after selling out their balance earlier. The indicator would also increase when investors spread out their holdings among multiple wallets for reasons like privacy.

In general, some net adoption occurs whenever the Total Amount of Holders goes up. Historically, adoption has been a constructive sign for any blockchain in the long term.

Naturally, when this metric’s value goes down, it implies that some investors have decided to exit from the cryptocurrency as they have completely cleaned out their wallets.

Now, here is a chart that shows the trend in the Total Amount of Holders for some of the top assets in the sector: Bitcoin (BTC), Ethereum (ETH), XRP (XRP), Cardano (ADA), Dogecoin (DOGE), and Chainlink (LINK).

Bitcoin Total Amount of Holders Vs Dogecoin

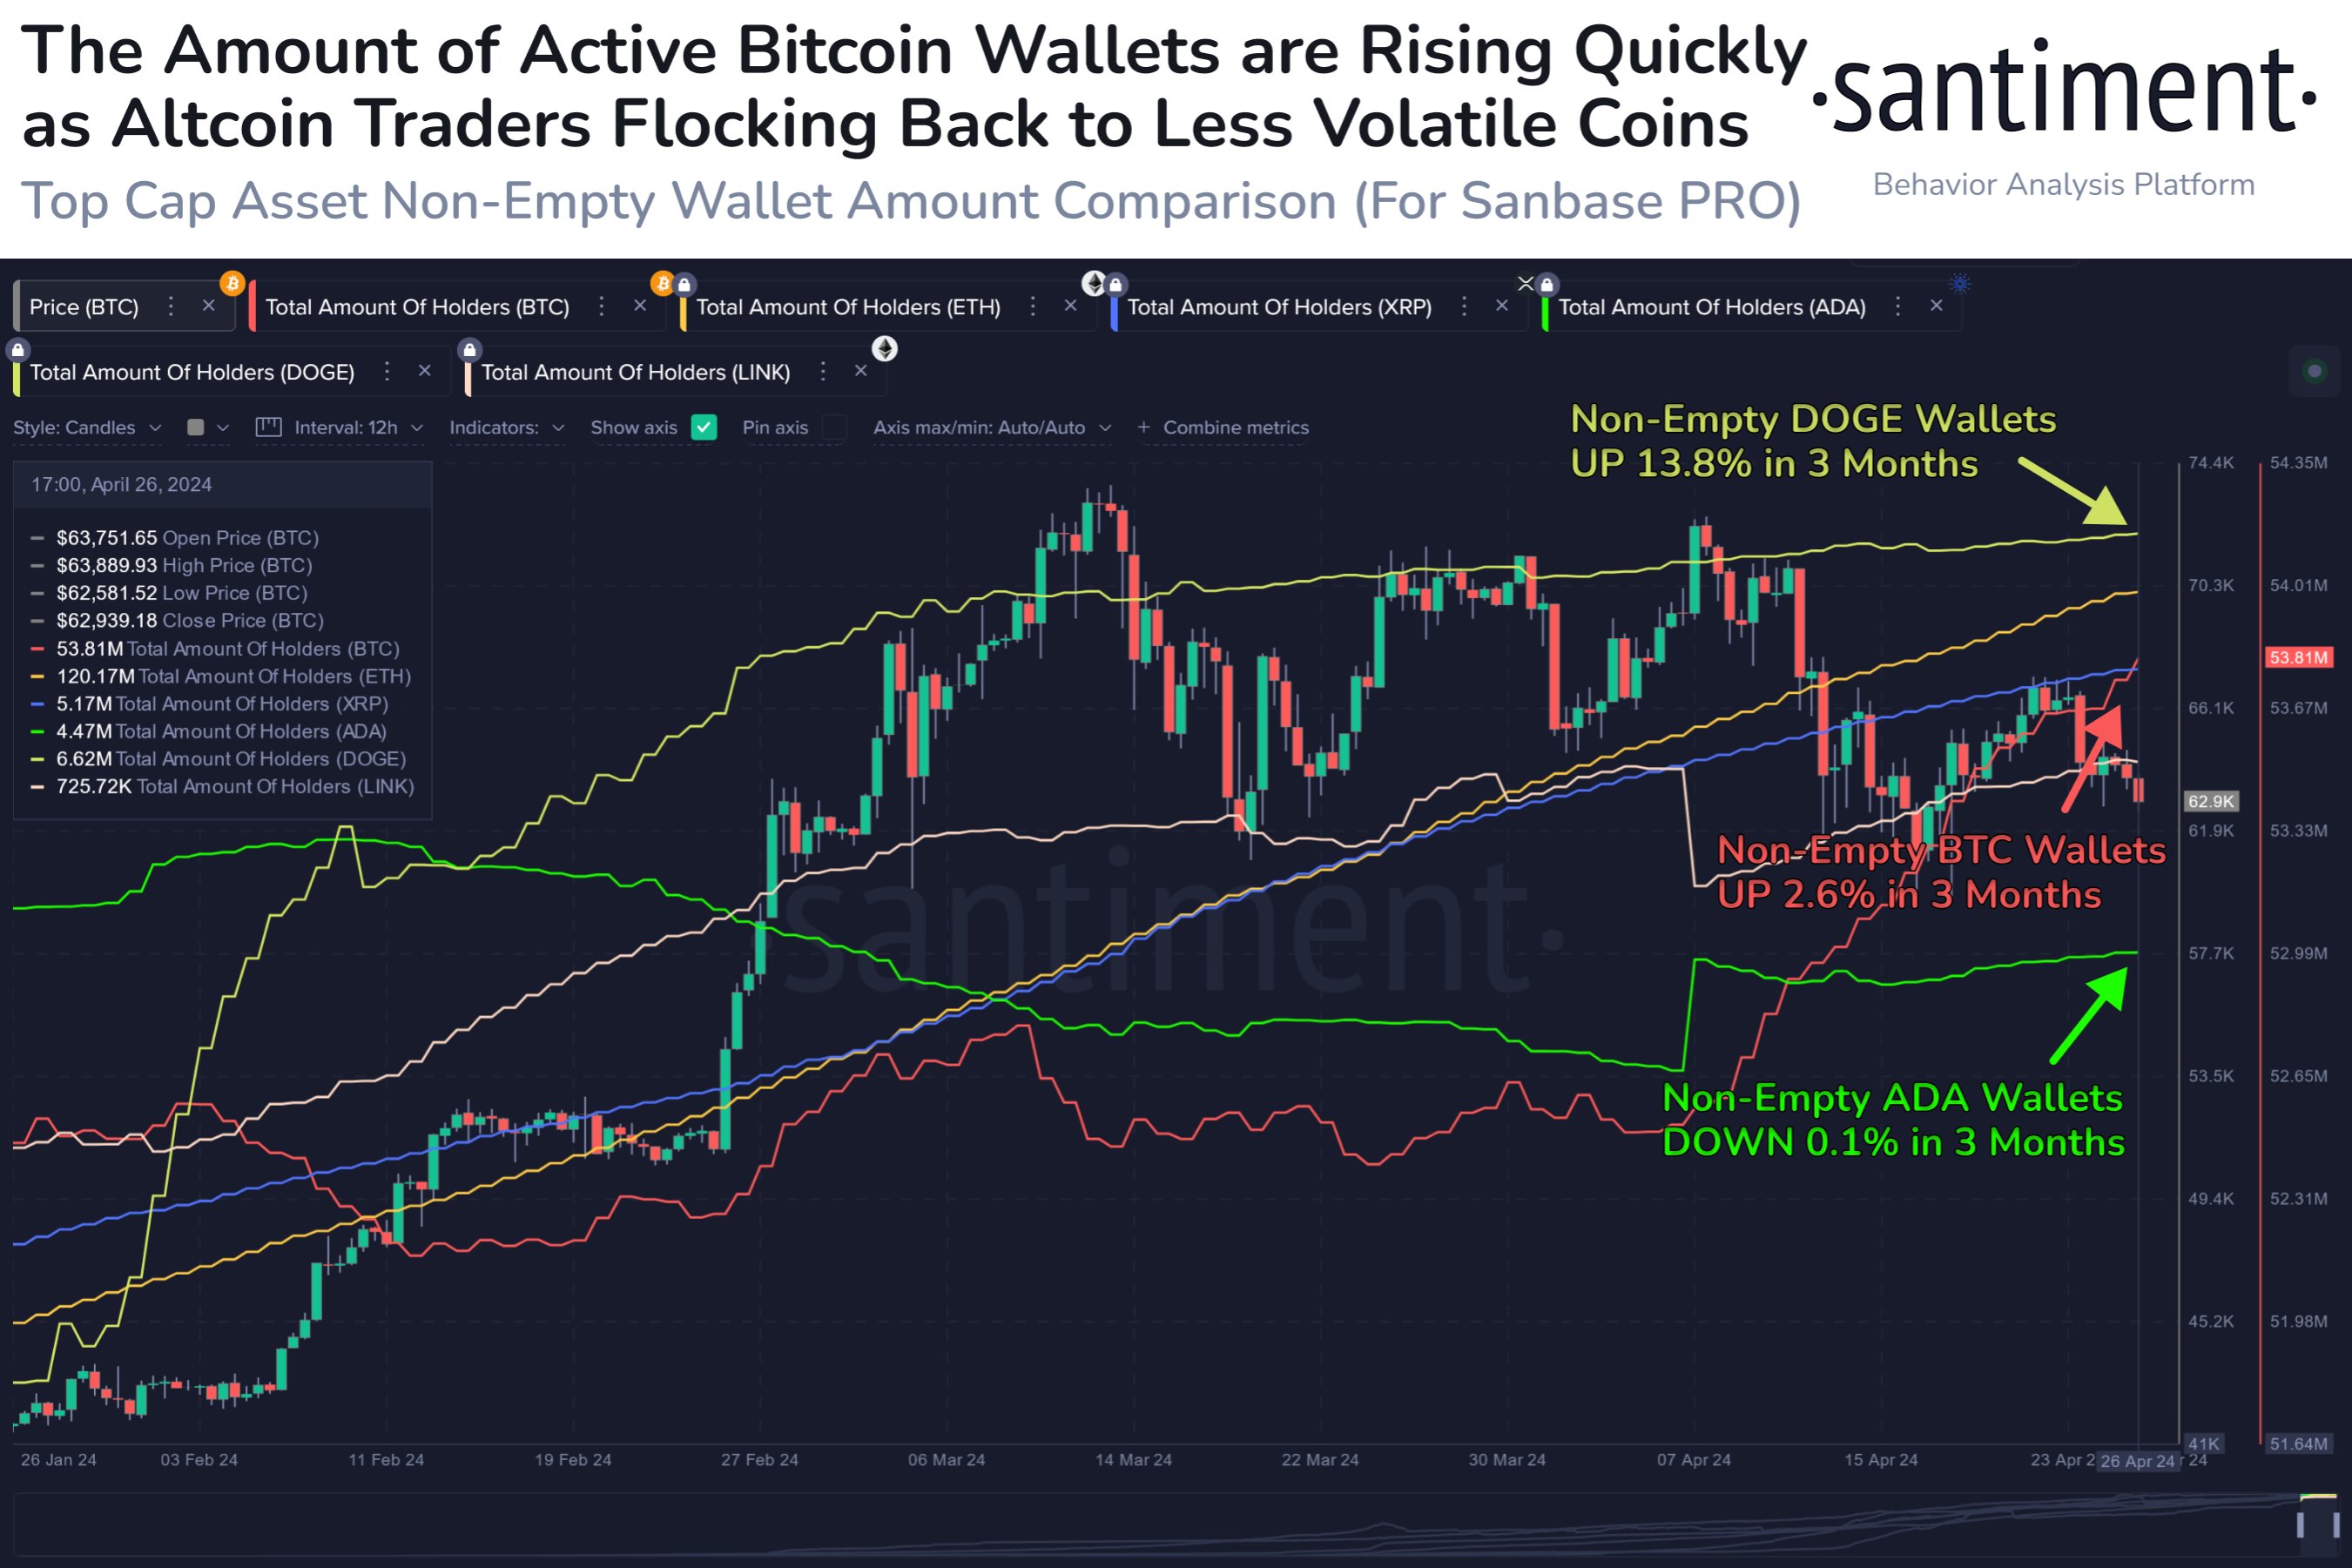
As displayed in the graph, Dogecoin started 2024 with some rapid adoption as its Total Amount of Holders had been observing a sharp uptrend. However, this growth only lasted for the first couple of months, as the metric has since flattened for the memecoin.

Other altcoins like Chainlink and Cardano have also witnessed flat action in the metric in this period. The trend had been just the opposite for Bitcoin, where more or less flat movement had occurred in its number of investors earlier in the year, but the asset has seen some uptrend in the metric this month.

It’s possible that investors were previously attracted to Dogecoin and other networks, but now that markets have been undergoing bearish price action, traders are back to preferring the original cryptocurrency.

Overall, DOGE’s holders are still up 13.8% in the past three months, while BTC’s growth stands at 2.6%. Naturally, the latter’s userbase is also larger, so a relatively small percentage could be due to that.

Cardano is among the few networks in the sector that have observed negative action in the Total Amount of Holders during this window, although the decrease is a mere 0.1%.

BTC Price

Bitcoin has been struggling to make any recovery run count recently, as its price is back at $63,000 after the latest failed attempt.

Bitcoin Price Chart

85% Of Altcoins In “Opportunity Zone,” Santiment Reveals

The on-chain analytics firm Santiment has revealed that over 85% of all altcoins in the sector are currently in the historical “opportunity zone.”

MVRV Would Suggest Most Altcoins Are Ready For A Bounce

In a new post on X, Santiment discussed how the altcoin market looks based on their MVRV ratio model. The “Market Value to Realized Value (MVRV) ratio” is a popular on-chain indicator that compares the market cap of Bitcoin against its realized cap.

The market cap here is the usual total valuation of the asset’s circulating supply based on the current spot price. At the same time, the latter is an on-chain capitalization model that calculates the asset’s value by assuming the “true” value of any coin in circulation is the last price at which it is transferred on the blockchain.

Given that the last transaction of any coin would have likely been the last time it changed hands, the price at its time would act as its current cost basis. As such, the realized cap essentially sums up the cost basis of every token in the circulating supply.

Therefore, one way to view the model is as a measure of the total amount of capital the investors have put into the asset. In contrast, the market cap measures the value holders are carrying.

Since the MVRV ratio compares these two models, its value can tell whether Bitcoin investors hold more or less than their total initial investment.

Historically, when investors have been in high profits, tops have become probable to form, as the risk of profit-taking can spike in such periods. On the other hand, a dominance of losses could lead to bottom formations as selling pressure runs out in the market.

Based on these facts, Santiment has defined an “opportunity” and “danger” zone model for altcoins. The chart below shows how the market currently looks from the perspective of this MVRV model.

Bitcoin MVRV Ratio

Under this model, when the MVRV divergence for any asset on some timeframe is higher than 1, the coin is considered to be inside the bullish opportunity zone. Similarly, if it is less than -1, it suggests it’s in the bearish danger zone.

The chart shows that MVRV divergence for a large part of the market is in the opportunity zone right now. As the analytics firm explains,

Over 85% of assets we track are in a historic opportunity zone when calculating the market value to realized value (MVRV) of wallets’ collective returns over 1-month, 3-month, and 6-month cycles.

Thus, if the model is to go by, now may be the time to go around altcoin shopping.

ETH Price

Ethereum, the largest among the altcoins, has observed a 3% surge over the past week, which has taken its price to $3,150.

BNB Price Chart

Santiment Reveals Best Altcoins Currently In “Opportunity Zone”

The on-chain analytics firm Santiment has revealed the altcoins that have recently surged into the mid-term “opportunity zone.”

These Altcoins May Be More Likely To See Rebounds

In a new post on X, Santiment has discussed what the various altcoins in the market are looking like from the perspective of the MVRV. The “Market Value To Realized Value” (MVRV) refers to an indicator that keeps track of the ratio between the Bitcoin market cap and the realized cap.

The realized cap here is a capitalization model for BTC that measures the total sum of capital that the investors have used to purchase their coins. As such, the MVRV tells us about how the value that the investors are holding right now (the market cap) compares against this initial investment.

Historically, the more profits the investors have held (that is, the higher the market cap has been compared to the realized cap), the more likely tops have been to occur. This is naturally because investors become more likely to give in to the allure of profit-taking the higher their gains get.

On the other hand, cryptocurrencies have been probable to see rebounds when holders’ returns have dropped into the negative territory. In these conditions, there aren’t many profit-takers left, so selling pressure begins to run out.

Based on these facts, Santiment has come up with an “Opportunity & Danger Zone Model” that uses the MVRV’s divergence from the norm on various timeframes to determine if an asset is providing a potential window for selling or buying right now.

Below is the chart shared by the on-chain analytics firm that reveals what this model is saying for altcoins around the sector:

Altcoins MVRV Ratio

From the graph, it’s visible that a lot of coins are still inside the overbought territory, but several altcoins have managed to sneak into the mid-term opportunity zone following the recent market downturn led by Bitcoin’s plunge.

“This zone gets breached when an asset’s 30-day, 90-day, and 365-day average wallet returns are combining to be in negative territory,” explains Santiment. It should be noted, though, that while mid-term returns are red for these coins, they are still not yet inside the buy zone proper.

“In a zero sum game like crypto, projects with minimal returns compared to the rest of the sector have a higher probability of a more efficient rebound for those who are willing to #buythedip on projects traders are in the most pain on,” notes the analytics firm.

According to Santiment, some of the best altcoin candidates who are inside the mid-term opportunity zone include Lido DAO (LDO), Synthetix (SNX), Storj (STORJ), and OMG Network (OMG).

LDO Price

Lido DAO has had a bad time recently as its price has gone down more than 31% over the past week. With these red returns, it’s no wonder that the coin is becoming underbought on the MVRV.

Lido DAO Altcoin Price Chart

Altcoins Shows Buy Signals, Massive Opportunity Beckons: Analyst

As the price of Bitcoin (BTC) continues to demonstrate a major fall in valuation, indicating a gloomy attitude toward the crypto asset, the bulls in the market are hopeful that the market will soon enter another Season for Altcoins.

Altcoins Showing Massive Buying Opportunity 

Bitcoin’s recent dip signaled the beginning of the decline in the cryptocurrency market, causing several altcoins to drop significantly. However, many cryptocurrency analysts believe that the drop in these altcoin prices might serve as an opportunity for future gains since the alt-season is on the horizon.

Popular cryptocurrency expert and trader Michael Van De Poppe has revealed his optimism in the altcoin market, highlighting the significant opportunities of getting into these tokens before the alt-season begins.

According to Michael Van De Poppe, “some altcoins have now dropped by over 40%” in comparison to their past all-time high. As a result, Poppe believes that this is the right time for investors to purchase these digital assets to position themselves for future gains.

Poppe noted he normally invests in these tokens “during bull cycles when they are about 25% to 60% less expensive.” This demonstrates the crypto expert’s confidence in the assets to rally in the coming months.

While pointing out the massive opportunities in the market, Poppe has underscored Arbitrum (ARB) as one of the altcoins investors should watch out for. He believes that ARB could realize substantial gains in time, as the token is down and poised for a new leg UP.

Altcoins

Recently, there have been notable advancements in the crypto asset’s price, demonstrating momentum for an upward movement. As of the time of writing, ARB was trading at $1.70, indicating an over 10% increase in the daily timeframe.

However, in the weekly and monthly timeframe, ARB is down by 22% and 15%, respectively. Meanwhile, Arbitrum’s market capitalization has increased by roughly 10% to exceed the $4.5 billion threshold.

Top ALTs To Purchase After Bitcoin’s Retracement

On-chain analyticS platform Santiment has also highlighted the drop in altcoins as a shot to garner profits in the upcoming months. Santiment pointed out several altcoins that offer a “possible bullish opportunity,” following Bitcoin’s crash today to a two-week low of $61,700.

Some of the tokens listed by Santiment are BOUNCE, LDO, OMG, STORJ, and SNX. The MVRV Opportunity and Danger Zone Model, according to Santiment, shows that many altcoins have now declined to the point where mid-term trading returns are in an “opportunity zone.” However, when an asset’s 30-day, 90-day, and 365-day average wallet returns add up to be negative, “this zone is breached.”

Even with the recent general correction, the altcoins market appears to be headed toward a favorable long-term picture. Consequently, this presents an excellent chance for investors to purchase these digital assets at a reduced cost.

Altcoins

Key Trend Driving Altcoin Market Toward $425 Billion: Analyst

Amid the bullish sentiment around the crypto landscape, the Altcoin overall market cap has displayed positive strength as many investors and traders are throwing capital into several altcoins ahead of the bull cycle. 

Altcoin Market To Rally Toward $425 Billion

Since Bitcoin has surged to a new record high, many cryptocurrency analysts anticipate a surge in the altcoin market cap. Rekt Capital, a cryptocurrency expert and trader, has shared a positive prediction regarding the altcoins market cap with the community on X.

The expert analysis delves into the current state of the market and its potential to surge higher in the coming months. His projections came in light of the altcoin season index showing advancement, which suggests that its season is almost here.

According to the analyst, the market has been “redirected into the blue-circled testing area,” which was caused by rejection from the “red-circled circle zone.” However, the market has rebounded since then, indicating an increased interest from market investors.

Altcoin

Furthermore, Rekt Capital noted that the market has surpassed the “$315 billion red line of resistance.” As a result, the red line resistance level has now been changed to a “new support level.” Due to this, the crypto analyst anticipates a surge to the “light blue circle” at the $425 billion threshold in the upcoming months.

The post read:

The red-circled area rejected the Altcoin Market back into the blue-circled retesting zone. Since then, the Altcoin Market Cap has recovered, broken beyond the red $315bn resistance, and turned recently into new support. Next is the light blue circle, over time.

However, Rekt Capital also asserted in another recent post that the “$315 billion mark is still being retested by alts market cap new support.” It has been unable to move past it despite today’s double-digit declines on several altcoins.

Even though the market is still retesting the aforementioned level, Rekt Capital is confident that it will “revisit the $425 billion resistance” soon. He anticipates the market revisiting the level before the Bitcoin Halving event, expected to take place in April.

Alts Gains Are Sustable And Likely To Crash

Chief Executive Officer (CEO) of Bitcoin technology firm JAN3, Samson Mow, has also shared his insights regarding the altcoin market. Despite anticipating a rise in the altcoin market, Mow highlighted that he expects alts to “crash in the upcoming weeks.” 

According to Mow, alts have been monitoring the “increase in Bitcoin” after launching BTC Spot Exchange-Traded Funds (ETFs). However, altcoins do not possess “the $500 million to $1 billion” daily inflows seen with Bitcoin.

Consequently, this should be the “major sign” that their gains “can not” be maintained. “MSTR has a $30 billion market cap, Solana is $73 billion. That is absurd. A correction is overdue,” he added.

Altcoin

These Are The Ethereum Altcoins Witnessing High Whale Interest

Here are the Ethereum-based altcoins that are currently witnessing a high amount of activity from the whales, according to on-chain data.

These Ethereum Altcoins Are Seeing High Whale Transactions Right Now

In a new post on X, the on-chain analytics firm Santiment has discussed how several Ethereum-based altcoins have been seeing notable whale activity recently.

The indicator of relevance here is the “whale transaction count,” which keeps track of the total number of transfers taking place on the network for a given cryptocurrency that is valued at $100,000 or more.

Generally, only the whales are capable of moving such large amounts in single transactions, so transfers carrying this much value are assumed to involve these humongous entities.

When the value of this metric is high, it means that the whales are making a large amount of moves on the network right now. Such a trend implies these large investors have a high interest in the asset currently.

On the other hand, low values suggest the cryptocurrency may have a lack of whale interest behind it, as there are barely any large transactions occurring on the chain.

Now, here is a chart that shows the trend in the whale transaction count for a few different Ethereum-based altcoins over the past few months:

Ethereum Whale Transaction Count

As displayed in the above graph, the whale transaction count has recently seen a sharp surge for these five altcoins: Fantom (FTM), Fetch.ai (FET), Render (RNDR), 0x Protocol (ZRX), and Reserve Rights (RSR).

“Ethereum’s market value is up to $3,920 and the #2 cap ranked market price ratio vs. Bitcoin is +9.5% in the past 3 days,” Santiment notes. “When these kinds of price dominance flips occur, we often see profits quickly redistribute, and whales becoming very active in ERC20-based altcoins.”

The alts in question here have all recently registered at least three-month highs in their whale activity. From the chart, it’s visible that Fetch.ai has observed the largest spike out of these assets.

Render leads in second place, while Fantom has followed after it in third. The prices of all three of these altcoins have registered rapid increases, with FTM coming out as the winner so far, with more than 67% in profits over the past week.

Thus, it would appear that the recent whale activity likely corresponded to buying pressure in these alts. It should be noted, however, that even if the whale transaction count remains high in the near future, it doesn’t necessarily have to lead to a bullish outcome.

The indicator merely counts the number of all whale-sized transactions and doesn’t contain any information about whether they are being made for buying or selling.

All that the whale transaction count can say about these altcoins is that, should whale activity remain high, their prices would be probable to witness volatile action, but its direction could go either way.

ETH Price

Ethereum has managed to outperform Bitcoin in the past week, as the second-largest coin has seen an increase of around 15% that has now taken its price beyond the $3,900 level.

Ethereum Price Chart

Is Altcoin Season On? Here’s What Glassnode Data Says

Here’s what the “Altseason Indicator” from the on-chain analytics firm Glassnode says regarding if an Altcoin season is currently going on or not.

What Altseason Indicator Says Regarding The Altcoin Season

In its latest weekly report, Glassnode has discussed what the Altcoin season status for the cryptocurrency market has looked like recently. To check whether the “altseason” is on, the analytics firm has devised its Altseason Indicator.

This metric judges if the investors are in a risk-on mode based on how capital rotations are occurring in the sector. There are two conditions the indicator checks for.

First, the Altseason Indicator looks at the capital netflows involving the three major asset classes in the sector: Bitcoin (BTC), Ethereum (ETH), and stablecoins.

For the former two assets, netflows are gauged using their “realized caps.” The realized cap is a capitalization model that calculates any asset’s total valuation by assuming that the real value of any token in circulation is the price at which it was last moved rather than the current spot price.

The last transfer for any coin was likely the last point at which it changed hands, so the price at the time of that transaction would be its current cost basis. As such, the realized cap sums up the cost basis of every holder in the sector.

Put another way, the realized cap measures the actual amount of capital the investors have put into the asset. Thus, changes in the metric would reflect the amount of capital flowing into or out of the asset.

For the stablecoins, net flows can be judged based on the supply or market cap alone, as the stables’ value remains tied to $1 at every point, so the magnitude of the market cap and realizes cap would be equal (both of these would also equal the supply, except for the unit).

For the Altcoin Season to be active, all three asset classes should have positive netflows. This is because capital generally enters the cryptocurrency sector through these coins and only then rotates into altcoins as investors’ appetite for risk rises.

The other condition the Altseason Indicator checks for is the momentum in the altcoin market cap itself. In particular, the metric confirms whether or not the altcoin market cap is currently over its 30-day simple moving average (SMA).

Altcoin Season Indicator

The chart shows that the Altseason Indicator first started flashing the risk-on signal in October of last year. However, the signal turned off when the market cooled off following the launch of the Bitcoin spot ETFs.

After staying off for 22 days this month, though, the Altseason Indicator seems to have been saying that the Altcoin season is back on.

BTC Price

At the time of writing, Bitcoin is trading around the $50,900 level, down 1% in the past week.

Bitcoin Price Chart

These Are The Altcoins Drawing Whale Interest, Santiment Reveals

The on-chain analytics firm Santiment has revealed some altcoins currently witnessing high interest from the whales.

Whale Transactions Have Spiked For These Altcoins Recently

In a new post on X, Santiment has discussed how several altcoins have been showing interest from the whales. The on-chain indicator of relevance here is the “Whale Transaction Count,” which keeps track of the total number of transfers carrying a value of at least $100,000 taking place every day on the blockchain for any given cryptocurrency.

Such large transfers are generally assumed to be coming from the whale entities, as they can only move around amounts this large with single transactions.

When the metric’s value is high, the whales make many transfers. This trend implies that these humongous investors are highly interested in trading around the asset in question.

On the other hand, the low indicator suggests the whales may not be paying attention to the cryptocurrency as they aren’t making that many moves on the network.

Now, here is the chart shared by the analytics firm that shows the trend in the Whale Transaction Count for some altcoins over the past month:

Altcoins Whale Transaction Count

As displayed in the above graph, these five altcoins have all seen some boost in their Whale Transaction Counts recently: Injective (INJ), Rocket Pool (RPL), PlayDapp (PLA), STP (STPT), and Basic Attention Token (BAT).

Given this close surge in the indicator for all of these assets, it would appear possible that the whales have now started playing around with alts after gaining confidence from the sharp rally that Bitcoin has enjoyed.

Now, what does this fresh whale interest mean for these altcoins? Usually, a high value of the Whale Transaction count is a predictor of volatility for any cryptocurrency.

This is because the whales’ transfers carry a significant value. Of course, any single transaction will likely not be big enough to move the market appreciably on its own, but if many such transfers occur at once, the asset could feel some turbulence.

However, any such volatility that may arise out of this high whale trading activity can theoretically go in either direction. The Whale Transaction Count only measures the pure number of large transfers happening on the network and doesn’t provide any information about whether these are buying or selling moves.

As such, the only thing that can be said about these altcoins observing high interest from these humongous holders is that they are now more likely to display some volatility, the direction of which is uncertain.

INJ Price

The 31st-placed coin in the market cap list, Injective, is trading around $35 after going up more than 4% in the past week.

Injective Altcoins Price Chart

These Altcoins Are Showing Most Bullish & Bearish Divergences: Santiment

The analytics firm Santiment has revealed the list of altcoins that are showing the greatest bullish and bearish divergences currently.

RSI Reveals These Altcoins To Contain The Most Extreme Values Right Now

In a new post on X, Santiment has discussed some altcoins that are showing overvalued or undervalued conditions based on the Relative Strength Index (RSI) currently.

The RSI refers to a momentum metric in technical analysis that tracks the speed and magnitude of recent changes happening in the price of any given asset. This measurement can be made over any period, but in the context of the current topic, the 1-day RSI is of relevance.

Generally, a high value of this indicator can be a sign that the asset is overheated right now and may be at risk of forming a top. More specifically, the 70 mark is chosen as the cutoff for when the probability of a bearish reversal becomes significant.

On the other hand, the RSI being 30 or lower can imply the price is under its fair value at the moment, and as such, a potential reversal to the upside could be brewing for the asset.

Now, here is the chart shared by the analytics firm that shows the trend in the 1-day RSI for a few different altcoins from the top 150 market cap list over the past year:

Altcoins RSI

As displayed in the above graph, the 1-day RSI has been at high levels for Maker (MKR), Venus (vBNB), and Sei (SEI) recently. To be more specific, the metric has a value of 74.6, 72.4, and 75 for vBNB, SEI, and MKR, respectively.

Clearly, these RSI levels are in the zone typically associated with an overheated market. Maker has recently enjoyed a sharp rally, observing gains of over 30% during the past couple of weeks. If this metric is anything to go by, though, the asset’s strong run may be approaching an end.

On the other end of the spectrum are the altcoins Elrond (ELGD), Arweave (AR), and Bonk (BONK), which are observing low levels of 1-day RSI. ELGD and AR are inside the underpriced zone with the metric sitting at 22.6 and 29, while the Solana-based memecoin BONK is floating just over the area with a value of 31.

According to Santiment, all six of these coins have also separated from the rest of the altcoins cohort, implying a bearish/bullish (depending on whether overvalued or undervalued) divergence could be forming for them.

As such, coins like BONK observing a bullish divergence may be likely to see some price rise, so that they can catch up with the other alts. Similarly, MKR and others may see a correction to be more in line with the rest of the market.

BONK Price

Bonk has had a bad time these last few weeks, as its price has been following an overall downward trajectory. The coin may finally be starting to turn itself around, however, as its price has shot up over 22% in the past 24 hours.

Bonk Price Chart

Santiment Breaks Down “Most Trending” Altcoins Of Past Week

Here are the various altcoins that Santiment has identified to have been the most trending cryptocurrencies of the past week.

Altcoins Like BONK Or SOL Saw Most Traction In Past Week

In a new insight post, the on-chain analytics firm Santiment has discussed about some alts that have taken focus during the last week. Based on social media data, Santiment determines tokens to be “trending” if they have been receiving significant attention in the past 24 hours.

The below chart shows the top altcoins for each day in the past week on the basis of this metric:

BONK, Solana Trending

From the graph, it’s visible that the Solana-based meme coin BONK has pretty much observed the highest amount of traction on social media platforms during this period.

The main reason behind the dog-themed coin being so trendy has been its listings on the two largest cryptocurrency exchanges in the sector, Coinbase and Binance.

Injective Protocol (INJ) has been another asset that has consistently appeared on the Trending Tokens list. Santiment explains that the source of the altcoin’s popularity lies in its rally and hype for an upcoming airdrop.

Solana (SOL), the sixth-largest cryptocurrency by market cap, has also been discussed by social media users. “Between December 11 and 17, SOL climbed the ranks, attributed to several high-profile projects and partnerships,” notes the analytics firm.

“The ecosystem’s growth and its challenge to Ethereum’s dominance in Web3 were hot topics among traders and enthusiasts,” adds Santiment. Solana has also enjoyed some sharp uptrend in the past day, as the asset has shot up around 11% during the period.

Unsurprisingly, Internet Computer (ICP) has also gained steam during the last week, as the asset has surged more than 73%. Since its high above $11.5, though, the altcoin has registered some significant decline, as it’s now trading around $9.75.

“In summary, this week spotlighted the power of market catalysts — from exchange listings to pivotal updates — and their profound impact on project sentiments and trading activities,” says the analytics firm.

BONK’s Exchange Listing Hype Has Observed Some Cooldown

Soon after the meme coin received its listings on the aforementioned platforms, the BONK price shot up towards a new all-time high north of the $0.0000349 level. This extraordinary surge proved to be unsustainable, however, as profit-taking quickly ramped up and the altcoin fell back down.

BONK has since registered a very significant drop to the $0.0000206 mark. Here is a chart that shows how the meme coin’s performance has looked like in the past month:

BONK Price Chart

Despite this drawdown of 41% from the top, though, BONK is still up more than 56% in the past week, which is an impressive return nonetheless. Overall in the past month, the meme coin is carrying profits of 617%, showcasing just how strong the coin’s recent rise has been.

XRP, BNB Among Altcoins Losing Correlation With Bitcoin: Data

Data shows altcoins have been losing correlation with Bitcoin recently, and among them, XRP and BNB have seen particularly pronounced decoupling.

XRP & BNB Have Seen Largest Drops In 60-Day Correlation To Bitcoin

As pointed out by an analyst in a post on X, BTC has recently seen a drop in correlation with the altcoins. The “correlation” here refers to an indicator that keeps track of how tied the prices of any two assets are right now.

When the value of this metric is positive, it means that the given assets respond to moves in each other’s price by moving in the same direction. The closer the indicator’s value is to 100%, the stronger this correlation is.

On the other hand, negative values imply that there is a negative correlation between the assets, as their prices are moving opposite to each other. In this case, the extreme is -100%, so the more negative the value, the more tight the relationship is.

The 0% mark represents the point where no correlation exists between the prices, implying that movements in one have no bearing on how the other might perform.

Now, here is a chart that shows what the 60-day correlation between Bitcoin’s daily log returns and various altcoins looks like right now, as well as how it compared a year back:

Bitcoin Correlation To XRP

As displayed in the above graph, the 60-day correlation between Bitcoin and XRP appears to have significantly decreased in this period, as it has plunged from nearly 80% to almost 40%. This means that XRP’s price has been moving much more independently of BTC during the past 60 days.

BNB (BNB), Avalanche (AVAX), and Solana (SOL) have also seen some decoupling from the original cryptocurrency. Still, these alts have seen the indicator decline by much less than XRP has observed.

Cardano (ADA) and Dogecoin (DOGE) are the altcoins that have observed the least amount of change. However, in the case of the memecoin the correlation was lesser than the other assets to begin with, so even with the small decoupling, its correlation level is still matching that of BNB.

Generally, correlation is something to watch for whenever an investor is trying to diversify their portfolio, as two assets with significant correlation wouldn’t provide much safety.

Thus, as XRP is currently the cryptocurrency least correlated with Bitcoin on this list, it might be a better diversification option than coins like Ethereum (ETH) or Polygon (MATIC), which have the 60-day value of the indicator at relatively high levels still.

XRP Price

Just a few days back, XRP had revisited the territory above the $0.63 mark, but it wasn’t long before it slipped again and went under the $0.60 level. Since this low, though, the cryptocurrency has seen some recovery, as it has now neared $0.61 once again.

XRP Price Chart

These Are The Altcoins To Keep An Eye On: Santiment

Data from Santiment shows that several altcoins have registered an increase in address activity, which may make them worth keeping an eye on.

Bitcoin Cash & Other Altcoins Have Observed A Rise In Active Addresses

As explained by the on-chain analytics firm Santiment in a new post on X, some alts are seeing rising activity despite the cooldown that the overall cryptocurrency sector has observed in the past couple of days.

The indicator of interest here is the “daily active addresses,” which keeps track of the total number of unique addresses of any given coin that are interacting on the blockchain in some way every day. The metric accounts for both senders and receivers.

By “unique,” what’s meant here is that any address participating in transaction activity on the blockchain is only counted once, regardless of how many transfers it may be involved in.

This restriction helps provide a more accurate representation of the actual activity on the network, as just a few addresses making hundreds of transactions can’t skew the metric by themselves.

When the value of the indicator is high, it means that there are a large number of unique addresses taking part in transaction activity right now. Such a trend implies the blockchain is receiving a high amount of traffic currently.

On the other hand, low values imply not many users are interacting with the network, a possible sign that interest in trading the cryptocurrency is low at the moment.

Now, here is a chart that shows the trend in the daily active addresses for several different altcoins over the past month:

Altcoin Active Addresses

As displayed in the above graph, the daily active addresses indicator has observed a sharp surge in the past couple of days for the altcoins listed here: Bitcoin Cash (BCH), Small Love Potion (SLP), Mask (MASK), LeverFi (LEVER), and Civic (CVC).

According to Santiment, these latest highs in the metric correspond to the highest levels that these cryptocurrencies have witnessed in around three months. Such high activity naturally suggests that there is a lot of interest in these coins among investors right now.

Most of these are small-cap coins, though, but there is one among them that has a very notable standing in the rest of the market: BCH. The 16th-ranked asset in the sector has registered a decline in the last two days, much like the wider sector, but the asset’s active addresses have remained high in number.

Usually, high address activity is a good sign for rallies, as a large amount of active trader pool means that the move has a higher probability of finding the fuel it needs to keep itself going.

Interestingly, besides these altcoins, the largest stablecoin in the sector, Tether (USDT), has also seen the indicator shoot up during this period. Investors use stablecoins for storing their value in a more secure form and for buying into other assets, so the high address activity can potentially be a sign that some moves are taking place in the background.

BCH Price

Bitcoin Cash had earlier surged past the $250 mark, but with the latest drawdown, the altcoin has plunged to $230.

Bitcoin Cash Altcoin Price Chart

Research Firm Reveals Its “Altcoin Trading Playbook”

A research firm has revealed an altcoin trading playbook that could serve as a guide for navigating the next cryptocurrency bull run.

K33 Research Shares Its Altcoin Trading Playbook

In a new post on X, K33 Research (formerly Arcane Research) explained that new altcoins make better trades than old ones. The firm has given a few reasons for why this is so.

“In lack of price-driving fundamentals, the narratives and liquidity matter,” explains the research organization. “And new coins generally outperform old coins.”

K33 Research has used the example of some “Ethereum killers” during the last bull market to show how the newer coins outperform the older ones. The below chart shows how the performance of these coins has been compared (note that the Y-axis, the price, is normalized concerning September 22, 2020, here).

Altcoin Ethereum Killers

From the chart, it’s apparent that Tron (TRX) and EOS (EOS), which were vouched as the Ethereum killers during the 2017/18 bull market, failed to set new all-time highs (ATHs) during the 2021 bull run.

However, the new kids on the block, like Solana (SOL) and Avalanche (AVAX), observed much better returns than the old, established altcoins during the latest bull market.

Why do old altcoins have difficulty returning to their former glory? According to K33 Research, there are a few factors behind this. First, the coins that have gone through a cycle have many holders at a loss, waiting to come into the green to exit.

These underwater investors provide additional selling pressure during rallies that new coins, where everyone is in the green during the initial rally, don’t have to face.

The old coins also have to deal with the rising circulating supply because of the token unlocks, which, due to supply-demand dynamics, can hurt the price if the demand side doesn’t catch up.

Altcoin Example

Finally, the research firm notes that old coins are also tied to narratives that have gone out of fashion. On the other hand, new coins are the narratives when they launch and, thus, appear interesting to investors.

While new altcoins certainly have a leg up to old coins regarding these factors, K33 Research notes that not all such coins make for a good investment. The firm advises investors to look for a few things to know whether a project may be worth investing in.

The first thing could be whether or not the total number of holders is rising rapidly for the altcoin. A high amount of adoption means the asset has more steam behind it for building sustainable moves. The firm also says that a low float and high fully dilated value (FDV) should be avoided.

ETH Price

At the time of writing, Ethereum is trading at around $1,600, up 3% during the past week.

Ethereum Price Chart

Bitcoin Social Media Talk Drops To 3-Month Low, All Eyes On Altcoins?

Data shows the social media talk around Bitcoin has dropped to low levels recently, indicating that investors are paying attention to altcoins instead.

Bitcoin Social Dominance Has Declined To Just 17% Recently

According to data from the on-chain analytics firm Santiment, BTC-related discussions on social media have dropped recently. The relevant indicator here is “social dominance,” based on the concept of “social volume.”

The social volume of any asset is a measure of the degree of talk it receives on the major social media platforms. The metric makes this measurement through a text-based data collection that Santiment has procured from different websites.

A feature of the indicator is that it only counts the unique number of posts or messages that mention the coin. This means that if a thread receives many mentions of the cryptocurrency, its contribution to the social volume will remain just one unit.

This restriction helps the social volume provide a more accurate representation of the trend being observed throughout social media. The aforementioned social dominance is a metric that tells us what percentage of the combined social volume related to the top 100 assets by market cap is being contributed by any cryptocurrency.

Here is a chart that shows how the social dominance of Bitcoin has changed during the last few months:

Bitcoin Social Dominance

As shown in the above graph, Bitcoin’s social dominance has registered a downtrend during the last few days, implying that the share of the social media discussions occupied by the number one cryptocurrency has shrunken.

This is perhaps a result of the asset’s price stagnating recently. Generally, investors don’t find such price action interesting, so they may stop paying attention to the coin during phases like this.

With the latest drop in the indicator, its value has dropped to 17%, meaning that 17% of the discussions related to the top 100 coins currently involve the topic of Bitcoin. This level of social dominance is the lowest it has been since June.

Naturally, this drop suggests that the altcoins have recently attracted some attention. Santiment notes that traders are looking elsewhere to FOMO right now, as some of the smaller projects in the market are observing a surge in talks.

Historically, the holders dropping BTC in favor of alts has been a sign of greed in the market. Such greed, however, is generally not favorable for the sector as a whole, as only weak rallies emerge in periods like these.

BTC Price

Bitcoin is trading around the $26,100 level after having decreased by more than 2% during the past 24 hours.

Bitcoin Price Chart

Altcoins Across The Sector Are Underbought: Santiment

On-chain data from Santiment suggests that altcoins across the entire cryptocurrency sector may be underbought right now.

MVRV Of The Various Altcoins Suggests Underpriced Conditions

According to data from the on-chain analytics firm Santiment, cryptocurrency assets have become underbought as traders are now capitulating following a failed price rebound.

The relevant indicator here is the “MVRV” (Market Value to Realized Value), which measures the ratio between the market cap and the realized cap of a given cryptocurrency.

Here, the “realized cap” refers to a capitalization model for BTC where the value of any coin in the circulating supply is assumed to be not the current spot price, but the price at which it was last transacted on the blockchain.

This model aims to calculate a sort of “fair value” for the asset. As the MVRV compares the market cap (that is, the current price) with the real value of the cryptocurrency, it can provide hints about whether the price is currently overinflated or not.

Santiment has defined an “opportunity” zone and a “danger” zone for this indicator. As their names already imply, the asset in question becomes underpriced when the metric is in the former area, while it becomes overpriced in the latter one.

Here is a chart that shows the trend in the divergence of the MVRV from these zones for the various altcoins in the sector:

Altcoins MVRV

Whenever the MVRV divergence has a value of 1 or more, the indicator is said to be inside the opportunity zone. Similarly, the danger area occurs below a value of -1.

While these are the two extreme zones, the metric being firmly inside either the positive or the negative zone (but not hitting either of these thresholds), still signals slight underbought or overpriced conditions, respectively.

This means that the chances of bullish rebounds can become greater whenever the indicator enters positive territory. From the chart, it’s visible that the vast majority of the coins in the digital asset sector are at least inside the positive territory at the moment.

This would imply that these coins may have become underpriced recently. Some of the altcoins are also outright inside the opportunity zone, suggesting that they may be offering low-risk buying opportunities right now.

There are a few cryptocurrencies, however, that are inside the negative zone, with a couple of them even being inside dangerous territory. Such alts have more chances of registering a decline in the near future.

Recently, the various altcoins have attempted to amass together a rebound, but so far, they have only seen failure. However, now that the prices have started to become undervalued, perhaps a break may be found soon.

BTC Price

At the time of writing, Bitcoin is trading around $26,400, down 1% in the last week.

Bitcoin Price Chart

Altcoin Indexes Outperform Bitcoin, Small Caps Lead Market

Data shows all the altcoin indexes have outperformed Bitcoin during the past month, with the small caps becoming the market leaders.

The Past 30 Days Were Green For Both Bitcoin And Altcoins

According to the latest weekly report from Arcane Research, all indexes record positive returns in the 27-31% range during the past month. The “altcoin indexes” here refer to groups of alts divided based on their market caps. The benefit of creating indexes of cryptos is that it makes it easy to assess the performances of the different segments of the market against each other this way.

There are three main altcoin indexes: the “small caps,” the “mid caps,” and the “large caps.” As is already apparent from their names, each of these covers coins of different sizes.

Now, here is a chart that shows how these three indexes have performed against each other, as well as versus Bitcoin, over the past month:

Altcoins vs Bitcoin

As shown in the above graph, both the altcoins and Bitcoin observed very little price action in the final third of December, as their returns were close to 0%. This trend started to change around a couple of weeks ago, however, as some bullish price action finally returned to the market after what was a full year of mostly bearish movement in 2022.

In the period since then, the entire market has seen a significant uplift, as all the market segments are in some major profits now. The winner during the past 30 days has been the small caps, who are currently sitting at 31% in the green.

An interesting thing to notice is that the small caps suffered the most at the end of 2022 as they capped the year being noticeably more underwater than the other indexes (as can be seen in the chart). This makes them turning it around and outperforming the rest of the market all the more impressive.

Investors of both the large caps and mid caps are in profits of 28% each right now, not too far from the small caps’ performance. Bitcoin has also seen very close positive returns of 27% over the past month, but clearly, the altcoins have managed to outdo the pioneer crypto during this period.

As for Ethereum’s performance in this same period, the asset with the second largest market cap in the sector has observed gains of more than 32% in the past month, meaning that on its own, it has performed better than the indexes.

The report notes that the main reason behind the outperformance by the alts is due to these indexes observing a deeper decline than Bitcoin during the period following the FTX debacle back in November of last year.

BTC Price

At the time of writing, Bitcoin is trading around $21,200, up 21% in the last week.

Bitcoin Price Chart

Altcoin Volume Dominance At Highest Since Jan 2021, Trouble For Bitcoin?

On-chain data shows that altcoin volume dominance is now at the highest level since January 2021, while Bitcoin’s is at its lowest.

Altcoin Dominance By Volume Recently Touched A High Of 64%

As pointed out by an analyst in a CryptoQuant post, Bitcoin’s dominance is just at 16% now. The “dominance by volume” is an indicator that measures the percentage of the total crypto market trading volume that’s being contributed by a specific coin.

When the value of this metric goes up for any crypto, it means that particular crypto is observing a higher amount of activity relative to the rest of the market currently. This suggests that the coin is garnering more interest from investors right now. On the other hand, low values can imply that the crypto is losing mindshare at the moment as its volume percentage is going down.

Now, here is a chart that shows the trend in the dominance by volume for the entire altcoin sector combined (minus Ethereum), as well as for Bitcoin, over the past couple of years:

Altcoin and Bitcoin Dominance

As shown in the above graph, Bitcoin’s dominance by volume has sharply decreased recently and has touched a value of just 16%. This is the lowest value BTC has observed during the last couple of years.

The altcoins (other than Ethereum), on the contrary, have observed their dominance shoot up in the last week or so, as the metric now has a value of 64%. This suggests that BTC has lost its market share to these alts recently.

The quant finds this trend “very concerning,” however. The reason behind that is the fact that whenever rallies have kicked off with altcoins being on top, they haven’t usually lasted for too long, and the prices have quickly come back down.

This can be very clearly seen in the chart. For example, the tops of both the bull rallies of 2021 (the ones in the first and second half of the year) took formation while the altcoins had a higher trading volume dominance than Bitcoin. The latest FTX crash also took place while alts were dominating the market.

It would appear that generally any sustainable and healthy price rallies have only started with the dominance of BTC being higher than these alts. One prominent example is that the July 2021 bottom, which kicked off the second-half bull run of 2021, took place with the Bitcoin volume percentage being higher than altcoins.

The entire market has been rallying in the last week, but if the historical pattern is anything to go by, this uplift may not last too long as the dominance of altcoins is at very high levels right now. This would spell trouble not only for Bitcoin but also for these alts themselves.

BTC Price

At the time of writing, Bitcoin is trading around $17,400, up 3% in the last week.

Bitcoin Price Chart

Altcoin Indexes Take Beating As Investors Flip Alts For Bitcoin

Data shows the different Altcoin Indexes in the crypto market have taken a beating during the past week as investors have been flipping alts for Bitcoin.

Bitcoin And Stablecoins Dominance Rises As Altcoins Struggle

As per the latest weekly report from Arcane Research, the cryptocurrency market has observed a correlated decline recently, but altcoins have taken a more substantial hit. The “Altcoin Indexes” here refer to groups of altcoins divided on the basis of market cap. The most popular indexes include the “large caps,” the “mid caps,” and the “small caps.” As their names already imply, they cover coins from different-sized segments of the sector.

Here is a chart that shows how these market-cap weighted Altcoin Indexes, as well as Bitcoin, have performed during the last month:

Altcoin Indexes Vs Bitcoin

As you can see in the above graph, the cryptocurrency market has shown a strong inner correlation recently, as the altcoins have mostly maintained a close rhythm with Bitcoin during the last 30 days. This correlation was especially apparent in the selloff during the past week, as all the Altcoin Indexes sharply fell in tandem with BTC.

Following this latest decline, the large-cap index is 2% underwater for the month, while BTC is still slightly in the green during this period. Both the mid-caps and the small caps have taken on large losses, as their returns in the last 30 days stand at -7% and -9%, respectively.

This disparity in the performance between the altcoins and Bitcoin suggests that investors have been rotating their investments from the risky alts, back into a relatively-safer option in BTC. It would also appear that the largest altcoins still saw some interest from holders, as their returns haven’t been too far off from BTC.

The data for the “dominance,” a metric that keeps track of the percentages of the total crypto market cap currently being contributed by the various coins, shows that the combined share of Bitcoin and stablecoins has gone up recently:

Bitcoin + Stablecoins Dominance

This 1.2% growth in the combined dominance of these two sectors provides further evidence that investors have been preferring to move out of alts lately.

BTC Price

At the time of writing, Bitcoin is trading around $16,800, down 5% in the last week.

Bitcoin Price Chart

Recovery Market Sentiment Sees Investors Take More Risk With Altcoins

Crypto investors had been moving out of altcoins through the market downtrend due to the high volatility that rocked these digital assets. As a result, the fall in these altcoins was more brutal than that recorded in bitcoin. However, as the tide has begun to turn and the market is looking towards more of a bullish trend, these altcoins have taken their place at the top of the recovering chain, prompting investors to rush back into them.

Altcoins Provide More Gains

Over time, it has been shown that altcoins record the widest movements during any type of market. So just as they have a high propensity to bring large losses, they also carry the same trait when it comes time to make a profit. The same is the case this time around,Al as investors have clamored to altcoins to take advantage of the gains.

Barely two weeks into the month of August, altcoins have quickly taken the lead when it comes to gains. The Small Cap Index, which had suffered massively during the downtrend, is finally having its day in the sun. It saw the largest gains in the last 10 days, coming out at 9% for this period of time.

The Mid Cap Index follows the Small Cap Index in this regard. Although it did not see as many gains as its smaller counterpart, it saw 7% gains for the time period. It also spread to the Large Cap Index, which saw 5% gains in the same time period.

Small Cap Index sees largest gains | Source: Arcane Research

These gains show that investors are beginning to recover their faith in the market once more. Exposure to altcoins is growing rapidly, leading to a surge in prices across these indexes.

Bitcoin Follows Positive Trend

Altcoins were not the only ones that saw positive growth in the first week of August. The positive sentiment through the market has been widespread and has affected various digital assets, albeit to different degrees.

Bitcoin has seen lesser gains compared to its altcoin competitors, but it saw gains nonetheless. It came out as the index with the lowest returns so far, with only 2%. Despite this growth, the digital asset is still severely underperforming compared to altcoins. It is notable in the market dominance of the digital asset, which has fallen about 7% in the last two months alone.

Market cap rests above $1.1 trillion | Source: Crypto Total Market Cap on TradingView.com

What this shows is that investors are now moving out from the safe haven that bitcoin provided during the market crash and are now focusing on altcoins. This has also spread to stablecoins that have also seen their market dominance eaten into by altcoins.

In the last week alone, ETH dominance grew 0.89%, while Bitcoin and the leading stablecoins all lost between 0.12% to 0.96% dominance. This new hunger for risk can either be primarily rewarded, or investors may find themselves burned if the market were to retrace.

Featured image from Binance, charts from Arcane Research and TradingView.com

Follow Best Owie on Twitter for market insights, updates, and the occasional funny tweet…

The Year Of Alt Season: Altcoins Dominate Market In 2021

Bitcoin has had a favorable year in 2021 but the altcoins have dominated the market. The advent of the alt seasons this year had seen multiple altcoins rally towards new highs even when market-mover bitcoin had remained stagnant at times. This move, coupled with the growth and adoption that rocked the crypto space this year, has proven that the altcoins dominated the market on a large scale.

Altcoins Rule 2021

So many new things came out of the altcoin industry this year and have found success at the same time. Basically, the year 2021 has been one long alt season when we look at the performance of some of these assets.

Related Reading | The Year In Review: An Emotional Rollercoaster For Crypto Investors

A lot of this growth has been driven by decentralized finance (DeFi), NFTs, and most recently, the metaverse gaining popularity among investors. These have brought to the forefront some interesting projects that have had their tokens rally because of it. Most of the time, they followed the growth of bitcoin. While at other times, these assets broke free and rallied on their own accord.

Altcoins market cap at $1.32 trillion | Source: Altcoins Total Market Cap on TradingView.com

This has led to bitcoin losing a significant portion of its market dominance to altcoins. Starting the year out at about 75% of total market dominance, it has now fallen to 38% where altcoins have continuously eaten into the pioneer cryptocurrency’s market share. Ethereum was, as always, leading this charge as it took the largest chunk of the market share.

Memecoins also found favor in the market this year. Coins like Dogecoin and Shiba Inu grew into the thousand and million percentile, as well as “ETH killers” also making a play in the market.

Mid-Caps Take The Lead

Altcoins always showed out in the indexes with triple-digit gains for the year. Bitcoin which had a tremendous run of it this year still recorded the lowest gains being the only index that returned double-digit gains. All other indexes, the small, mid, and large cap indexes enjoyed the majority of the gains.

Related Reading | Bullish Signal? Ethereum Market Dominance Sitting Above 20%

Bitcoin’s returns for the year only came out to 73%. While this is still vastly ahead of top investment vehicles like gold, the S&P, and NASDAQ, it still performed poorly in comparison to the other indexes.

Mid Cap Index records highest returns of 2021 | Source: Arcane Research

The Large Cap Index saw the second-lowest returns with 179%, but even it saw returns over 100% higher than that of bitcoin. The Small Cap Index made a splash with returns reaching as high as 485% for the year.

Finally, the Mid Cap Index came out as the winner for 2021 marking returns of 830%. This index consists mostly of Layer 1 tokens which had seen some of the most gains for the year, outperforming even ethereum despite its massive 485% returns for the year.

Featured image from Investment U, charts from Arcane Research and TradingView.com