Cathie Wood Calls Bitcoin a ‘Financial Super Highway,’ Reiterates $1.5M Price Target
The Ark Invest CEO said the firm has been looking closely at emerging markets, where use cases of the digital asset make her believe that bitcoin is partly a risk-off asset.
Ethereum ETF: Franklin Templeton Enters The Fray As ETH Rallies
Wall Street titan and Asset manager Franklin Templeton has applied for an Ethereum Spot Exchange-Traded Funds (ETF) after a struggle to gain approval for their Bitcoin Spot ETF in early January.
Asset Manager Files For Spot Ethereum ETF
Asset managers have gravitated toward the Ethereum spot ETF since the United States Securities and Exchange Commission (SEC) approved the Spot Bitcoin ETF. Franklin Templeton is the latest manager to apply with the SEC to get approval for this financial product.
The asset manager’s move came after successfully introducing the BTC spot ETFs. This is a notable step toward making more crypto investment products accessible to institutional and individual investors.
James Seyffart, a senior analyst from Bloomberg Intelligence, also shared the update with the crypto community on X (formerly Twitter). Seyffart’s X post included a screenshot of the asset manager’s filing and data regarding other applicants.
According to the post, Franklin Templeton is the eighth company in the cryptocurrency market to file for product approval. Previous asset managers to file applications for Ethereum ETFs include Hashdex, BlackRock, Fidelity, Ark and 21Shares, Grayscale, VanEck, Invesco, and Galaxy.
Per the official filing, a Delaware statutory trust is how the Franklin Ethereum Trust is set up. The ETF aims to give investors access to ETH in a regulated manner by allowing them to store it directly through a custodian.
It states in the company’s S-1 filing that the proposed “Franklin Ethereum Trust” will hold ETH and “may, from time to time, stake a portion of the fund’s assets through one of the more trusted staking providers.”
Staking is the act of locking up digital currency to maintain the operations of a blockchain network. They plan to stake some of the ETF’s ETH holdings to supplement its income through staking rewards.
The Price Of ETH Rallies Amidst The Update
Franklin Templeton’s spot Ethereum ETF application was made in light of the price of ETH experiencing an uptick. However, no solid proof exists that the latest development impacted the price of crypto assets.
Related Reading: Ethereum ETFs Approval Date Set For May 23, Forecasts Suggest ETH Could Reach $4,000
Ethereum was trading at $2,661 as of press time, indicating an increase of over 7% in the past 24 hours. Data from CoinMarketCap shows that its market capitalization is also on the upside, marking an increase of over 7%.
Meanwhile, its trading volume has increased significantly by over 172% in the past day. Due to the rise, ETH now ranks third in the entire crypto market by trading volume.
Ether Tops $2.4K as Cathie Wood’s Ark, 21Shares Amend Spot ETH ETF Filing
The updated S-1 document brings the spot Ethereum ETF application more “in line” with the recently approved spot BTC ETF prospectus, one analyst noted.
ARK Continues to Shuffle Out of BITO, Buys $15M of its Own ETF
Cathie Wood’s investment fund continues to double down on its recently listed spot bitcoin ETF.
BlackRock, Other Potential Bitcoin ETF Providers Reveal Fees
BlackRock said its fee will start at 0.20%, rising to 0.30%.
ARK Invest files for Bitcoin ETF registration alongside industry peers

The SEC has until Jan. 10 to rule on the ARK 21Shares Bitcoin ETF application.
ARK Sells $28M Grayscale Bitcoin Trust Shares as Bitcoin Nears $43K
ARK Invest offloaded $13M worth of GBTC shares last week.
Cathie Wood’s ARK Sells Grayscale Bitcoin Trust Holdings, Coinbase for Second Day
Cathie Wood’s fund is continuing to sell crypto-related stocks as the market hits a high not seen since early 2022.
ARK’s amended spot Bitcoin ETF filing is a ‘good sign’ of future approval

ARK Invest and 21Shares amended spot Bitcoin ETF filing seemingly addresses earlier concerns highlighted by the SEC, which is a good sign of progress, according to Bloomberg’s ETF analysts.
Persistent macro headwinds could delay Bitcoin bull market — ARK Invest

Several macroeconomic indicators suggest that bearish headwinds could strengthen during the remainder of 2023 and possibly negatively impact the crypto market.
Is Bitcoin A Buy Or Sell? Ark Invest Shares Market Analysis
In its new monthly report titled “The Bitcoin Monthly: Bitcoin Battles Resistance Around Its On-Chain Mean”, Ark Invest has provided an exhaustive analysis of the current market landscape. The report categorizes its findings into bullish, neutral, and bearish perspectives, providing a holistic view of Bitcoin’s current and potential future stance.
Bullish Arguments For Bitcoin
Grayscale Spot ETF and GBTC’s Discount To NAV: On August 29, a pivotal decision was made by a US Federal Appeals Court. They ruled that the U.S. Securities and Exchange Commission (SEC) must revisit and reconsider its earlier rejection of the Grayscale Bitcoin Trust’s (GBTC) application to transition into a spot ETF. This legal development saw GBTC’s discount to NAV shift from -24% to -18% on the same day, indicating heightened market optimism. By the end of August, GBTC was at a discount-to-NAV of -20.6%.
Bitcoin’s General Cost Basis Recovery: Bitcoin’s realized capitalization, which encompasses both its primary (miners) and secondary (investors) markets, is a measure of the aggregate cost basis of BTC. Between Q4 2022 and Q1 2023, the realized cap drawdown stood at -19%, marking its steepest since 2012. This drawdown serves as a barometer for capital outflows from the network.
Ark’s analysis suggests that the deeper the drawdown, the higher the likelihood of Bitcoin holders exiting the market, potentially setting the stage for a more robust bull market. The realized cap has improved from its all-time high in 2021, moving from a 19% low post the FTX collapse in November 2022 to 15.6%, indicating capital inflows over the past 8 months.
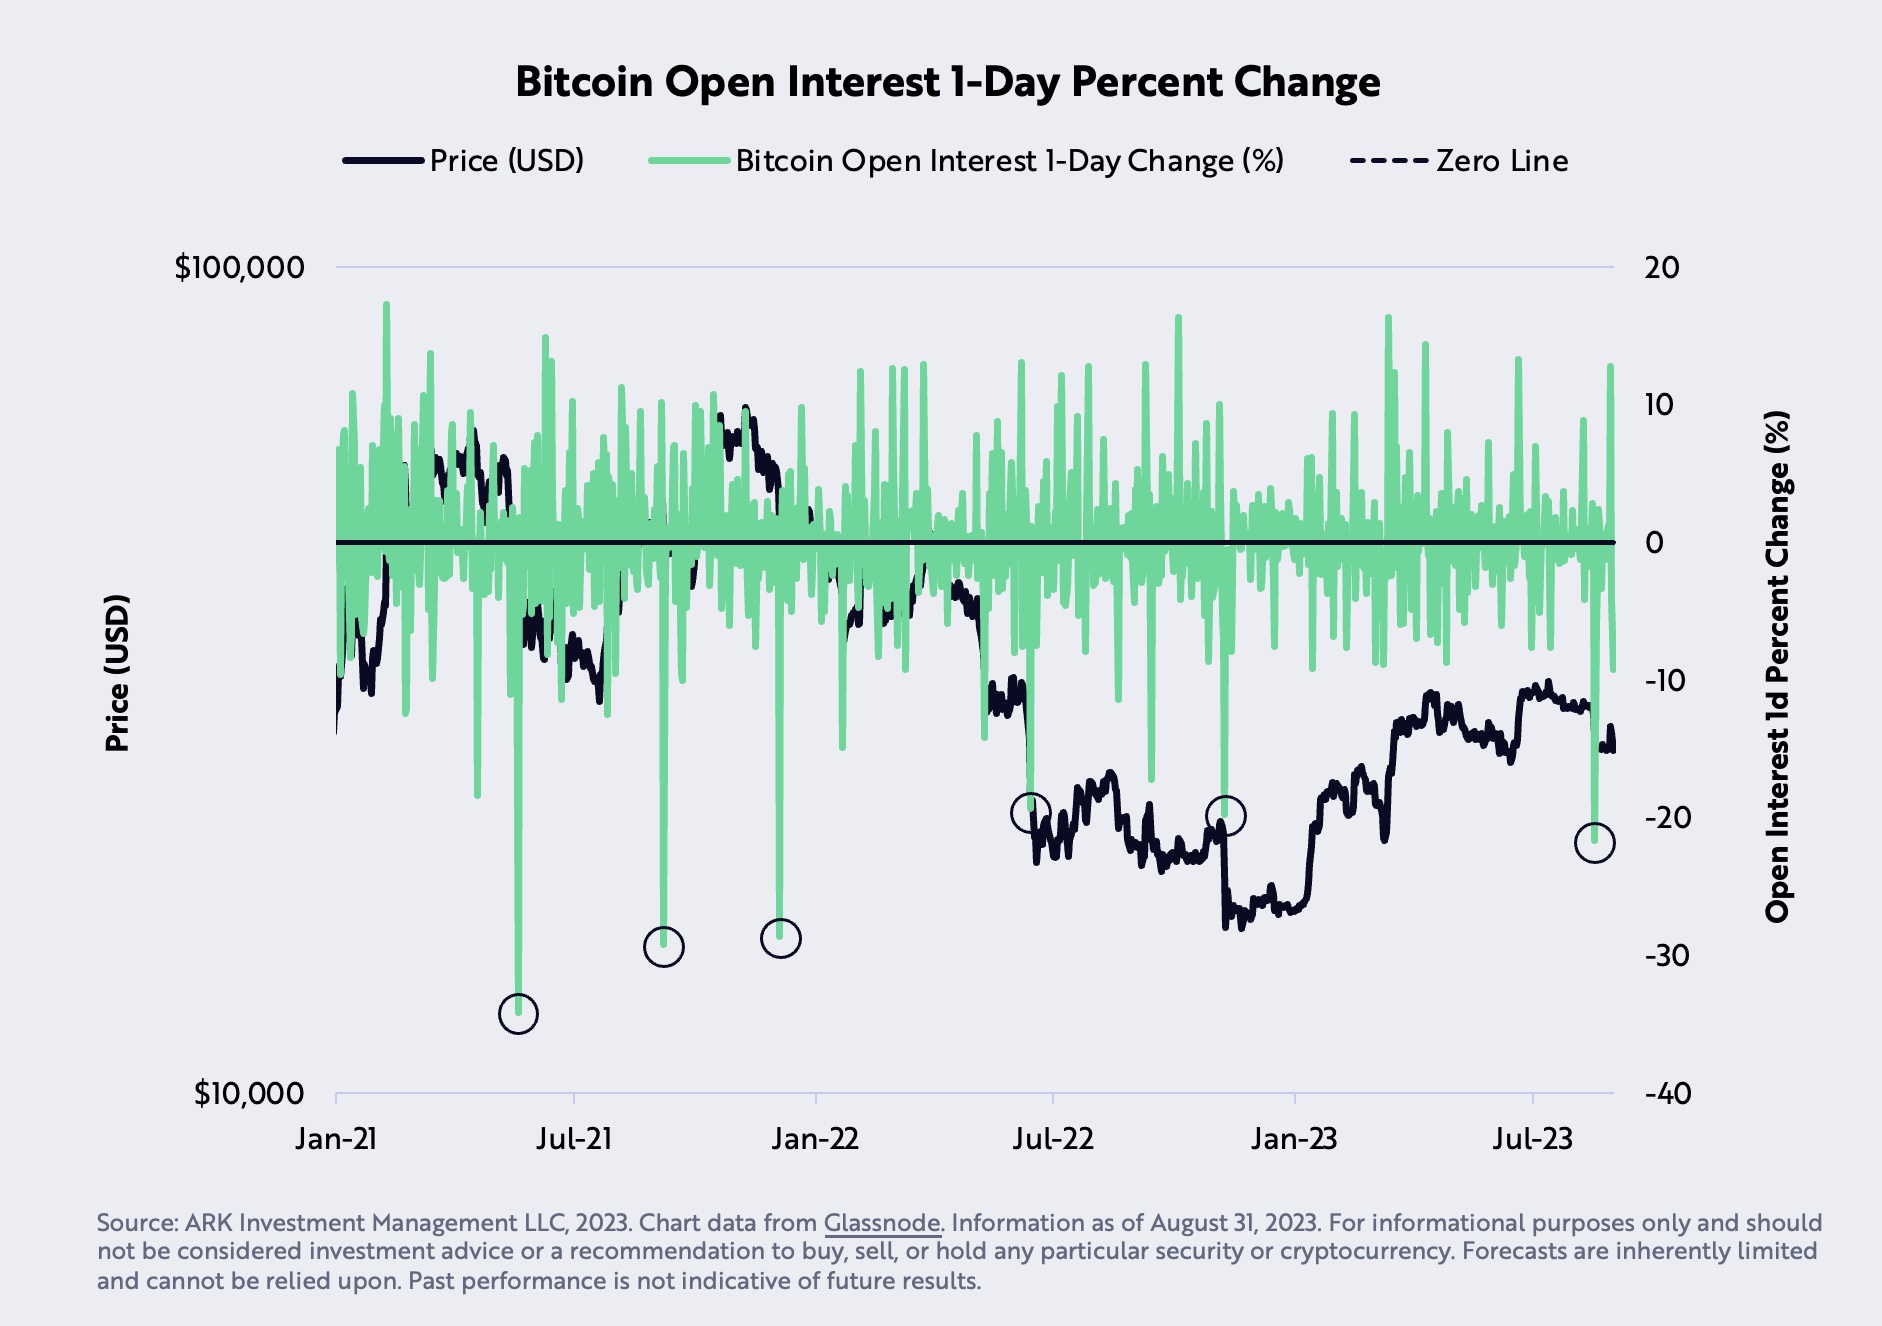
Futures Open Interest Collapse: August 17 witnessed a rapid liquidation of Bitcoin futures by 21.7%, the swiftest since December 2021. Ark Invest interprets this price correction as a “cathartic sentiment correction.”
Neutral Arguments
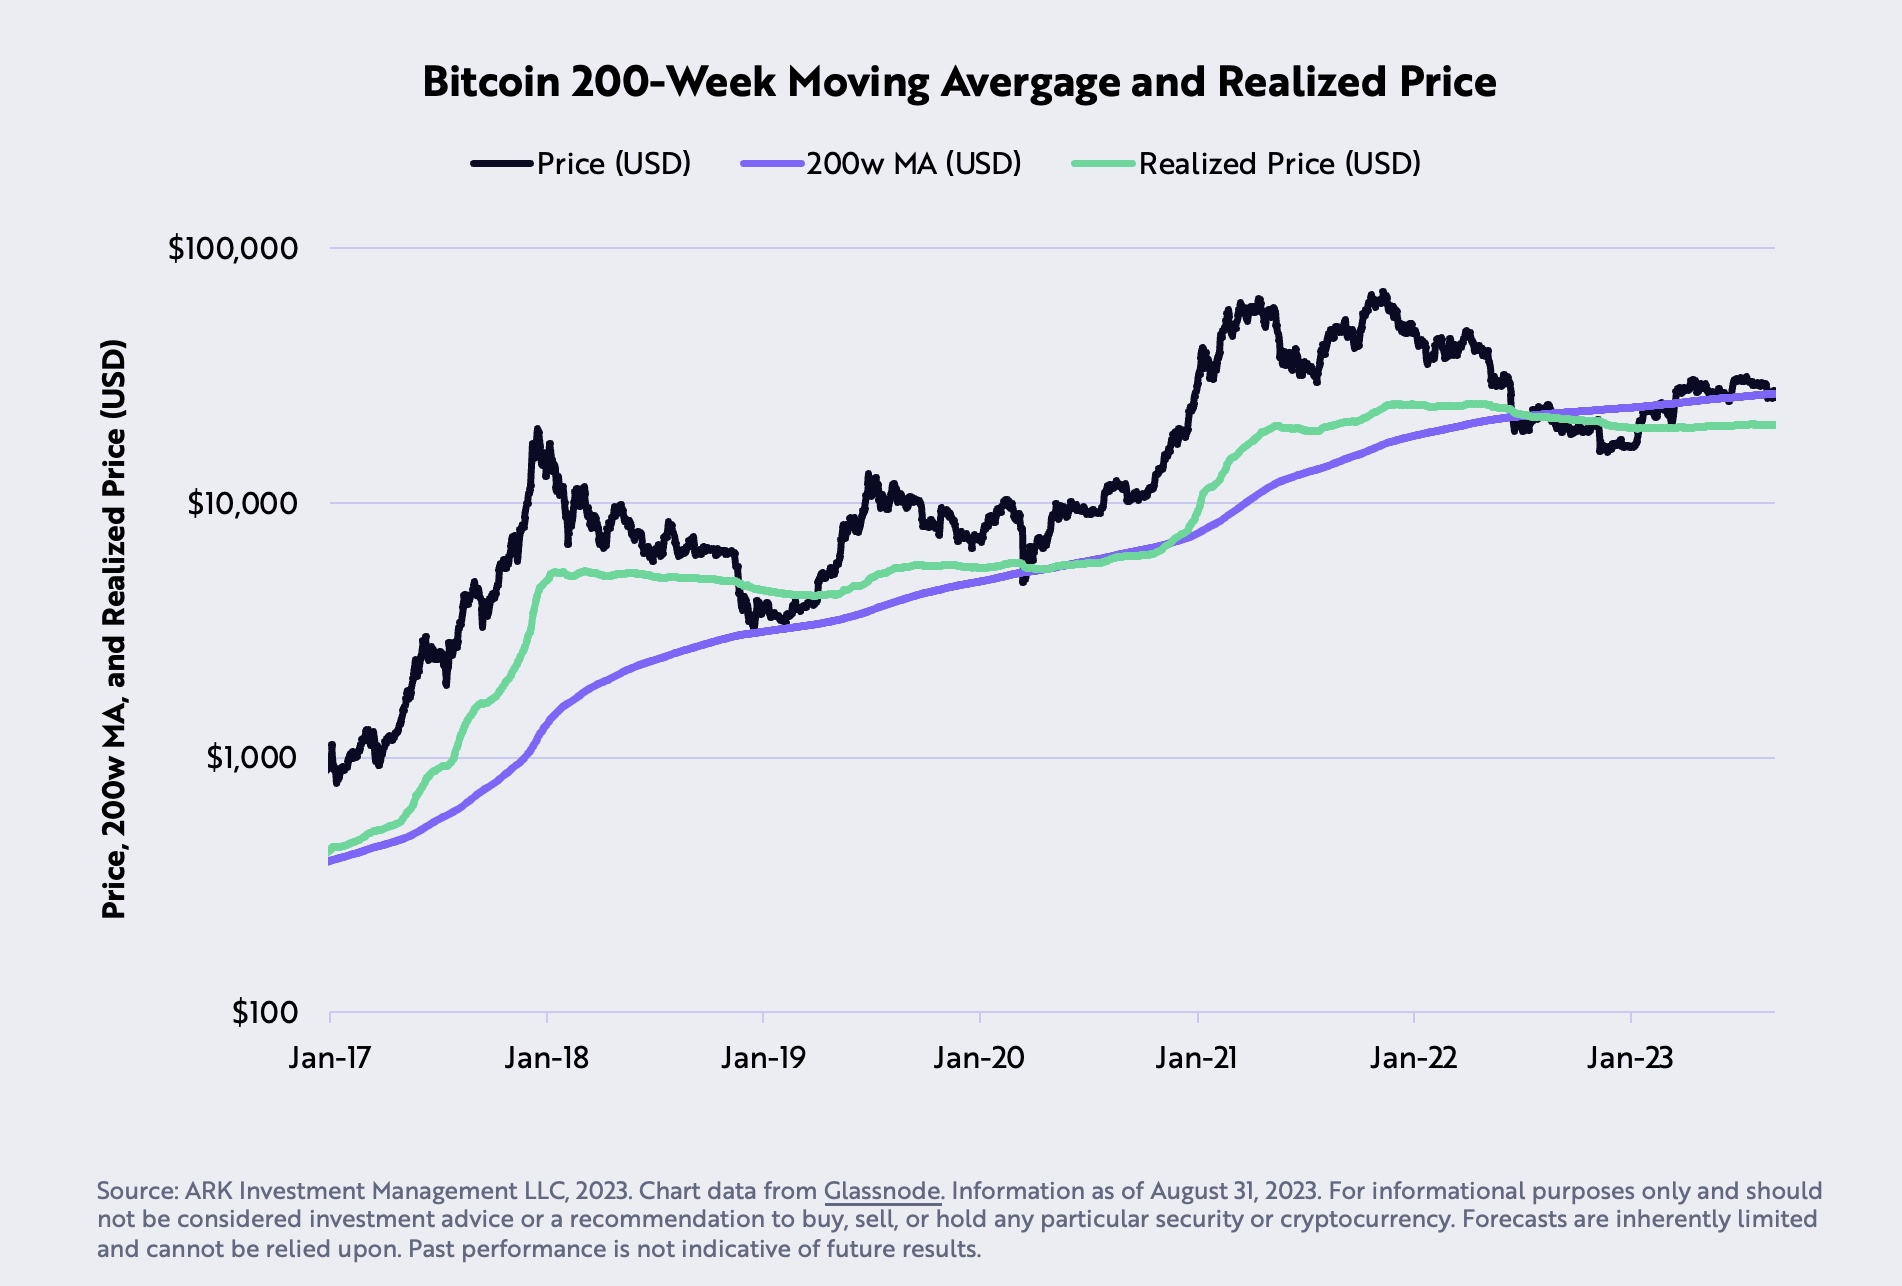
Bitcoin Price and the 200-Week Moving Average: August was a challenging month for Bitcoin as its price dipped by 5.4%, settling below its 200-week moving average at $27,580. This was the first instance since June 2023. However, Ark Invest posits that Bitcoin should find substantial downside support at its realized price of $20,300.
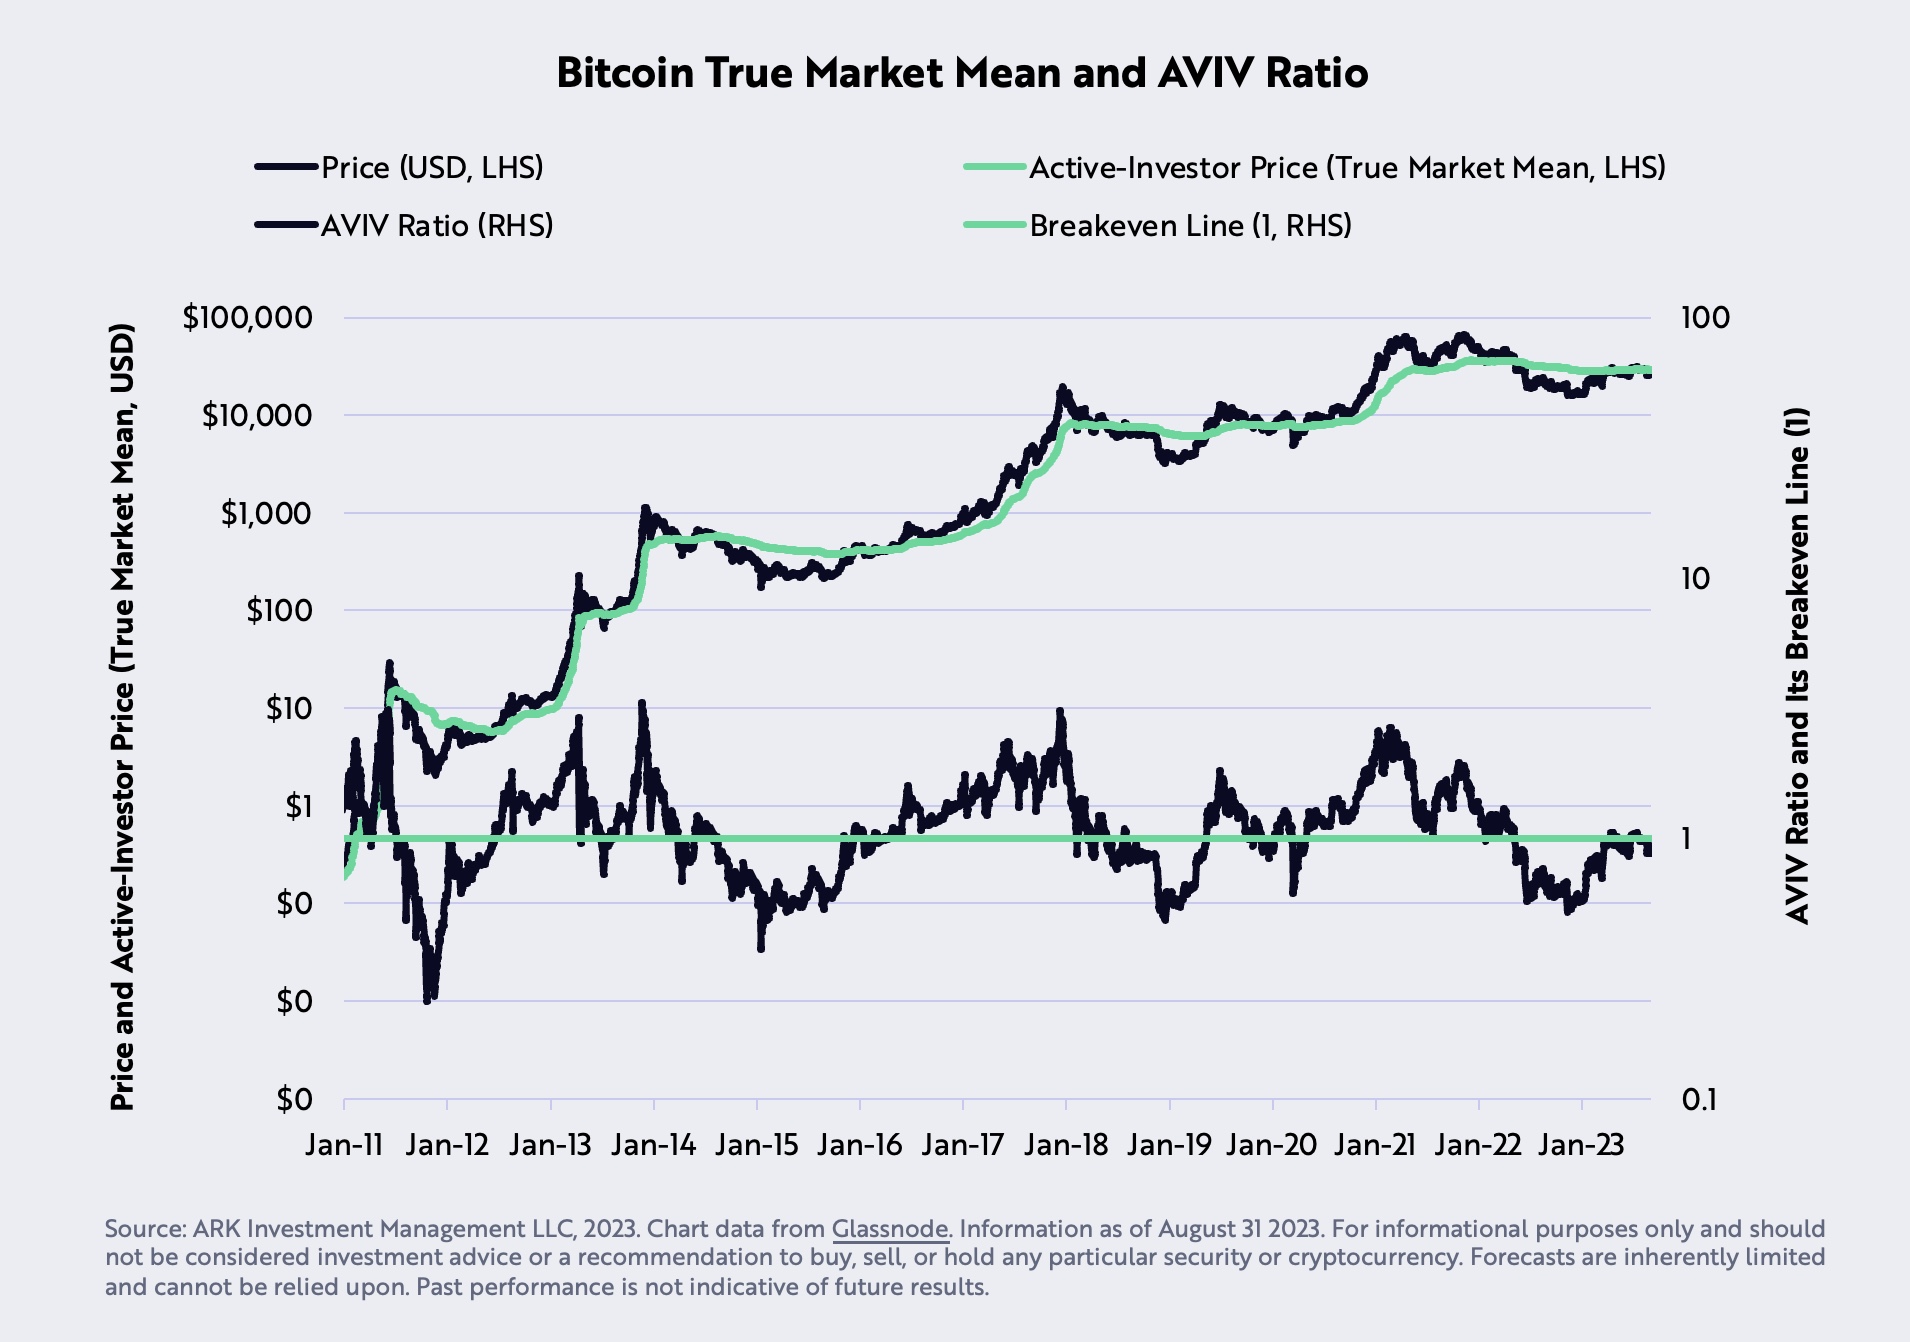
Bitcoin’s On-Chain Mean Resistance: The “on-chain mean,” also termed as the “active-investor price” or “true market mean,” reached $29,608 in August, establishing a potential significant resistance for BTC. This metric, a collaborative effort between ARK Invest and Glassnode, calculated by dividing investors’ cost basis by the number of active coins. These coins are determined based on the aggregate time they’ve remained dormant relative to the total supply.
Stablecoins Market Cap and Liquidity: Stablecoins, often viewed as a liquidity barometer for the market, have seen their 90-day supply drop over 20% from $162 billion in March 2022 to $120 billion currently, signaling a decline in onchain liquidity. However, net inflows during the same timeframe hint at a building bullish market momentum.
Bearish Arguments For BTC (All Macro)
Real GDP vs. Real GDI Growth Rates: A record divergence has been observed between the YoY percent changes in real Gross Domestic Product (GDP) and real Gross Domestic Income (GDI). Historically, GDP and GDI should be on par, as income earned should equate to the value of goods and services produced. Former Federal Reserve economist, Jeremy Nalewaik, has posited that GDI might be a more accurate indicator than GDP.
Real Federal Funds Policy Rate vs. Natural Rate of Interest: For the first time since 2009, the Real Federal Funds Policy Rate has surpassed the Natural Rate of Interest, indicating a shift towards restrictive monetary policy. This theoretical rate, as conceptualized by New York Federal Reserve President, John Williams, is the rate where the economy neither expands nor contracts. With monetary policy’s impact on the economy being long and variable, lending and borrowing are expected to face increased downward pressure.
Government’s Employment Revision: Employment, a lagging indicator, has been pivotal in the Federal Reserve’s rate decisions. Despite the labor disruptions caused by the COVID-19 pandemic expected to have been resolved by now, the government has revised nonfarm payroll statistics downward for six consecutive months. This suggests a weaker labor market than initially reported. The last instance of such a trend, outside of a recession, was in 2007, right before the Great Financial Crisis.
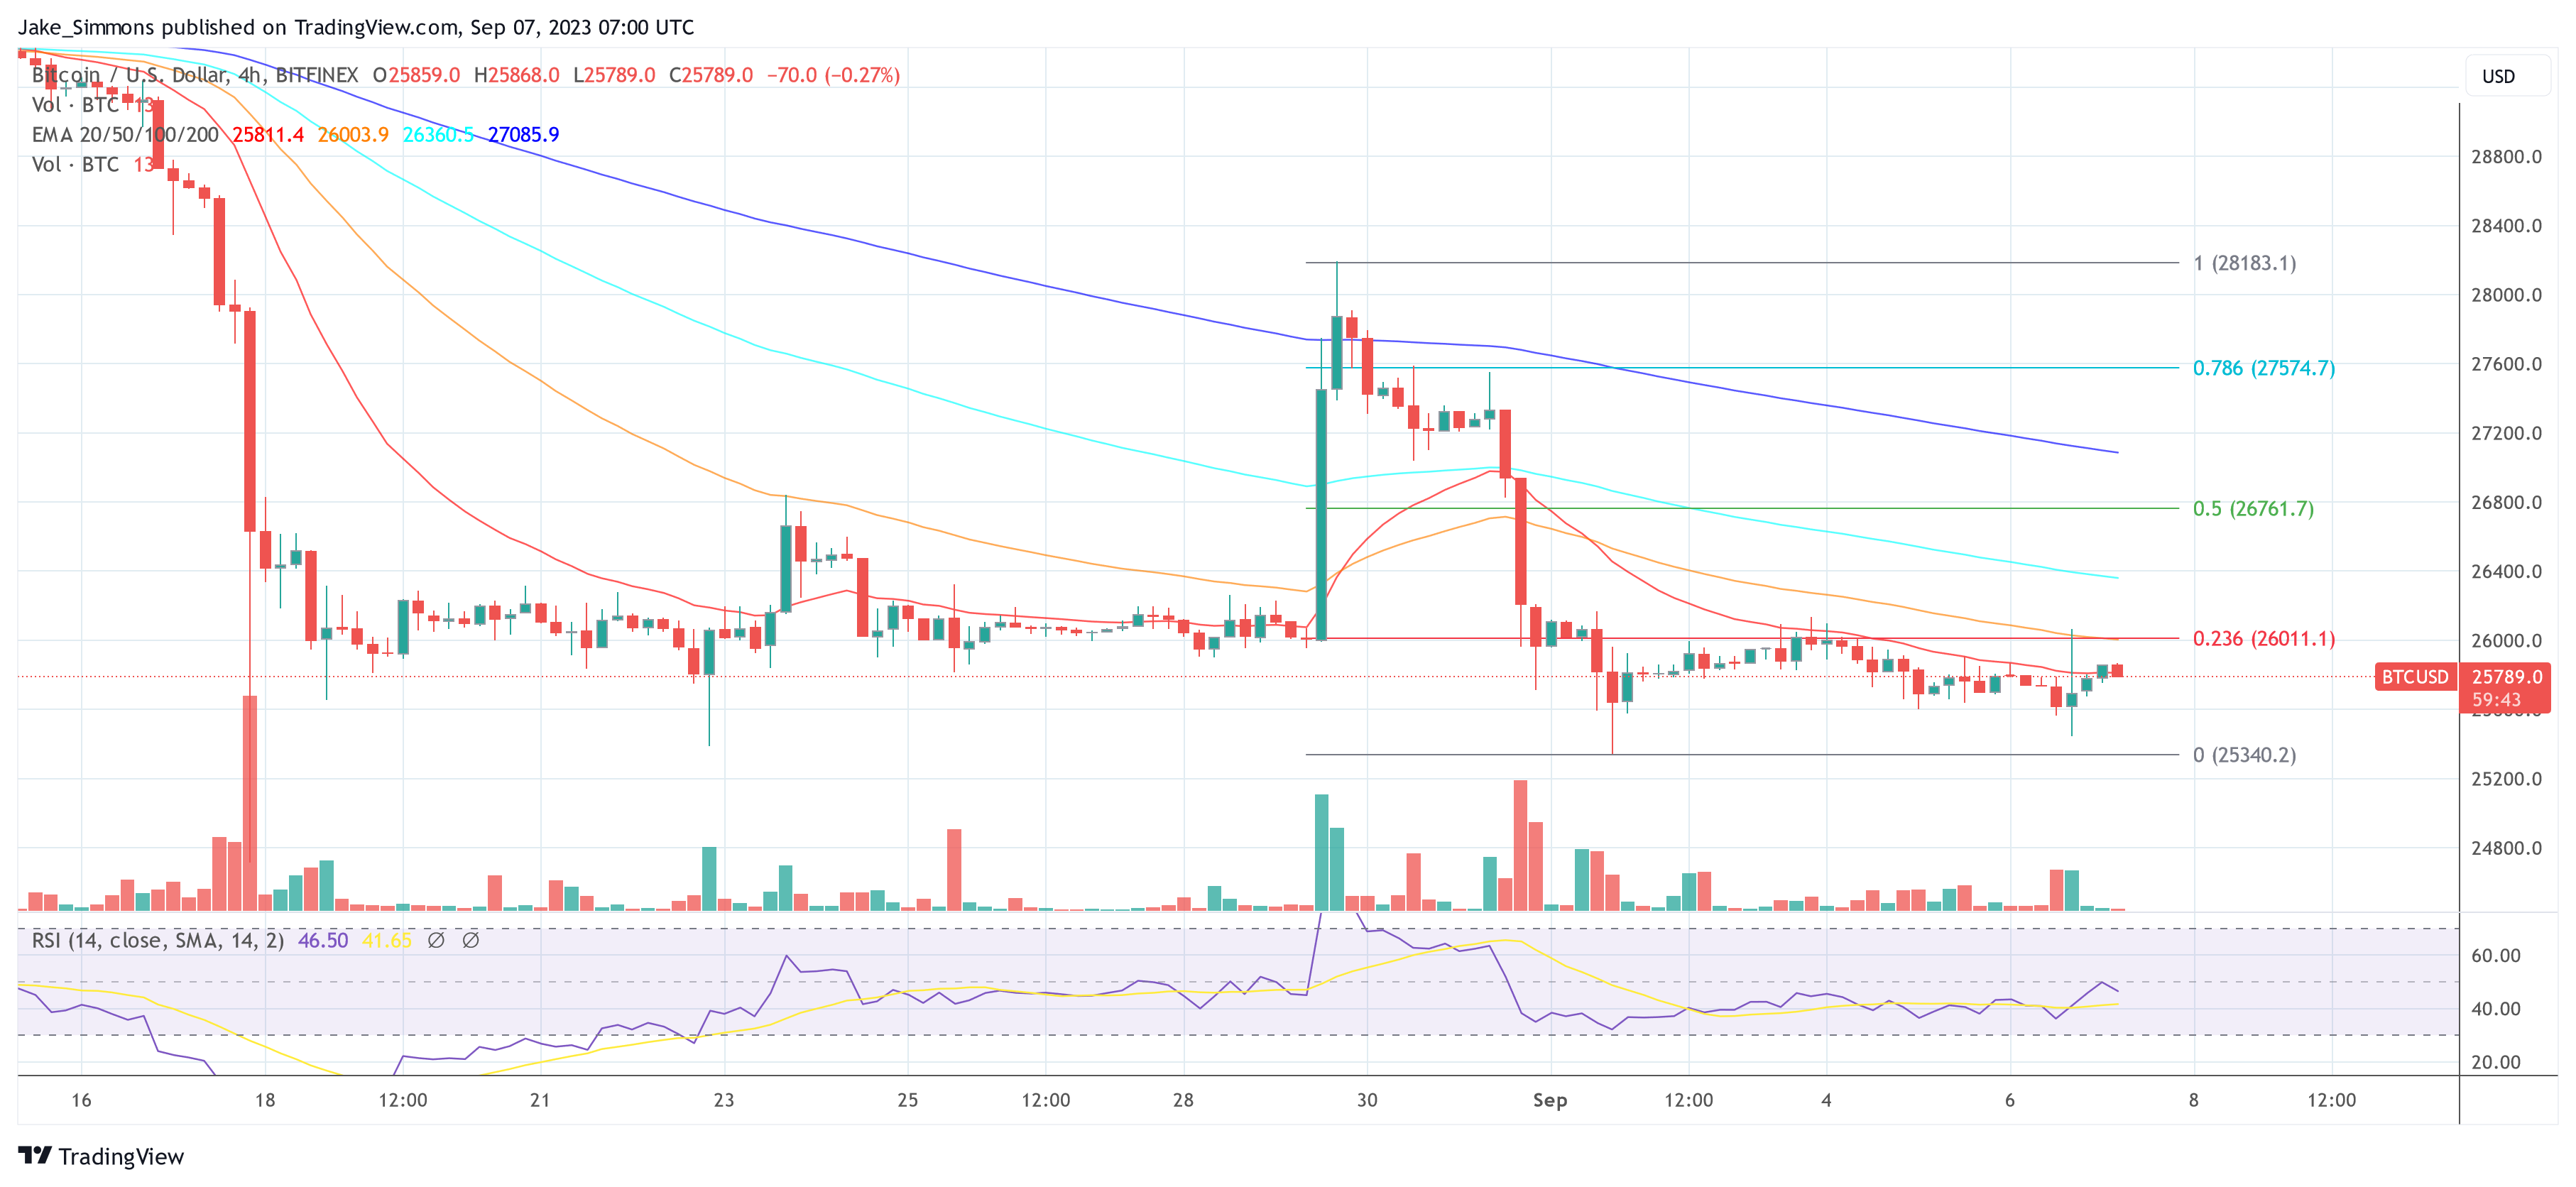
In summary, Ark Invest’s report presents three bullish, four neutral, and three bearish arguments on Bitcoin and the broader market, emphasizing that the market could be at a crucial turning point. At press time, BTC traded at $25,789.
Cathie Wood bullish on Bitcoin and AI convergence

The ARK Invest CEO shares her views on the intersection of Bitcoin and artificial intelligence, highlighting its economic implications.
Cathie Wood predicts SEC simultaneously allowing multiple spot crypto ETFs: Report

ARK Investment Management is one of many firms looking for ways to offer U.S. investors exposure to crypto through exchange-traded funds.
Wood Says ARK Is ‘Taking Profits’ as It Sells $26 Million in COIN
The sale comes a day after ARK sold $50.5 million of the crypto exchange’s stock.
Ark Invest sells more Coinbase shares, eyes Meta platforms, Robinhood

Cathie Wood, the Bitcoin advocate, is actively investing in Meta Platforms (META) and Robinhood Markets (HOOD) shares.
Bitcoin ETF race gets hotter as ARK Invest adds surveillance agreement to application

ARK Invest and 21Shares’ third application for a spot Bitcoin ETF now includes a surveillance sharing agreement.
Cathie Wood’s ARK reportedly ‘first in line’ for a spot Bitcoin ETF

ARK Invest filed for a spot Bitcoin ETF in collaboration with 21Shares long before BlackRock did, and its application is reportedly first in line for the SEC’s approval.
Bitcoin holds $30K as bulls flaunt their advantage in Friday’s $715M BTC options expiry

News of regulatory enforcement against the crypto sector fell by the wayside as the Bitcoin price rallied above $30,000, and options data suggests the trend will continue.
ARK Invest buys Coinbase shares the same day SEC serves lawsuit

ARK Invest bought over 400,000 shares of Coinbase stock totaling more than $21 million on the day the SEC served the exchange with a lawsuit.


