Ethereum News Catalyst Could Trigger Triangle Breakout To $4,000

Could bullish Ethereum news related to the launch of an ETH futures ETF be the catalyst that triggers a massive breakout of a nearly 16-month long ascending triangle pattern?

If the pattern is valid, the target is roughly $4,000 per ETH and a revisit to former all-time highs from the last bull market.

VanEck Announces ETH Futures ETF

Global asset manager VanEck, known best for its ETFs and Mutual Funds, today revealed the upcoming launch of the VanEck Ethereum Strategy ETF (ETUF).

ETUF will be “an actively managed ETF designed to seek capital appreciation by investing in Ether (ETH) futures contracts.”

Rather than investing in spot ETH, the Fund will trade Chicago Mercantile Exchange (CME) ETH futures, and will be managed by the firm’s Head of Active Trading, Greg Krenzer.

ETUF will trade on CBOE alongside VanEck’s Bitcoin Strategy ETF (XBTF). And although its inception of November 15, 2021 marked the end of the bull market in crypto, the introduction of Ethereum futures has the potential to kickstart the next bull run.

ethereum news ascending triangle

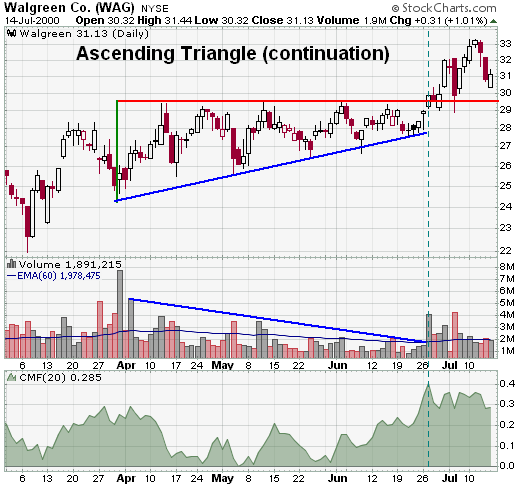
Ethereum News Catalyst Could Trigger Ascending Triangle Breakout

Show me the chart and I’ll tell you the news, is a famous quote from the late Bernard Baruch. The message reflects the fact that the largest technical moves tend to coincide with a news catalyst and vice-versa.

Essentially, the a bullish chart pattern could possibly appear before positive news – such as the launch of an ETH futures ETF – while the news itself is the catalyst for a strong breakout.

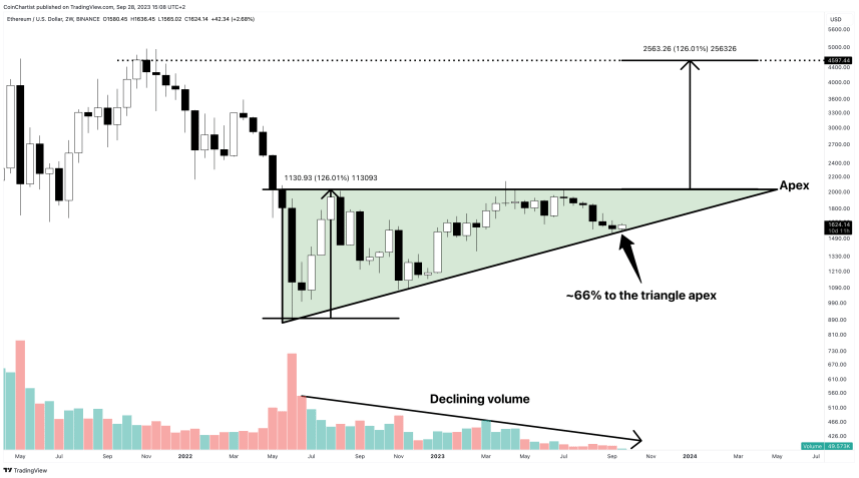
This is precisely what appears to be brewing in ETHUSD charts since June of 2022. Unlike Bitcoin which put in a bottom late in 2022, Ethereum found support about halfway through the year. Since then, Ether has consistently made higher lows, forming a potential ascending triangle chart pattern.

Now, the ascending triangle pattern is nearing the two-thirds point from its apex. This increases the chances of a breakout occurring as an Ethereum futures ETF gets launched have increased significantly. All that’s required is a breakout above $2,000 per ETH on higher than normal volume. Based on the measure rules, reaching the target objective could push prices to over $4,000.

Baby Got Back: 50-Year Veteran Trader Compares Bitcoin Bottoms

Whether it is Bitcoin or another asset, bottoms can be hard to spot until much later in hindsight. That is unless you are Peter Brandt, career commodities trader with nearly 50 years of market experience.

In a new comparison, Brandt compares the crypto bear market bottom he predicted a year in advance, with the current pattern that recently pushed Bitcoin beyond $45,000. Here is the full comparison along with why it might be worth listening to Brandt’s words of wisdom.

50-Year Trading Veteran Hints At Possible Bitcoin Bottom

In a new tweet, founder of The Factor Report Peter Brandt compares the late 2018, early 2019 bear market bottom, with the current Bitcoin price action.

Brandt specifically calls attention to the ascending triangle pattern that Bitcoin price appears to have broken out of, and its resemblance to what turned out to be the ultimate price floor.

Related Reading | This Bitcoin “Heatmap” Suggests A Blazing Cycle Peak Is Still Ahead

The classical chartist cites reference to what is considered “the real bible of technical analysis” – the book Technical Analysis and Stock Market Profits: A Course in Forecasting by Richard W. Schabacker. The expert technician even references the exact page number where more details on the pattern can be found.

In a recreation of Brandt’s chart below, the two potential Bitcoin bottoms are compared directly. In addition to the ascending triangle, there is also an Adam and Eve-like double bottom formation, and each bottom occurred along a similar trend line dating back almost a decade.

A recreation of Brandt’s comparison with another look for good measure | Source: BTCUSD on TradingView.com
Why Peter Brandt’s Crypto Comparison Holds Weight

Because of Brandt’s sometimes bold calls that go against the hive mind of crypto Twitter, the trader often gets labeled a “hater.” In reality, he regularly says Bitcoin is among the most remarkable markets he’s ever traded and was among the first to call attention to the parabola building in 2016 and 2017.

When that parabolic advance was violated in late December 2017 and early 2018, he was also the first to suggest the way down was a lot further than most were ready to accept. Brandt called for a full 80% or more retrace in the price per coin of the top cryptocurrency almost a full year before it landed at his target.

Related Reading | Peter Brandt Calls For 80%+ Bitcoin Price Decline With Chilling Accuracy

Unlike what is commonly seen throughout the crypto world, Brandt doesn’t rely on complex technical indicators, buy or sell signals, or on-chain metrics. All he uses are straight or curved lines, which often accurately represent a contained trend. When such lines are violated, a trend change often follows.

With Bitcoin breaking above the top of an ascending triangle trend line, is Brandt specifically calling attention to a trend change ahead? If so, paying closer attention to the comparison between each major crypto bottom could be critical.

Follow @TonySpilotroBTC on Twitter or join the TonyTradesBTC Telegram for exclusive daily market insights and technical analysis education. Please note: Content is educational and should not be considered investment advice.

Featured image from iStockPhoto, Charts from TradingView.com

The Chart Pattern That Takes Ethereum To $10K

In a flash, Ethereum is back to trading under $3,000 after just weeks ago reaching a high well over $4,000. The wider crypto market correction got the best of ETH and the rest of altcoins especially, and even managed to take down Bitcoin.

However, if past market cycles are any indication of future results, the crash could be the first touch of an ascending trendline that sends the top-ranked altcoin to around $10,000 per ETH.

How DeFi and NFTs Make For A Very Different Bull Run Than ICOs

During the 2017 bull market, both Bitcoin and Ethereum soared as money flowed into the market. Much of that capital trickled its way down to ICOs, which only further fueled the FOMO for ETH. Eventually, they also led to the collapse of the second-ranked cryptocurrency and the start of the Ethereum bear market.

Today things are very different. The most important altcoin in the space carries the rest of the market on its back. Sure that leads to high fees and slower transactions, but that’s because DeFi is such a big deal and so are NFTs.

Related Reading | The Bearish Signal Ethereum Bulls Need To Fear

These two transcendent technologies are also thanks to Ethereum, and while other chains could take the lead, first-mover advantage is hard to beat. Even though the altcoin collapsed in price recently, the pullback was technical and fundamentals remain plenty bullish.

This could result in the latest selloff being the bottom, and after some gyrating in an ascending pattern, a breakout to $10,000 could be next for ETH.

The ascending triangle would target $10K ETH | Source: ETHUSD on TradingView.com

Analyst: Repeating Triangle Fractal Could Send Ethereum To $10K

The pattern in reference is an ascending triangle pattern, pictured above. The pattern also matches the final consolidation phase of the last bull market, before Ethereum ran to all-time highs and the bear market started.

Related Reading | Here’s Where The Ethereum Rally Could Pause, According To Bitcoin Blueprint

Ether has a lot more going for it this time around, but after a run from $4,000 to $10,000, the market might need a reset – much like the market needed to reset after the rise from $500 to $4,000 over the last year.

Ethereum pitchfork $10k

The path Ether could take if the fractal confirms | Source: ETHUSD on TradingView.com

According to one trader who also sees the pattern playing out, the target of the structure will be $10,000 per ETH. Adding in an ascending pitchfork channel and some bars from the last breakout projected forward, and the price action would fit.

The path Ethereum takes would only be visible in hindsight, but if accurate, the crypto market has one more leg up before the bull market is over.

Featured image from iStockPhoto, Charts from TradingView.com

Latest Bitcoin Dip Did Little In Offsetting “Wildly Bullish” Bias; Here’s Why

Bitcoin dropped immensely after setting up a record high of $64,896.75 as some traders decided to secure short-term profits.

The correction nevertheless did little in offsetting the benchmark cryptocurrency’s upside bias. Analysts remained convinced that the BTC/USD exchange rate would rebound from its sessional lows to pursue its uptrend as it was. One of them is Dr. Jess Ross.

The founder/chief executive at Vailshire Capital tweeted earlier Thursday that Bitcoin remains “wildly bullish,” citing an ascending triangle to back his upside sentiment. In retrospect, the BTC/USD exchange rate was trading inside the bullish continuation pattern, with the area between $60,000 and $61,000 serving as its interim resistance.

Bitcoin broke out of the Ascending Triangle pattern earlier this week. Source: BTCUSD on TradingView.com

Earlier this week, the pair broke above the price ceiling range on supportive macroeconomic sentiments. Coinbase, the US’s largest cryptocurrency exchange, debuted on the Nasdaq Stock Market following a landmark direct listing. Traders used the Wall Street-oriented signal to raise their bitcoin bids, insomuch that the price surged by more than $5,000 in the hours leading up to the Coinbase share (Ticker: COIN) listing.

The news helped Bitcoin break above the $60,000-61,000 range after testing it for weeks. But its effect started wearing off New York mid-afternoon session Wednesday. The wild fluctuations in the COIN market rattled traders inside the spot Bitcoin one. The price fell, as a result, leaving traders guessing about the next potential bias in the cryptocurrency market.

Bitcoin to $80,000 Next?

Dr. Ross noted that bitcoin bulls should wait for the price to drop towards the previous price ceiling of ~$61,250 before buying the cryptocurrency or placing a bet on its upside move. He added that BTC/USD would surge higher after testing the flipped resistance level.

“Great opportunity to buy before next leg higher,” he tweeted.

As NewsBTC also covered, Ascending Triangle breakouts typically shoot the price upward by as much as maximum length between the pattern’s upper and lower trendlines. That puts Bitcoin’s breakout target at nearly $80,000.

Photo by Macau Photo Agency on Unsplash