AVAX Price Bucks Under The Pressure Of Upcoming $102 Million Token Unlock

While most altcoins are looking toward a recovery from the recent market crash, the AVAX price seems to be gearing up for the opposite. The reason behind this is the massive token unlock that is set to occur this week, which will undoubtedly place more sell pressure on the already struggling price of the digital asset.

$102 Million In AVAX Set To Be Unlocked

The Avalanche network, like a lot of others, has locked a portion of its total token supply to be released into circulation on a periodic basis. Given that these unlock events can put bearish pressure on a token, they can often be a signal to exit.

For AVAX, the next token unlock event is set to take place on August 26, five days from now. But the most interesting thing about this event is the number of tokens set to be brought into circulation. According to the token tracking website Token Unlocks, a total of 9.54 million tokens are set to be unlocked on Saturday. This accounts for 2.77% of the total circulating supply of the asset, worth $102.29 million at current prices.

AVAX token unlock

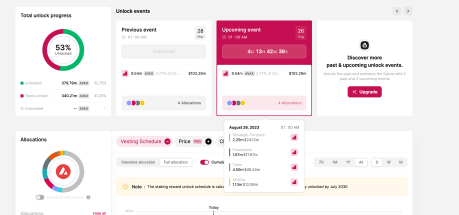
The website also shows that the unlocked tokens are being distributed in four allocations. These include 1.13 million tokens ($12.06 million) for airdrop, 1.67 million tokens (17.87 million) for Foundation, 2.25 million tokens ($24.12 million) for strategic partners, and 4.5 million tokens ($48.24 million) for the team.

With this unlock, over 55% of the total token supply will be unlocked, leaving less than 45% of the supply locked. And as these 9.54 million tokens make their way to the market, it could be very bad for investors.

Will AVAX Price Be Impacted?

Given the allocation of the $102 million in tokens set to be unlocked, it is likely that a large chunk of it is going to hit the open market. As a result of such a large amount of selling, the AVAX price will certainly be impacted, making an already bad situation worse.

This will likely see the price of the digital asset fall below $10 for the first time since July 2021. Trading in the single-digit will see AVAX holders plunged further into losses, even though the vast majority are already sitting in the red, according to data from IntoTheBlock.

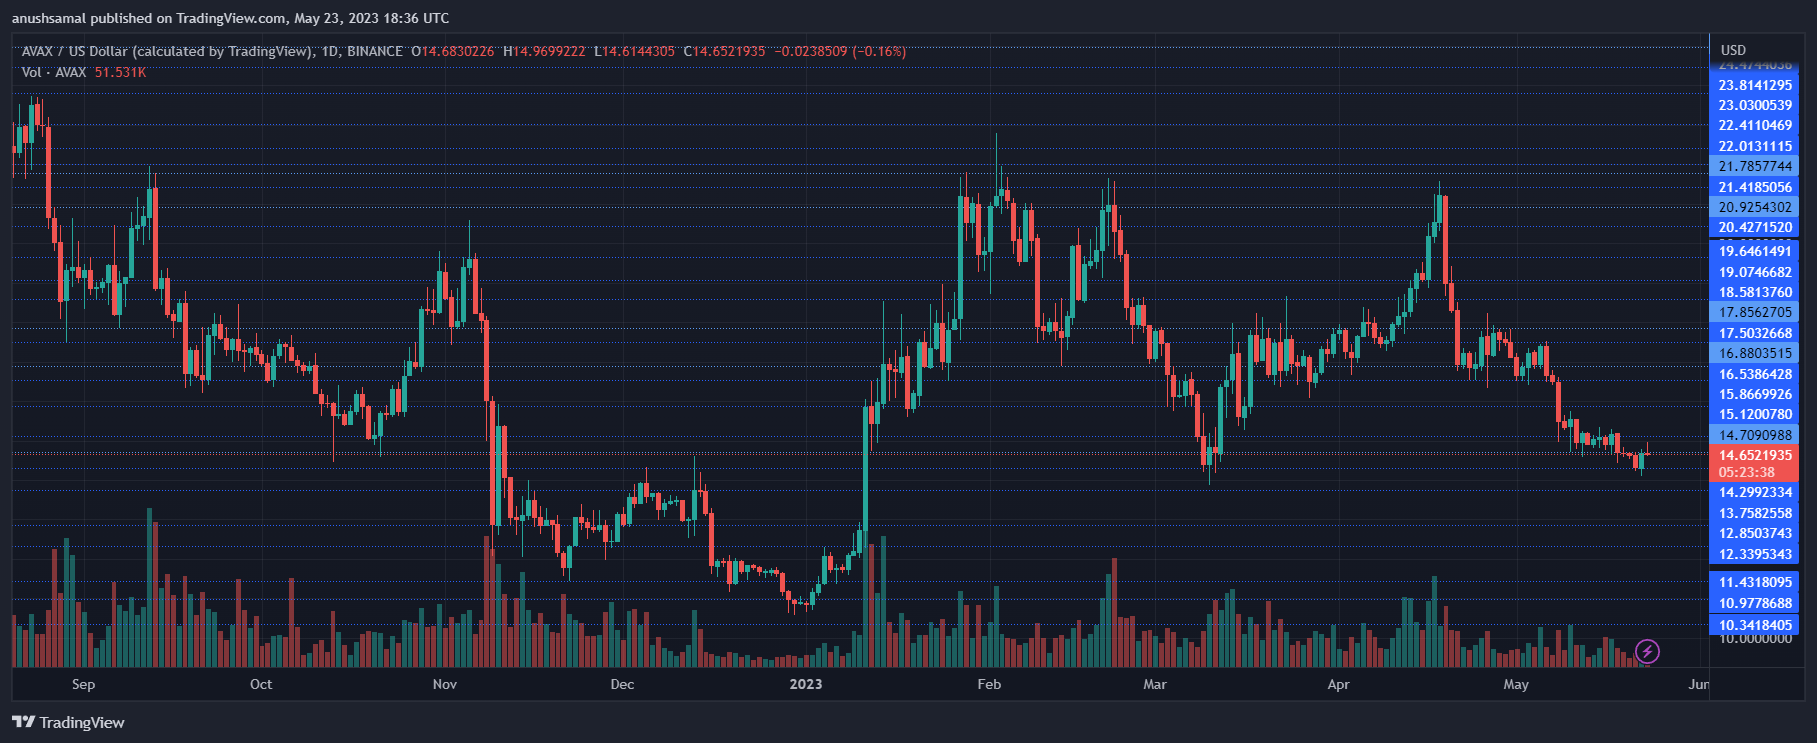
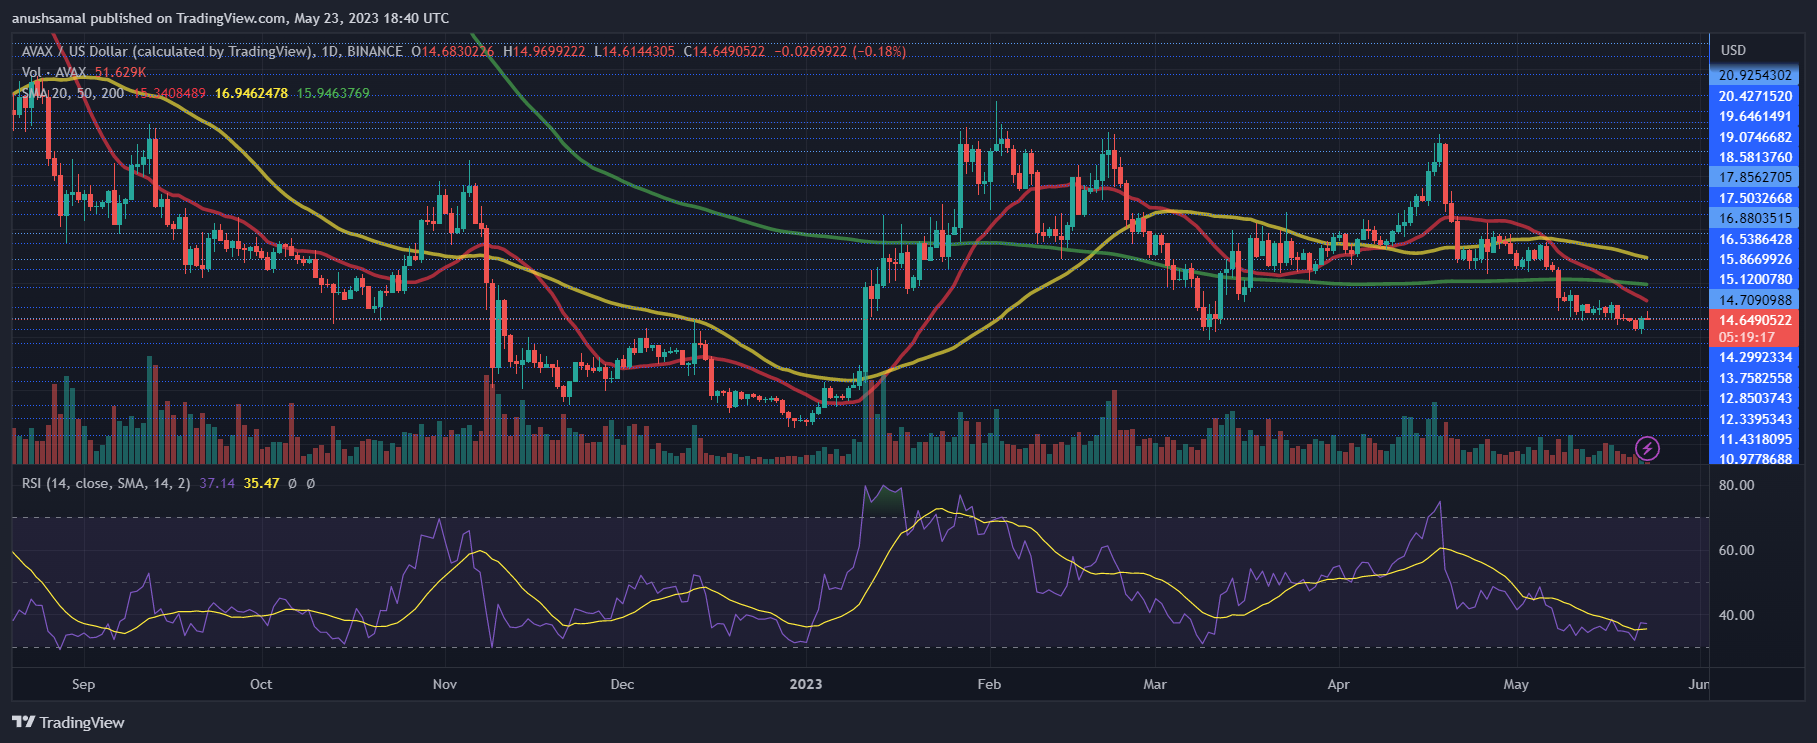
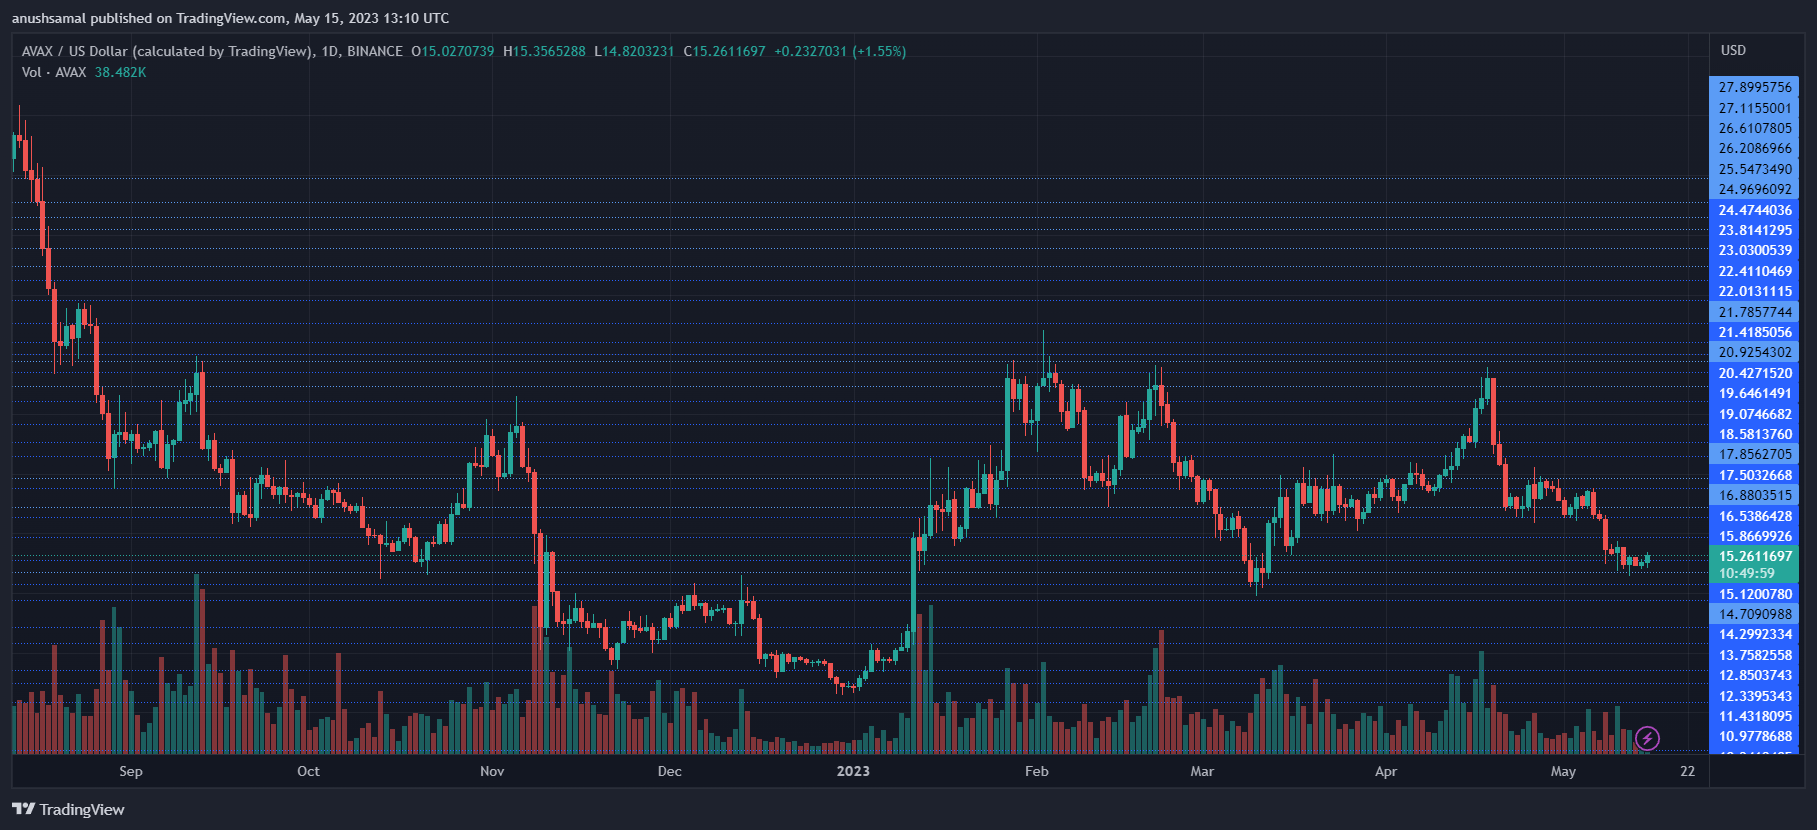
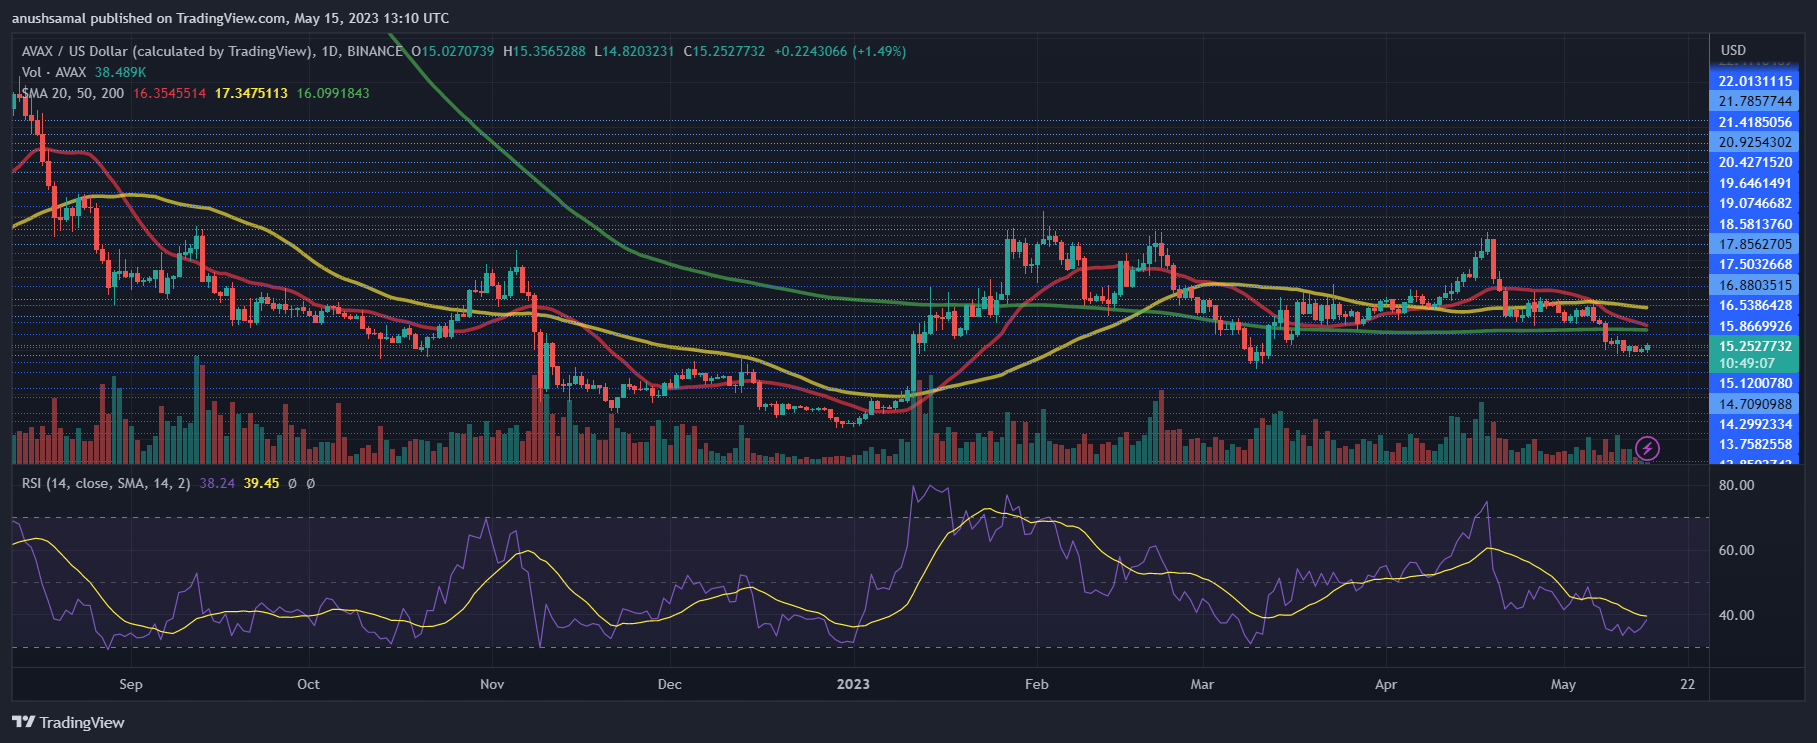
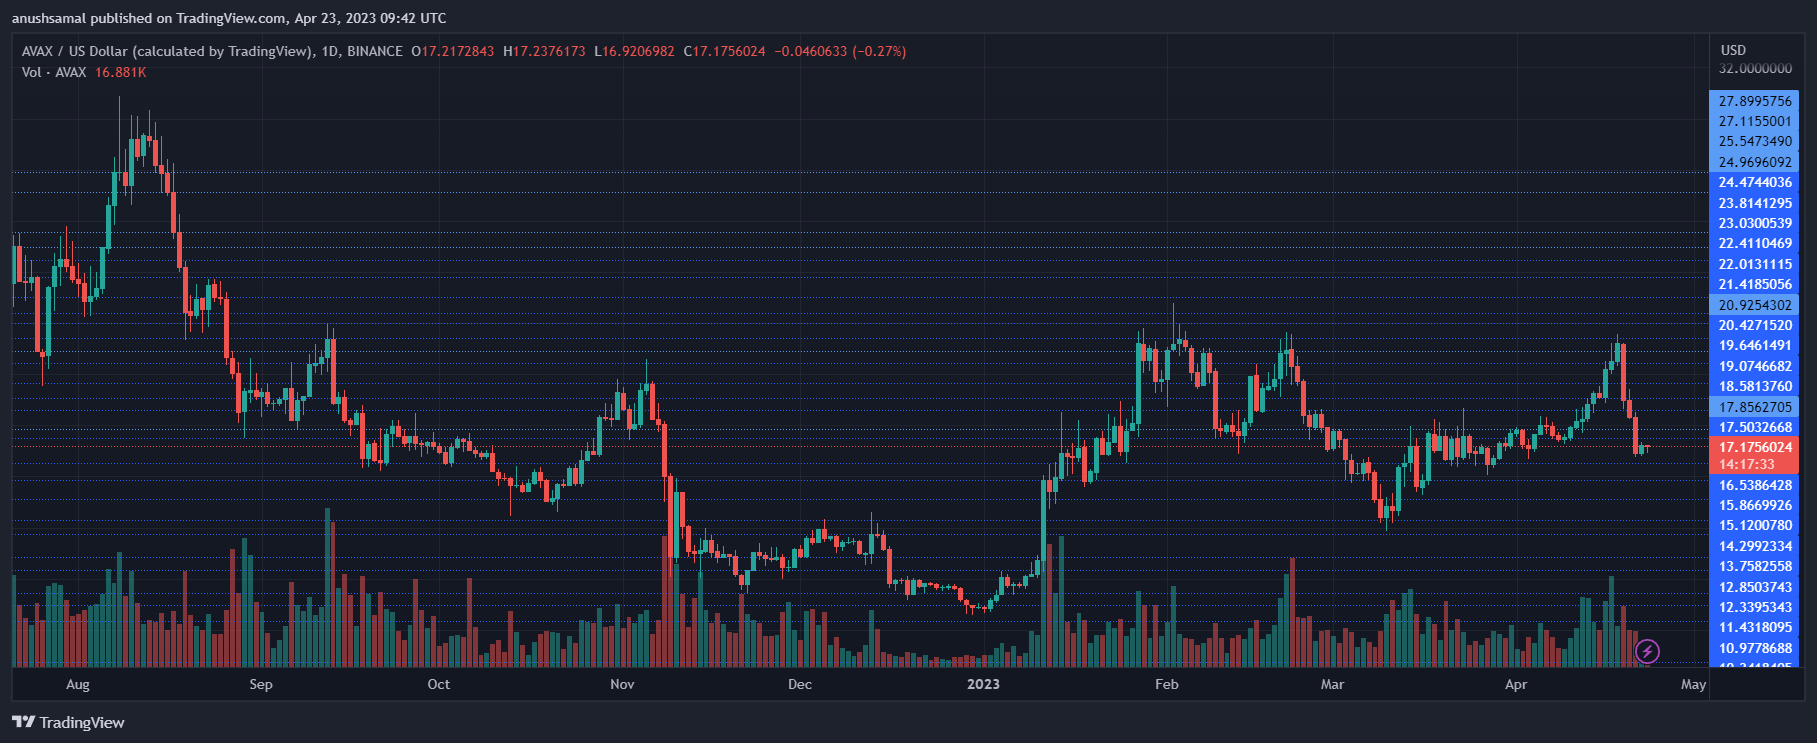
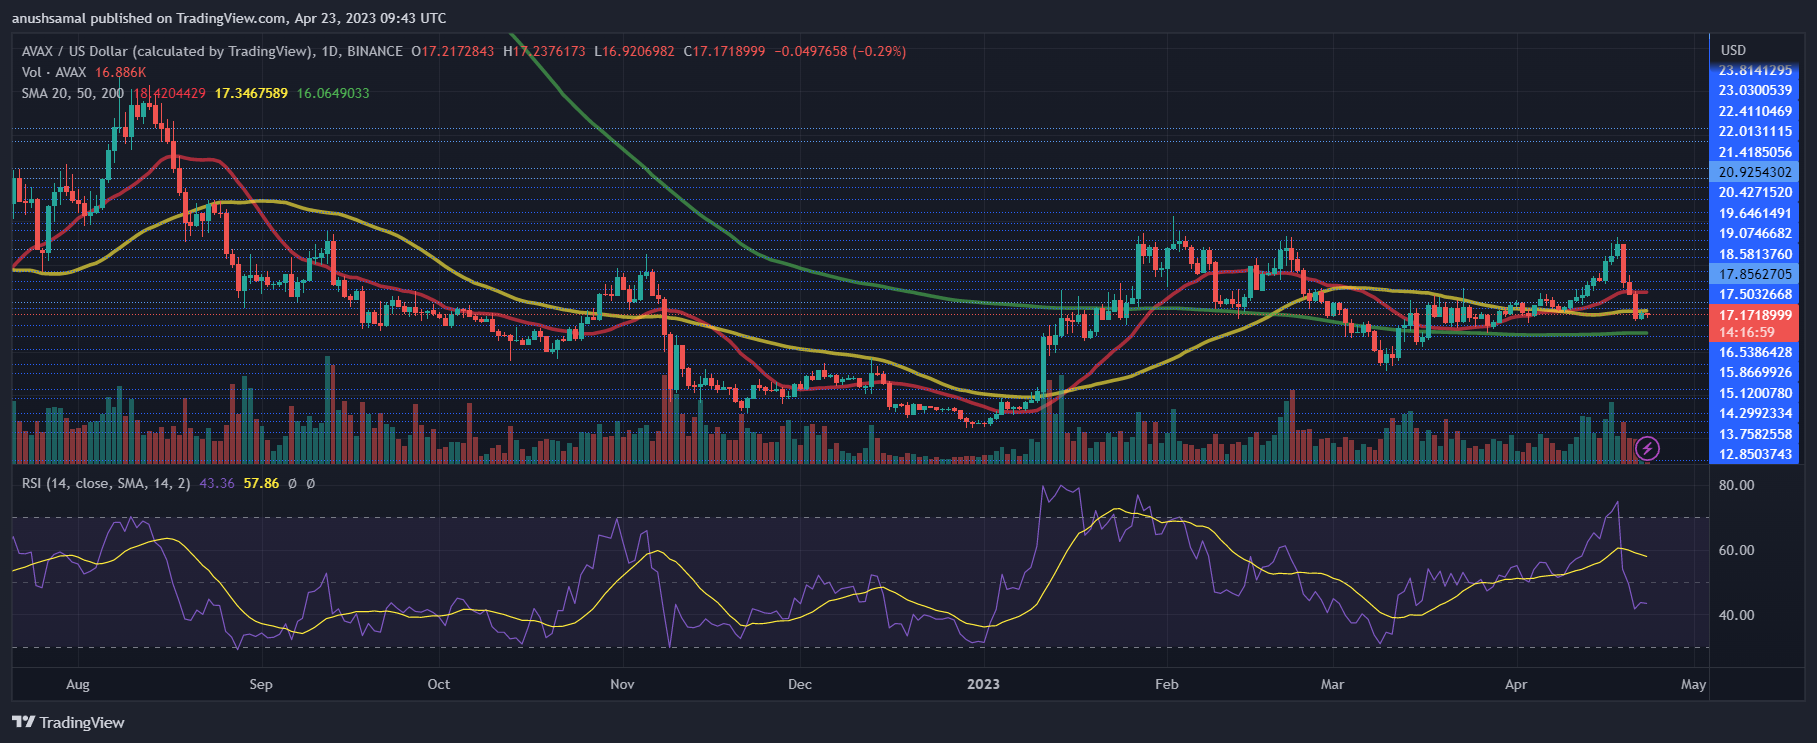
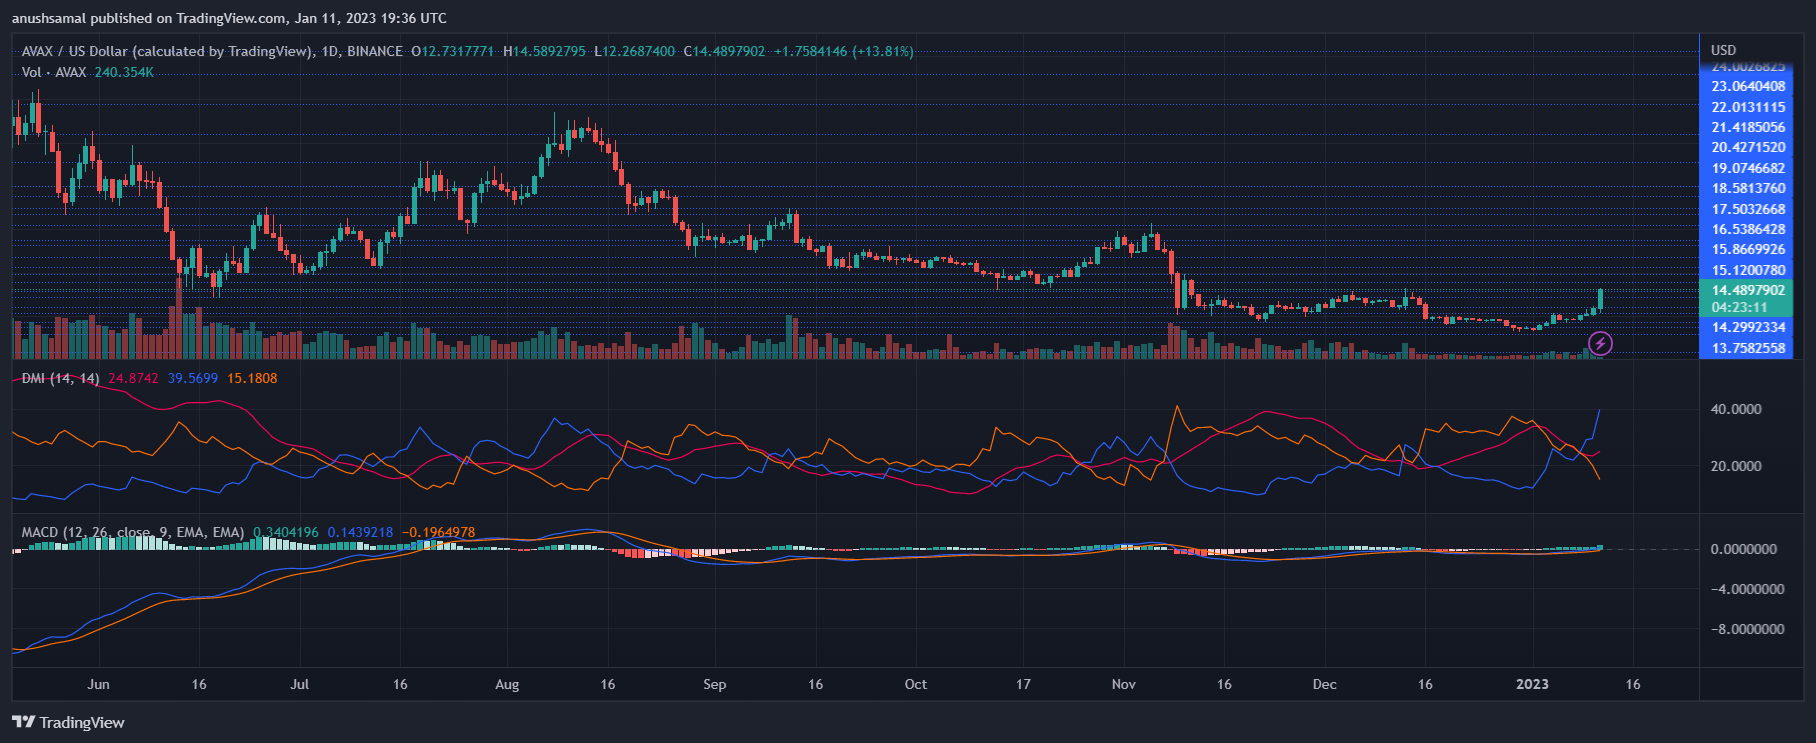
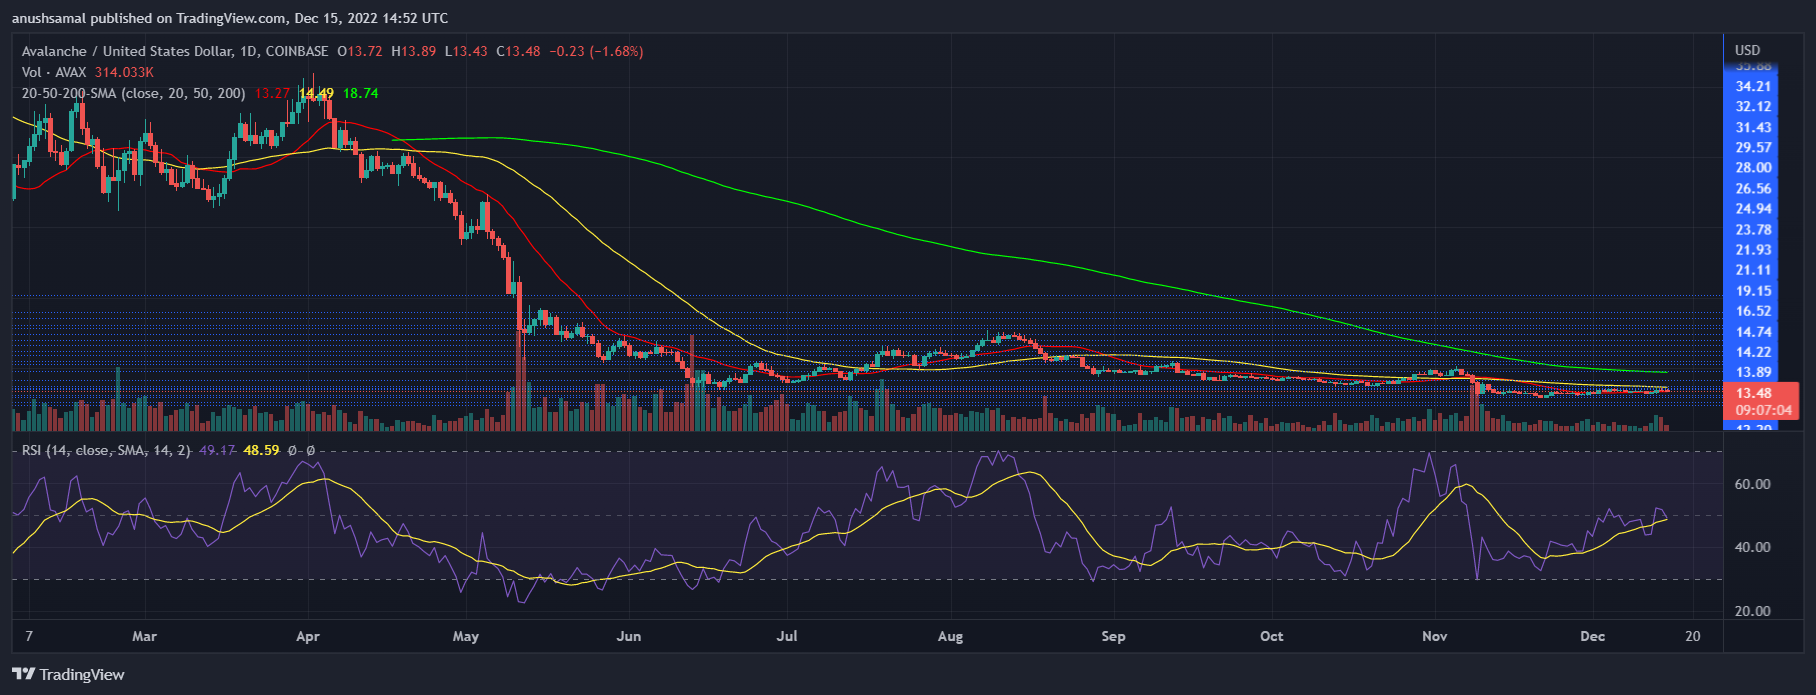
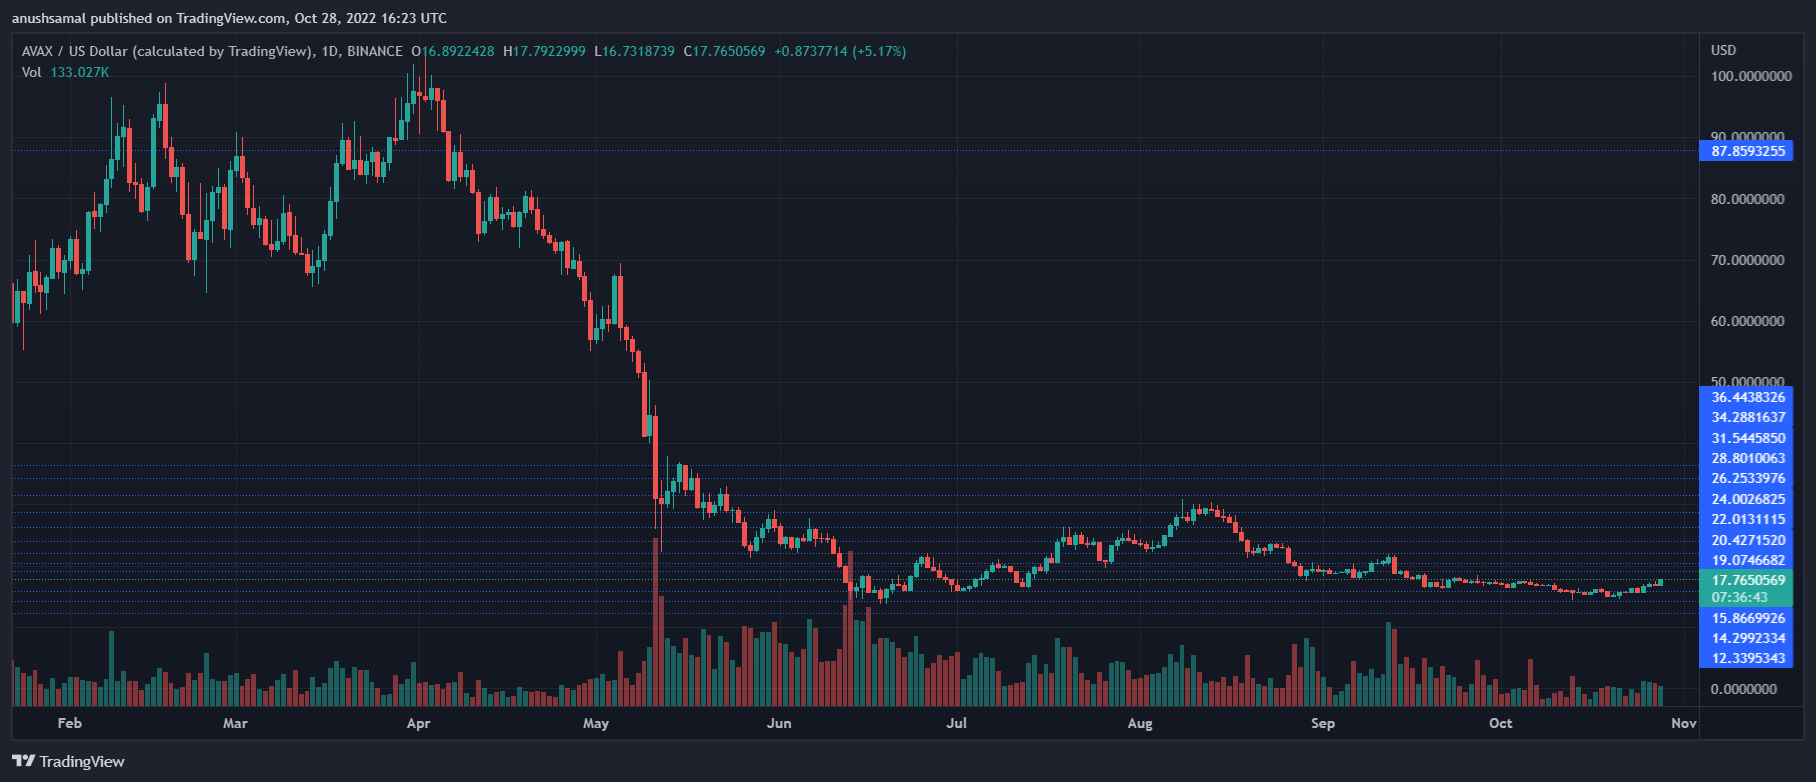
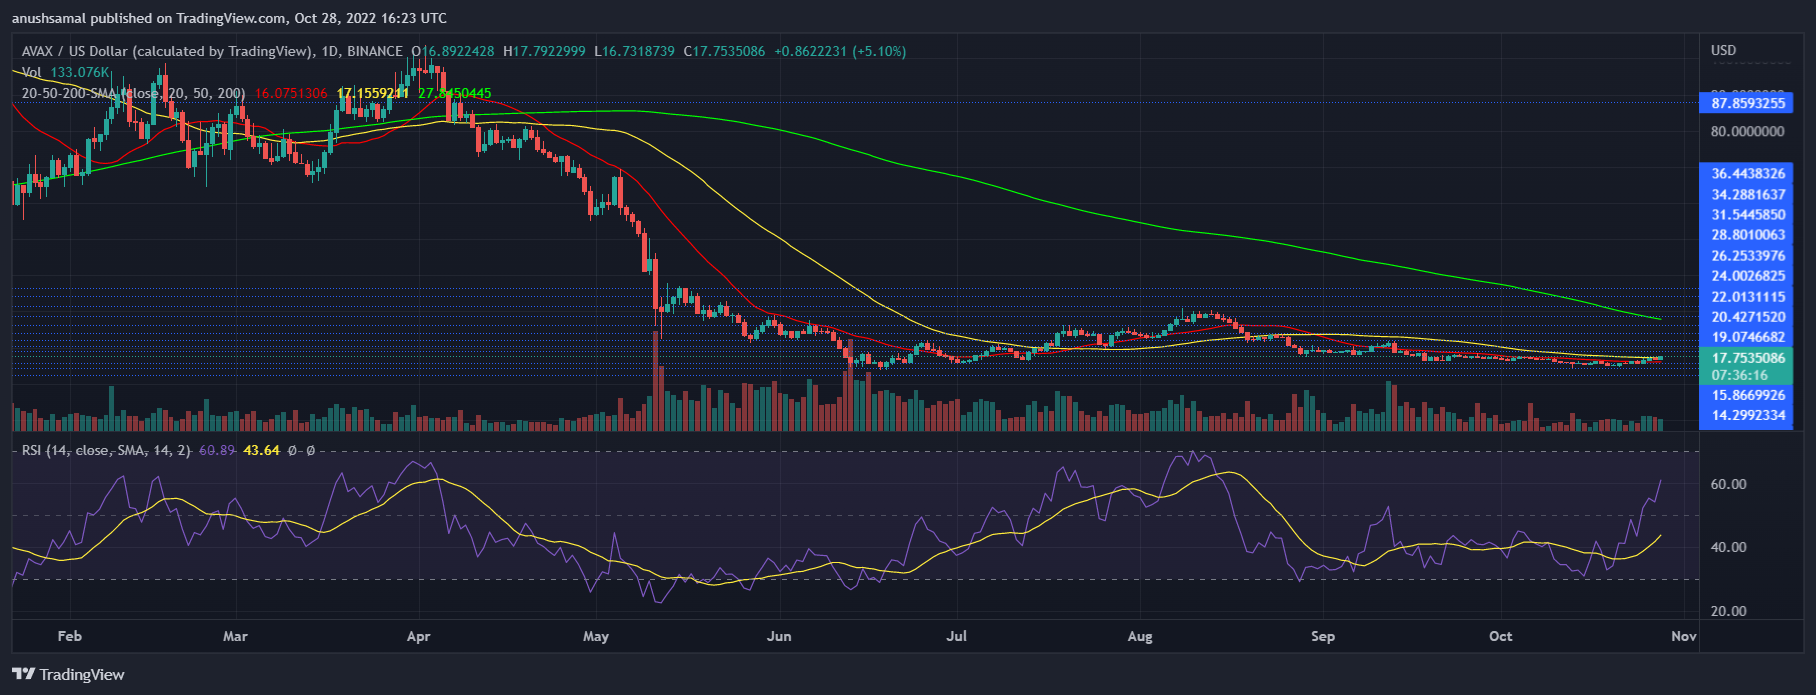
AVAX’s indicators are also incredibly bearish at this point with the price sitting below the 100-day and 200-day simple moving averages. This rules out a recovery for the digital asset in the short term, especially with the unlock event coming up.

At the time of writing, the AVAX price is sitting tentatively at $10.56, down 13.15% in the last week.

AVAX price chart from Tradingview.com

Avalanche (AVAX) Ecosystem Poised For An Explosion, Here’s Why

The Avalanche (AVAX) ecosystem is gaining increasing attention in the world of blockchain and decentralized finance (DeFi). Despite not being as well known as other chains, such as Ethereum or Binance Smart Chain, Avalanche’s unique consensus mechanism and interoperability with other chains make it a compelling option for developers and users alike. 

With a promising Total Value Locked (TVL) and strong engagement from users and developers, the Avalanche ecosystem is on the cusp of significant growth and innovation.

Is AVAX The Next Big Thing?

According to DeFi researcher Wacy, the Avalanche ecosystem is on the verge of blooming, and there are several reasons behind its recent increase in popularity. While many are focused on the new Layer 2 solutions, Wacy suggests that the potential of Avalanche should not be overlooked.

One important measure of a chain’s success is Total Value Locked, and despite the token price dropping over 80%, the TVL for $AVAX has only decreased by 50%. This indicates continued interest in the chain and serves as a positive indicator of its future potential.

Avalanche

In addition to TVL, other metrics such as daily active addresses and daily transactions show good growth, indicating strong engagement from users. The number of contracts and deployers is also a powerful indicator of interest in a project, and this metric also shows strong engagement from developers.

Furthermore, Wacy notes that The Avalanche community is also growing, with increasing followers on Twitter and a high level of Twitter mentions over the past 7 days. These basic metrics may be overlooked by some, but they provide valuable insights into the potential of the Avalanche ecosystem.

Avalanche Emerges As A Hidden Gem For Developers and Users

According to Wacy, as the Avalanche ecosystem continues to gain attention in the world of blockchain and decentralized finance, several projects are emerging as potential main narratives that could see a significant rise during this heyday.

One such project is Trader Joe, which is currently the number one decentralized exchange (DEX) on Avalanche. By creating the most capital-efficient DEX in DeFi, Trader Joe is shaping the future of decentralized finance. The JOE token allows users to earn a share of the platform’s revenue and unlocks access to exclusive rewards and features.

With a current price of $0.35 and a market cap of $120M, Trader Joe is listed on Binance, OKX, and Huobi, and is poised for significant growth in the coming months.

Another project that could see significant growth during the Avalanche ecosystem’s heyday is GMX. GMX is a decentralized exchange with low swap fees and zero price impact trades. While it is well known for its support of Arbitrum, GMX also supports AVAX.

With a current price of $54 and a market cap of $475 million, GMX is listed on Binance, OKX, Huobi, and KuCoin, and staking GMX earns rewards, with 30% of swap and leverage trading fees converting to ETH/AVAX and distributing to GMX tokens. Staking on Arbitrum earns ETH while staking on Avalanche earns AVAX.

Overall, these projects represent the unique potential of the Avalanche ecosystem. With its unique consensus mechanism, interoperability with other chains, and promising metrics, Avalanche is attracting significant interest from developers and users alike. As more projects like Trader Joe and GMX emerge, we can expect to see continued growth and innovation in the ecosystem, with new use cases and applications for blockchain technology.

Avalanche

At present, AVAX is experiencing a significant drop in value across all time frames. Its current trading price is $14.09, with a slight increase of 0.1% over the last 24 hours. However, over the seven, fourteen, and thirty-day periods, AVAX has experienced a decline of 5%, 6%, and 16% respectively.

Featured image from Unsplash, chart from TradingView.com 


Avalanche Breaks $14 Price Level, Yet Remains Hinged On Crucial Resistance

During the recent weekend, Avalanche (AVAX) witnessed a significant surge in selling pressure, resulting in a bearish breakout. As a consequence, the price of AVAX dipped close to a multi-month low of $13.8.

However, on the 24-hour chart, the altcoin displayed a slight upward movement, showing some appreciation. On the other hand, the weekly chart depicted lacklustre performance for AVAX.

The technical outlook for Avalanche remains bearish, as both demand and accumulation levels have remained low. The price action of AVAX has been influenced by the undecided nature of Bitcoin (BTC), which recently re-entered the $27,000 range.

This has caused other altcoins, including AVAX, to exhibit uncertainty on their respective charts. The overhead resistance level for AVAX holds significant importance, as surpassing this level could trigger a rally for the altcoin.

Conversely, if sellers exert further pressure, AVAX may break its consolidation and fall below its immediate support level, thereby strengthening the bearish sentiment.

Broader market strength is necessary for AVAX to reclaim its overhead ceiling. The decline in the market capitalization of AVAX indicates a decrease in buying strength at the current time.

Avalanche Price Analysis: One-Day Chart

Avalanche

At the time of writing, AVAX was priced at $14.70. It is currently trading in close proximity to its immediate resistance level of $15. A breakthrough above $15 has the potential to propel the altcoin towards $15.80 and ultimately $16.

The involvement of buyers in the market is crucial to generate demand and facilitate AVAX’s upward price movement. On the downside, if AVAX fails to sustain its current price level, it may find support at $14 before potentially trading below that level. The recent trading session showed a decline in the amount of AVAX traded, indicating the dominance of sellers in the market.

Technical Analysis

Avalanche

Throughout May and part of April, AVAX experienced consistently low buying pressure, reflecting a limited demand for the altcoin. The Relative Strength Index (RSI) was below the 40-mark, indicating that sellers had a greater presence than buyers at the time of writing.

Furthermore, the AVAX price fell below the 20-Simple Moving Average (20-SMA) line, demonstrating that sellers were the driving force behind the price momentum in the market.

A significant move above the $15 price level would help AVAX surpass the 20-SMA line, suggesting a potential shift in momentum and possibly attracting more buying interest.

Avalanche

Although AVAX recently returned to the $14 price zone, there are no clear indications of buying strength according to technical indicators.

The Moving Average Convergence Divergence (MACD), provides insights into price momentum. It formed only one green histogram, which does not necessarily signify buy signals at this point.

The Bollinger Bands, which reflect price volatility and fluctuations, have remained wide, indicating that the possibility of price fluctuations cannot be ruled out in the upcoming trading sessions.

Avalanche (AVAX) Trading Volume Skyrockets Amid Sustained Price Growth

Avalanche (AVAX) is gaining today as it seeks to retain its gains in the last 24 hours. Its trading volume is up by over 18% today, possibly sustaining its price recovery attempt.

Notably, AVAX entered the month of May with a bullish momentum trading at $16.66 on May 1, 2023. However, the bears have kept AVAX’s price at $14 since May 18. 

It now approaches the $15 price level seeking to rediscover its positive price form. The increased trading volume today implies that more activities are ongoing on the network.

This surging interest in the network might help AVAX sustain its uptrend.  A return to $21 remains likely for the asset in the long term.

AVAX Price Moves

AVAX is gaining today, forming a higher high on the daily chart. The bulls are intent on mounting a recovery rally. However, the bears are still active in the market.

Related Reading: How Does Current Bitcoin Rally Compare With Historical Ones?

Since AVAX still trades below its 50-day and 200-day Simple Moving Averages (SMA), the asset will likely see a further price decline in the short and long term. The SMA’s display sell signals prompting traders to take short positions in the market today.

However, some indicators are pointing to a price recovery for AVAX soon. For instance, the Relative Strength Index (RSI) is 38.53 and close to the oversold region. 

The RSI indicator mirrors the bearish trend that began on May 18, 2023, but the indicator is moving upwards, hinting at a potential trend reversal for the asset.  

Although the AVAX’s Moving Average Convergence/Divergence (MACD) is just breaking above its signal line and showing convergence, its histogram bars display small green bars hinting at a potential trend reversal to the upside. 

A close look at the chart structure shows that AVAX entered a downtrend on April 19, 2023. But it found support on May 22, sparking hope for a price recovery. 

What’s Ahead For Avalanche?

AVAX has found valuable support at the $14.29 price level, a pivot point for the asset. It is currently trading above its closest resistance level of $14.29. However, the bears are still active in the market, intent on keeping it below the next resistance level of $15.21.

Avalanche (AVAX) Trading Volume Skyrockets Amid Sustained Price Growth

From historical price behavior, AVAX pivoted on the $14.29 support on March 11, 2023, rallying to $21.29 on April 18, with dips in between. It replayed the same action on May 22 and will likely rally again to the $21 price level in the longer time frame.

Note that crypto assets are volatile and can deviate from historical price action. Therefore sound technical and fundamental analysis is essential for trading.

Featured image from Pixabay and chart from Tradingview.com

Avalanche Nearing Key Support, Is It Expecting Recovery Anytime Soon?

Avalanche (AVAX) has experienced a bearish week with several price floors being lost. However, in the last 24 hours, AVAX has moved up by 1.5%, suggesting a sideways trading session. The technical analysis indicates that bears still have control over AVAX, with decreased demand and accumulation.

Buyers have lost interest due to previous bearish influence. Bitcoin’s price has been indecisive, losing the $27,000 price zone. Major altcoins have followed this trend. Although BTC has shown some recovery, overall market weakness has impacted buyer sentiment in the altcoin market.

AVAX is currently trading near a crucial support level, and further selling pressure could lead to significant value loss in upcoming trading sessions. Buyers need to intervene for the price to initiate a recovery.

The market capitalization of AVAX has also declined, indicating increased selling strength on the chart.

Avalanche Price Analysis: One-Day Chart

Avalanche

At the time of writing, AVAX was priced at $15.40. Following a modest recovery, AVAX has surpassed the $15 threshold and is now positioned near its critical support level of $14. The altcoin faces resistance at the $16 mark, and if it manages to surpass this level, it could potentially reach $18 and subsequently $20.

Crossing $16 would signal increased strength for the bulls. Conversely, a decline from the current level would push the coin below $15 and eventually toward $14, strengthening the bears.

With a slight uptick in demand, AVAX may make an attempt to breach the $16 threshold. The trading volume for AVAX in the previous session was relatively low, indicating a reduced presence of buyers in the market.

Technical Analysis

Avalanche

Throughout this month, AVAX has lacked significant buying strength. Currently, the Relative Strength Index (RSI) is slightly above the 40-mark but below the half-line. Although there has been a slight increase in the RSI, sellers have been the driving force behind the price momentum in the market.

This aligns with the observation that the price of AVAX has fallen below the 20-Simple Moving Average line, indicating that sellers continue to drive the price momentum in the market.

Avalanche

Despite a slight price increase in the past 24 hours, AVAX still shows sell signals on the chart. The Moving Average Convergence Divergence (MACD), an indicator of price momentum and reversals, has formed red histograms, indicating sell signals for the altcoin. This suggests a potential price decline before a recovery.

The Bollinger Bands, which represent price volatility and potential fluctuations, have remained wide, indicating that AVAX can anticipate price changes in upcoming trading sessions.

The upper band serves as a price ceiling, aligning with the resistance level at $16.

AVAX Enters The Green Zone After Losing Gains As Bulls Gain Momentum

AVAX is trading in the $15 price range today, continuing its week’s price volatility. The bears seized control of its price action from April 19, 2023, forcing it down to $18.99. Since then, AVAX’s volatility has placed it between $17 and $15 as the bulls seek to regain control.

Notably, its trading volume is up by 34.13% in the last 24 hours despite the price fluctuations in the market today. It also recorded price gains earlier today, May 9, before dipping again by over 3%. 

AVAX Price Analysis

AVAX has resumed a downtrend as the bears and bulls compete to control the market. It is trading below its 50-day and 200-day Simple Moving Averages (SMA), with bearish sentiment in the short and long term. 

Related Reading: Bitcoin To Drop Further? Whales Show Signs Of Dumping

Also, the Relative Strength Indicator (RSI) is 35.84, close to the oversold region of 30 and bearish. However, the RSI’s direction is sideways, suggesting that the bears and bulls are even. 

AVAX’s Moving Average Convergence/Divergence (MACD) is below its signal line and shows a negative value confirming the prevalent bearish trend in the market. 

The current downtrend is similar to the previous trend between February 22 and March 13, 2023. If AVAX’s RSI moves to the oversold region of 30, a retracement to the upside is possible. 

AVAX encountered stiff resistance at the $17.67 level, sending the asset into a downtrend. Despite trading above the $16.35 resistance level yesterday, the bears pushed its price below the $15.85 support level.

AVAX Enters The Green Zone After Losing Gains, Are Bulls Coming To Rescue?

Since the $15.85 support could not hold, expect further decline for the asset to the $14.40 support if the bears persist. However, AVAX might rally if it enters into the oversold region.

Recent Developments In Avalanche Might Foster Price Reversal

The digital technology and intelligence arm of the Alibaba Group, Alibaba Cloud, formed a partnership with Avalanche. The main aim of this partnership is to create a Cloudverse Launchpad. Cloudverse will help users to launch and manage their Metaverse spaces hosted on the Avalanche blockchain.

Also, MUA DAO is the third organization included in this innovative partnership. They are the service layer for implementation and integration on Metaverse customization. As a result, Avalanche Subnets can be customized to fit various needs on the blockchain.

The Avalanche network developers believe that this partnership will demystify the creation of Metaverse since it makes the process quick and seamless. Also, developers on the Cloudverse will receive support for visuals, meta-economics, events, interactions, and operations.

Notably, Alibaba Cloud and Avalanche partnered earlier in December 2022 to provide the tools and infrastructure for Asian-based users to launch network validators. 

Alibaba Cloud has around 4 million customers and 10 million developers, increasing Avalanche’s exposure and likely boosting AVAX’s price.

Featured image from Binance and chart from Tradingview.com

Avalanche (AVAX) Climbs Higher: Q1 2023 Results Show Impressive Growth

According to the latest report by Messari, Avalanche (AVAX) has shown a strong rebound in the first quarter of 2023. The market cap of the blockchain platform increased by 65.8% quarter on quarter (QoQ), reflecting the broader market trend and the thaw of the crypto winter that took by storm the crypto industry in 2022. 

Avalanche’s Q1 2023 Performance

According to the report, Avalanche experienced a decline in daily average active addresses and transactions during Q1 2023. The 20.7% and 31.9% decline followed an anomalous spike and a high growth period of subnet activity in Q4.

However, the report also highlights that Avalanche’s supply of Bitcoin BEP2, a token on the Binance chain (BTC.b), increased by 64% during Q1, reaching over $250 million in market cap. This is a positive sign for the platform’s growth and demonstrates the increasing interest in Avalanche as a blockchain platform.

Avalanche

The report further notes that mainstream interest in Avalanche network infrastructure continued to grow during Q1, with partnerships with blockchain services (AWS) and Tencent Cloud, a secure, reliable, and high-performance cloud computing service. This demonstrates the growing recognition of Avalanche as a major player in the blockchain space.

In addition, Avalanche launched several notable developments during Q1 aimed at ushering in developers. These include the launch of HyperSDK, Glacier API, and integration with The Graph. These developments are expected to increase the adoption of Avalanche as a blockchain platform and attract more developers to build on the platform.

The Avalanche Effect

According to Messari,  Avalanche’s Total Value Locked (TVL) denominated in USD increased by 4.2% QoQ in Q1 2023, following the crypto market relief rally in January. However, TVL denominated in AVAX declined by 34.3%, suggesting that the increase in USD was due to asset price increases rather than new capital inflow.

Avalanche

Despite this decline, liquid staking derivatives (LSDs) and yield farming platforms supported Avalanche and its DeFi ecosystem. Benqi liquid staking TVL grew by 88.6% QoQ to $100 million by the end of Q1, and Vector Finance, a yield optimization platform, increased by 50% QoQ to $36 million. Collectively, these two protocols finished Q1 in the top 10 by TVL, with ~$136 million in TVL.

Avalanche’s most prominent protocol by TVL denominated in USD, Aave, was down slightly 5% QoQ, but Benqi Lending, Trader Joe, and GMX grew by 49%, 24%, and 70%, respectively. However, there remained concentration risk in the leading application, with Aave making up 43% ($432 million) of Avalanche’s DeFi TVL by the end of Q1.

Avalanche Validators Show Volatility

According to the report,  Avalanche’s network health remained stable in Q1 2023, with the average number of validators, total stake, and average engaged stake remaining consistent. However, the average number of delegators grew by 26.1% QoQ, indicating increasing participation in the network.

Despite the stability of stake across a greater number of validators and delegates, there was some volatility in the number of validators that went offline during Q1. Both the average amount of unresponsive stakes and the number of unresponsive validators increased by over 70% QoQ. However, the percentage of unresponsive stakeholders and validators remained high enough to sustain block production.

Overall, the Messari report indicates that Avalanche’s network health remained stable in Q1 2023, with consistent numbers of validators, total stake, and average engaged stake. The growth in the number of delegators also suggests increasing participation in the network. 

While there was some volatility in the number of validators that went offline during Q1, the percentage of unresponsive stakes and validators remained high enough to sustain block production. These findings demonstrate the continued growth and resilience of the Avalanche network and its potential for further expansion and adoption in the blockchain space.

Avalanche

Featured image from Unsplash, chart from TradingView.com

Avalanche Struggles Under $18 – More Losses Seem Likely

Over the last few days, Avalanche has experienced significant losses, plunging by almost 20%. On a weekly timeframe, AVAX has lost 10% of its market value. Although the daily timeframe indicates that AVAX has made a slight upward movement on its chart, with an appreciation of 1.6%, the technical outlook for Avalanche remains bearish.

Buyers have been cautious about price movements while sellers have dominated the market, leading to a decrease in both demand and accumulation on the daily chart. In order for the Avalanche price to experience some relief, it needs to break above the $18 mark.

However, the $17 price level has acted as a supply zone for the altcoin. If bulls cannot defend the current price mark of the altcoin, the bears may take full control of the asset’s price.

Similar to other prominent altcoins, major market movers have been struggling to break their crucial resistance levels. The decline in AVAX’s market capitalization indicates a decrease in buying pressure in the market.

Avalanche Price Analysis: One-Day Chart

Avalanche

At the time of writing, AVAX was priced at $17.17. The immediate resistance for the altcoin was at $18, and if breached, could lead to a push towards $19, thereby strengthening the bulls.

However, if Avalanche continued to trade sideways, a fall below the $17 level was expected. In such a case, the next support level for the asset was $15.

The altcoin’s recovery was dependent on buyers stepping in to push its price above the $18 mark. The recent amount of AVAX traded was red, which suggested an increase in selling pressure in the market.

Technical Analysis

Avalanche

Over the past week, there has been a significant drop in demand for the altcoin, leading to a decline in its value. Despite efforts by bullish investors to regain buying strength, it is essential to surpass immediate resistance to make progress.

The Relative Strength Index indicates that sellers outnumber buyers, with the index below the 50-mark. Though there has been a minor upswing, the bearish influence continues to dominate.

Additionally, the AVAX price remains below the 20-Simple Moving Average, indicating that sellers are gaining momentum and steering the market’s price action.

Avalanche

In addition, further technical indicators suggest that bearish momentum is prevailing. The Moving Average Convergence Divergence indicator shows the price momentum and reversals in the market. On the one-day chart, red histograms have formed, indicating sell signals.

The Directional Movement Index determines the price direction, and currently, the -DI line (orange) is above the +DI line (blue), resulting in a negative DMI reading. The Average Directional Index (red) is above the 20-mark, indicating that the price momentum is gaining strength.

Avalanche Partners With Amazon, What’s Next For The Price?

Avalanche and its dApp ecosystem shall now be supported by Amazon Web Services (AWS), which also comprises one-click node deployment through the AWS marketplace.

With this partnership with AWS, Ava Labs can help customers deploy custom offerings linked to over 100,000 partners spread across 150 countries.

Technically, the Avalanche node operators can operate in AWS GovCloud for the FedRAMP compliance use case, which is an essential pre-requisite for many enterprises and governments.

This partnership will help scale blockchain adoption among many enterprises, government organizations, and other institutions.

Howard Wright, the VP and Global Head of startups at AWS, stated:

Looking forward, web3 and blockchain are inevitable. No one can call the time or date or quarter that it’s going to happen and it’ll be mainstream, but we’ve seen the cycles of growth before. The velocity of this one seems like it’s accelerating and we’re just excited to be a part of this.

Through the partnership, individuals will find it much easier to launch and manage nodes on Avalanche; additionally, it will strengthen and make the network more flexible for developers to work on. This new development has positively affected the altcoin’s price, but it is yet to be seen if the coin can sustain this price sentiment.

Avalanche Technical Analysis

Avalanche

The news of AWS being incorporated into the Avalanche ecosystem has instantly spiked investor interest. The daily chart of AVAX displays a 6.6% gain, which can be termed a rally.

This has made the coin break past the $13.60 resistance level, and now AVAX is valued at $14.40. It is yet to be seen if the coin manages to breach the $15 mark, acting as a resistance mark for the coin. A fall from the current price will bring the altcoin down to $13.70.

The Relative Strength Index was overbought, which means the asset was overvalued. The overvalued condition can be attributed to the newest development. Usually, once the asset is overbought, the price corrects itself.

Due to bullish sentiment, AVAX shot past the 20-Simple Moving Average line (SMA), indicating that buyers have been driving the price momentum in the market. Not just the 20-SMA, the altcoin was parked above the 50-SMA due to excessive demand.

Avalanche

The Moving Average Convergence Divergence suggests price momentum and a trend reversal. The indicator formed a few green histograms, which are buy signals for the coin. The most recent histogram increased in size, anticipating the rise in the price of the asset.

Investors could quickly take this as a signal for entry as the price would increase over the next few trading sessions before it started to retrace.

The Directional Movement Index reads the price direction, and it was bullish. The +DI line (blue) was above the -DI line (orange).

The Average Directional Index (red) was near 20 with a slight uptick, confirming that although the price witnessed a northbound movement, the price direction lacks substantial strength.

AVAX Value Drops By 2% Following Grayscale Removal of Avalanche From Large Cap Fund

In its latest quarterly update, Grayscale announced the rebalancing of funds for the fourth quarter of 2022. As part of the rebalancing, Grayscale sold off a certain amount of its Digital Large Cap Fund and dumped its held tokens, including Avalanche Network token AVAX.  

AVAX has slipped by 2% following the sell-off in the past 24 hours. According to Grayscale, the sold-off AVAX tokens were replaced with the purchase of the existing fund components in proportion to their respective weightings.

Grayscale Purchased And Existing Tokens

The AVAX sell-off was only part of the CoinDesk Large Cap Select Index and Grayscale Digital Large Cap Fund. In its CoinDesk Smart Contract Platform Select Ex ETH Index and Grayscale Smart Contract Platform Ex-Ethereum Fund portfolio rebalancing, the company sold off Algorand native token ALGO.

In its CoinDesk DeFi Select Index methodology, Grayscale adjusted its DeFi Fund’s portfolio and purchased Synthetix (SNX) after selling some existing assets. 

As of now, the Grayscale portfolio fund now includes 65% Bitcoin (BTC), 30% Ethereum (ETH), 1.86% Cardano (ADA), 1.39% Polygon (MATIC), and 1% Solana (SOL). Meanwhile, its DeFi Fund’s Fund Components include  65.05% Uniswap (UNI), 12.39% Aave (AAVE), 8.15% MakerDAO (MKR), 6.02% Synthetix (SNX), 4.58% Curve DAO Token (CRV), and 3.81% Compound (COMP). 

Since July, Grayscale has been carefully monitoring the CoinDesk Large Cap Select Index. The index launched in April tracks the market capitalization-loaded performance of “the largest and most liquid digital assets.”

During Grayscale usage of the Index, the quarterly scheduled rebalancing resulted in the dumping of Bitcoin Cash (BCH), Litecoin (LTC), Chainlink (LINK), Polkadot (DOT), and more Uniswap (UNI) purchases.

AVAX Slips After Grayscale Dumped

Before the sell-off, AVAX was still sitting at a $12 zone; however, after Grayscale dumped its holdings, the AVAX token dropped by 2% and traded at $11.39 Friday morning. 

AVAX has appreciated over the past months. It has surged from around $9 to $13. Notably, Grayscale fund’s portfolio, which currently has $163 million in assets under management (AUM), only held a small portion of AVAX tokens. As of September 30, AVAX made up less than 1% of the company’s fund’s assets, according to its previous quarterly report.

There was no significant move from ALGO, which was also removed from the Grayscale portfolio fund. It fell from a range of $0.17 to $0.15. As of the time of writing, ALGO currently trades at $11.73 with a 24-hour trading volume of $45 million. 

AVAX price chart on TradingView

On the other hand, AVAX seems to be gaining momentum to the upside at the time of writing as it has already formed a retracement; a reversal is likely to happen. AVAX currently trades at $11.73, down by 0.8% in the last 24 hours, with a trading volume of $125 million over the same period.

AVAX Eyes The Next Resistance, Is It Time To Go Long?

The Avalanche (AVAX) price has been undetermined for quite a number of weeks now. The altcoin is now logging gains on the daily chart as it rose over 3% in that time frame. The coin shows signs of optimism ever since it moved up from the $12.90 support mark.

The technical outlook for AVAX displayed signs of demand and buy signals for traders. If demand continues to rise and buying sentiment increases over the immediate trading sessions, the chance of AVAX piercing through other resistance levels will strengthen further.

As the coin continues to secure higher highs and higher lows, the bulls still remain in charge of the asset. However, if AVAX starts to consolidate below the $13 price level, then the altcoin can register depreciation.

Progressive price momentum demands AVAX breach the $14.30 resistance mark. Once AVAX successfully manages to challenge that level, the bulls will stick around for longer. The market capitalisation of the altcoin already registered an upsurge which is tied to an increase in accumulation.

Avalanche Price Analysis: One-Day Chart

Avalanche

The immediate overhead price ceiling that Avalanche price needs to breach stood at $13.90. This move would ensure another rally to $14.60. Once the coin moves past that level, accumulation will increase considerably.

Traders had ample entry points in the market; for instance when AVAX dipped to $12. Over the upcoming trading sessions, investors can manage to see returns on the chart.

On the other hand, if due to lack of demand AVAX starts to consolidate, the next level for the coin would be at $12.20 and then to $11. This would mean an 18% fall in price for AVAX.

AVAX was trading at $13.48 at the time of writing.

AVAX Technical Analysis

Avalanche

Although the technical outlook pointed to positive price action, demand slightly fell on the daily chart. The Relative Strength Index (RSI) just dipped a little and rested on the half-line. This meant that buying power and selling strength were even.

Other indicators have, however, sided with increased demand. The altcoin was above the 20-day Simple Moving Average as it crossed the $13.40 price mark. This was an indication that the buyers were still driving the price momentum in the market.

Avalanche

Despite the RSI remaining neutral, other indicators have depicted that bulls were still fighting to push the price above $13.60. The Moving Average Convergence Divergence defines the price momentum and trend reversal.

Related Reading: Ethereum Active Addresses At Highest Since May 2021, Good News For ETH?

MACD underwent a bullish crossover and that meant a buy signal for traders which could also correlate with an incoming increase in price for the coin. The Parabolic SAR determines the price direction. The indicator formed dots below the price candlestick which suggested an uptrend for Avalanche price.

Avalanche Price Can Gain Further Momentum If The Bulls Barrel Past $19

Avalanche price has shown bullish strength over the last 24 hours. It has been one of the few altcoins that have remained positive despite most altcoins losing value over the past day.

In the past day alone, the altcoin has appreciated by close to 4%. In the last week, AVAX rallied over 16%.

It is important that Avalanche continues to race upward for positive price action to remain in the market. The technical outlook for the coin showed that bulls were in complete control of the asset.

Demand for the coin jumped north and buying strength kept registering northbound movement on the chart. The chance of a price pullback cannot be ruled out just yet.

It is crucial for AVAX to move past the $19 price mark. Going past this price mark will help Avalanche price remain bullish.

Tough resistance for Avalanche was at $19.60, and moving past that would make it easy for the coin to touch the $20 price level.

The global cryptocurrency market cap today is $1.06 trillion, with a 0.0% change in the last 24 hours.

Avalanche Price Analysis: One-Day Chart

Avalanche Price

Avalanche was priced at $18.90 on the one-day chart | Source: AVAXUSD on TradingView

AVAX was trading at $18.90 at the time of writing. The bulls are trying hard to move past the immediate resistance mark for the coin.

By doing so, Avalanche will be under a bullish influence over the next trading sessions. Overhead resistance for the coin stood at $19.07 and then at $19.60.

Crossing these two hurdles will take AVAX to the $20 price mark. On the flip side, if AVAX has to lose its current price level, it could be dragged down to $17.

Beneath the $17 price mark, the coin would fall close to $16. The amount of Avalanche traded in the past trading sessions indicates that the coin has registered increased buying strength.

Technical Analysis

Avalanche Price

Avalanche registered considerable buying strength on the one-day chart | Source: AVAXUSD on TradingView

The altcoin’s buying power was last as strong as it is now in the month of August. That signified a multi-month high in the number of buyers.

The Relative Strength Index zoomed past its half-line and was almost about to enter the overbought zone as it was heading close to the 80-mark.

Avalanche price was above the 20-SMA line, signifying that demand had increased for the coin and buyers were driving the price momentum in the market.

Avalanche Price

Avalanche noted buy signal on the one-day chart | Source: AVAXUSD on TradingView

AVAX has said that buyers were quite positive at the time of writing. The coin registered buy signal on its one-day chart.

Moving Average Convergence Divergence indicates the price momentum and direction of the asset.

The MACD was positive as it pictured green histograms above the half line, which also acted as the buy signal for the coin.

The Chaikin Money Flow suggests the quantity of capital inflows and outflows on the chart. CMF was on the zero line, meaning an even amount of capital inflows and outflows.

Featured Image From Shrimpy Academy, Charts From Tradingview

Avalanche Price Remains Positive But Could Experience Bearish Pull At This Level

Avalanche price has depicted positive movement over the last 24 hours. Over the past 24 hours, the coin has appreciated by 3%.

In the last week, AVAX shot up in double digits, which helped the coin break its sideways trading.

The bulls now have control of the coin, but the altcoin is expected to break past a few trading levels to ensure that the bullish momentum continues on the chart.

The technical outlook was also on the side of the bulls because Avalanche had gained buyers ever since it started to move up on its chart.

The demand for the altcoin has also helped AVAX to slowly climb above its resistance mark, which now acts as a support for the coin.

The coin’s strong support was at $15 at the time, but once it broke through, there could be some resistance between the $18 and $19 price range.

If demand for AVAX remains constant, it might manage to topple those levels, which could help the altcoin to break free from lateral trading.

The global cryptocurrency market cap today was at $1.03 trillion, with a 0.8% negative change in the last 24 hours.

Avalanche Price Analysis: One-Day Chart

Avalanche Price

Avalanche was priced at $17.76 on the one-day chart | Source: AVAXUSD on TradingView

AVAX was trading at $17.76 at the time of writing. The altcoin has experienced significant resistance at the $17 mark, but the bulls have now managed to stay above that price level.

To continue the bullish thesis, Avalanche has to move past the $18 price mark, which acts as the immediate resistance for the coin.

There could be a chance of the coin experiencing a lack of demand at that price level.

Once AVAX breaks past $18, it is a clear path to $20.

On the other hand, if the price retraces, AVAX could briefly stay above the $16 price mark before it falls to the $15 price level.

The amount of Avalance traded in the last session was positive, signifying that buying strength was also on the increase.

Technical Analysis

Avalanche Price

Avalanche registered increased buying strength on the one-day chart | Source: AVAXUSD on TradingView

Buying pressure for Avalanche price registered a steep recovery on the one-day chart. Buyers came straight back into the market as AVAX logged gains.

The Relative Strength Index was positive as the indicator barreled up above the half-line, signaling that buyers have taken over the altcoin.

Avalanche price were also above the 20-SMA line, which is considered bullish due to increased demand. Buyers were driving the price momentum in the market.

Avalanche Price

Avalanche displayed buy signal on the one-day chart | Source: AVAXUSD on TradingView

Avalanche price also displayed buy signal for the coin on its chart, indicating that if buyers act on it, the coin can move north again.

The Awesome Oscillator indicates the price momentum and the strength of the price movement. AO was positive as it pictured green histograms that also represented the buy signal for AVAX.

Bollinger Bands show price fluctuation and the chances of further volatility. The bands were super constricted on the chart. This sign is often accompanied by explosive price action over upcoming trading sessions.

Featured Image From Vecteezy, Charts From TradingView

Avalanche Struggle To Break Downtrend, Is $20 Mark Possible?

  • AVAX price ranges below 50 and 200 EMA on the daily timeframe. 
  • Price continues to maintain a downtrend as it aims to break out to the $20 range.
  • AVAX price closes attempting to break out of its downtrend on low timeframe. 

Avalanche (AVAX) price has failed to sustain its head high above the blood bath of the bear market against tether (USDT). With what proved to be a major run for the price of Avalanche (AVAX) from a low of $10 to a high of $145, many predicted the AVAX project causing a major upset for many crypto projects. The statistics from the coupled Consumer Price Index (CPI) and Federal Open Market Committee (FOMC) have affected the market negatively, with AVAX prices not exempted. (Data from Binance)

Avalanche (AVAX) Price Analysis On The Weekly Chart 

The price of AVAX has continued to decline as there seems to be no hope of a major bounce after losing its weekly support of $25 as the price looks to reclaim its $10 support on the weekly chart.

The price of AVAX continues to hold above a key support area of $10; the price of AVAX needs to break its downtrend that has been maintained for weeks. A break would see the price retesting $20-$25. 

For the price of AVAX to restore its relief, the price needs to break and hold above the $20 resistance preventing the price of AVAX from trending higher. If the price of AVAX keeps rejecting $20, we could see the price going lower. 

Weekly resistance for the price of AVAX – $25.

Weekly support for the price of AVAX – $15-$10.

Price Analysis Of AVAX On The Four-hourly (4H) Chart
Four-Hourly AVAX Price Chart | Source: AVAXUSDT On Tradingview.com

In the 4H timeframe, the price of AVAX continues to range in a downtrend line as the price attempts to break out. This could signal a relief bounce on a low timeframe.

The price of AVAX trades at $17.4 below the 50 and 200 Exponential Moving Average (EMA), acting as resistance for AVAX price. The price of $17.7 and $20 corresponds to the resistance at 50 and 200 EMA for the price of AVAX. The price of AVAX needs to reclaim 200 EMA for a chance to trend to $25-$30. 

Four-Hourly resistance for the AVAX price – $20-$25.

Four-Hourly support for the AVAX price – $17-$15.

Onchain Analysis Of AVAX
AVAX On-chain Analysis | Source: AVAXUSD On Messari.io

Although many investors and projects are building on the Avalanche network, it has experienced a difficult time in terms of price during the bear season. The price of AVAX, based on the on-chain data, is beginning to see a little relief over the last 24 hours compared to previous weeks.

Featured Image From Daily Hodl, Charts From Tradingview and Messari

Avalanche Plays A Game Of Bounce Or Die, Can Bulls Win This Fight?

Avalanche (AVAX) price continues to hold key support against tether (USDT) as price finds itself amid death or survival. The crypto market has become promising as most altcoins appear bullish coming out of their shells, but the likes of Avalanche (AVAX) price continue in their struggle to survive. (Data from Binance)

Avalanche (AVAX) Price Analysis On The Weekly Chart 

The price of AVAX has had a tough time replicating the move from a weekly low of $16 to a high of $30 as the price continues to remain dormant with little price action. In recent weeks, the price of AVAX showed so much strength rallying to $30 before being rejected, and the price has failed to hold above $22, acting as an area of interest. 

AVAX price was not able to break out of the downtrend channel, forming a strong bullish bias as the crypto market could be set for a minor rally. 

The price of AVAX saw a rejection from $25 and has struggled to reclaim this region; for AVAX to have a chance of trending higher, the price needs to reclaim $25 and flip it into a support for the price to trend higher.

If the AVAX price maintains this bearish structure, we could see the price of AVAX retesting the weekly low of $17, serving as good support for buy orders.

Weekly resistance for the price of AVAX – $25.

Weekly support for the price of AVAX – $17.

Price Analysis Of AVAX On The Daily (1D) Chart
Daily AVAX Price Chart | Source: AVAXUSDT On Tradingview.com

After retesting the daily low, AVAX’s price bounced but was unable to trend higher due to more bearish signs indicating exhaustion. The price of AVAX must hold its key support at $14; if the price of AVAX fails to hold this support, the price may fall to its daily low.

AVAX’s price has continued to fall, indicating that more sell orders have been placed.

On a daily basis, AVAX is trading at $18.4 below its 50 and 200 Exponential Moving Averages (EMA). AVAX price is being held back by prices at $22 and $38, which correspond to the 50 and 200 EMAs.

Daily (1D) resistance for the AVAX price – $22, $30.

Daily (1D) support for the AVAX price – $14.

AVAX Price Analysis On The One Four-Hourly (4H) Chart
Four-Hourly AVAX Price Chart | Source: AVAXUSDT On Tradingview.com

The price of AVAX in the 4H timeframe remains bearish, with the price forming a more bearish continuation pattern while trading below the 50 and 200 EMAs, which act as support.

The price of AVAX trades below the 50 and 200 EMA, and if it fails to hold the support at $16, we could see the price trend lower; if the price of AVAX bounces from its current value, we could see the price retest the $20 mark.

On the 4H chart, the Relative Strength Index (RSI) for AVAX is below 40, indicating more sell order volume for the AVAX price.

Four-Hourly (1H) resistance for the AVAX price – $20.

Four-Hourly (1H) support for the AVAX price – $16.

Featured Image From Currency, Charts From

Avalanche Price Steadies Above $22, Could Attempt To Touch $26

Avalanche price action has remained bearish on the chart at the time of writing. AVAX has maintained the price above its support line of $22. Right after the coin surged and revisited the $24 mark, it started to retrace on its chart.

This is a price correction as Avalanche price showed appreciation over the last two weeks. At the moment Avalanche is witnessing a profit booking which has caused buying strength to fade away over the last few days.

Incase Avalanche price manages to push above the $25 price zone, the bullish force might gain strength. Buyers can again find their way back to the market if AVAX falls on its chart which in turn could trigger another rally.

Broader crypto market strength also remains low with BTC crawling below the $23,000 price mark. Ethereum too extended losses over the last 24 hours. Most altcoins followed the same price trajectory.

For Avalanche price to reclaim its immediate resistance of $24.8, strength from buyers remain crucial. The global cryptocurrency market cap today is at $1.1 Trillion with a 2.5% fall in the last 24 hours.

Avalanche Price Analysis: Four Hour Chart
Avalanche was priced at $23.12 on the four hour chart | Source: AVAXUSD on TradingView

AVAX was trading at $23.12 at the press time. It displayed a correction after it witnessed a rally in the past two weeks. Immediate support for the coin was at $22 and continued selling pressure could push Avalanche price to $21.

Overhead resistance for Avalanche was at $24.8, a break above that level could catapult Avalanche price to $26. The coin has been struggling to break past the aforementioned price level for multiple weeks now.

At the moment, sellers have flocked the market for profit booking as Avalanche price registered an upswing just two weeks ago. The volume of Avalanche traded in the past session was less compared to the session before that. This could hint towards fall in buying strength.

Technical Analysis
Avalanche displayed fall in the number of buyers on the four hour chart | Source: AVAXUSD on TradingView

The altcoin’s buying strength was low on its chart. The recent profit booking was the reason why sellers outnumbered buyers. Technical indicators signalled the same reading. The Relative Strength Index was parked a little below the half-line which meant that selling pressure was higher than buying pressure.

Avalanche price peeped slightly above the 20-SMA line, this could be a mixed signal. A reading above the 20-SMA means bullish, a reading below that means sellers were driving the price momentum in the market.

Avalanche flashed buy signal on the four hour chart | Source: AVAXUSD on TradingView

The other technical indicators painted a mixed signal. The Chaikin Money Flow that is concerned with the capital inflows and outflows was seen to be in a positive zone. CMF’s reading above the zero-line indicated that capital inflows exceeded outflows at the time of writing.

Moving Average Convergence Divergence depicts the price momentum and change in price direction. MACD also underwent a bullish crossover and formed green histograms. Green histograms were signs of buying signal for the coin. This also meant that if buyers acted on it, AVAX would register gains.

Featured image from Kalkine Media, chart from TradingView.com

TA: AVAX Struggles To Hold Above Resistance As It Eyes $40

Avalanche (AVAX) struggles to hold above key support that will set the tone for a rally to the $40 mark region anticipated by many.

The price of Bitcoin (BTC) saw a retracement as it could not break and hold above important support that corresponds with the daily 50 exponential moving average (EMA). BTC’s unable to hold that region has led to AVAX struggles to form good support. 

Avax Weekly Chart Analysis
Avax Weekly Chart Analysis | Source: AVAXUSDT On Tradingview.com

The weekly chart for Avax shows a downtrend reversal to a low of $16.3, where buyers were more willing to step into the market.

The chart shows the price of Avax needs to break and close above $23.7 for it to resume its bullish movement to the $40 mark price anticipated by investors.

Avax has formed strong support at the $16.3 mark area, with more buyers willing to place bids in this region. This region can be seen as a good demand zone should the price of Avax retraces back to the current price.

Major resistance on the weekly chart – $23.7

Major support on the weekly chart – $15

Avax Daily Chart Analysis
Avax Daily Chart Analysis With A Triple Bottom Trend Reversal | Source: AVAXUSDT On Tradingview.com

The daily chart for Avax price shows it is struggling to reclaim the 50 exponential moving average (EMA); this corresponds to a key resistance stopping the price of Avax from rallying higher.

Avax on the daily chart has good support at around $16.3 with a triple bottom formation.

A triple bottom is a bullish trend reversal formation that allows investors to accumulate more crypto assets.

With the price of Avax breaking above the 50 EMA and closing above this region would be good for bulls to push this price higher. The cost of Avax is trading below the 200 EMA, which could act as the Idea resistance for Avax when there is a clear breakout above the 50 EMA.

The price of Bitcoin is trying to reclaim the $24,000 region, which has proved difficult; a reclaim and close above this resistance with good volume would allow the price of Avax to rally with good buy volume.

The daily chart’s volume and relative strength Index (RSI) looks good, with the RSI above the 50 mark area.

Daily resistance – $24.7.

Daily support – $20.5.

Avax Price Analysis On The 4H Chart
Avax On The 4H Chart With A Symmetric Triangle Bullish Formation | Source: AVAXUSDT On Tradingview.com

The price of Avax on the 4H chart shows the price has reclaimed both the 50 & 200 EMA, indicating an upward trend if all market conditions remain favorable.

Avax on the 4H chart has resistance at $25.43, trying to build and break out of a bullish symmetric triangle. A break and close above the triangle would signal a good rally for Avax.

The volume of Avax shows buyers are stepping into the market after a series of panic sales due to market decline.

Avax has a relative strength Index above the 50 mark showing good signs of buy orders in the market.

Should Avax fail to go higher in the price above $25.43, a pullback is expected to the support that corresponds with the 50 EMA.

Resistance on the 4H chart – $25.42.

Support on the 4H chart – $23.4.


Featured Image From Finbold, Charts From TradingView.com

Top Analyst Predicts 60x Profits For Polygon, Cosmos, And Avalanche

The crypto market is trending to the upside and recovering some of its last week’s gains with Polygon (MATIC), and other altcoins following the general trend. Digital assets seem to be positively reacting to the earnings reports from legacy companies.

Related Reading | Why The IMF Thinks The Crypto Market Could See “Further Selloffs”

At the time of writing, Amazon (AMZN) beat earnings expectations generating over $130 billion in net sales. Apple (AAPL) also beat expectations with $83 billion reported in earnings.

Amazon +10% pic.twitter.com/T4twX73AKG

— TradingView (@tradingview) July 28, 2022

 As a result, the S&P 500 recorded a 1.23% increase at the U.S. close with the Nasdaq and the Dow Jones trading in the green. The crypto market benefited from these reports, as it continues to move in tandem with legacy financial markets.

Top crypto analyst Michaël van de Poppe celebrated AMZN and AAPL’s positive price moves. The analyst believes the price action in equities will continue to spill into the crypto market. Via Twitter, van de Poppe said:

we’re definitely ready for fireworks (…). The entire market looks ready to continue moving heavily.  Many altcoins & Bitcoin breaking above 50-Day Moving Average. Bitcoin breaking above 200-Week Moving Average. Looks to me to see a continuation on those altcoins for 100-200%.

The analyst singled out Solana (SOL), Polygon (MATIC), Cosmos (ATOM), Avalanche (AVAX), and others with the best potential to benefit from a long-term bullish trend. These cryptocurrencies have the potential to record 60x returns “in the next bull cycle”, van de Poppe said.

In the short term, as mentioned above, these altcoins could register as much as 100% to 200% gains if the bullish momentum extends. The analyst claims most of these altcoins have broken above key moving averages and might find little resistance as they reclaim previously lost territory.

According to this analyst, Avalanche (AVAX) alone could hit a target of $37 to $41. Solana on the other hand might hit $62 to $84 and Polygon beyond the $1 mark.

MATIC’s price records important gains on the 4-hour chart. Source: MATICUSDT Tradingview
Can Polygon (MATIC) Benefit From A Crypto Summer Rally?

The analyst claims the crypto market stands to benefit from a relief rally on the back of a dovish U.S. Federal Reserve (Fed). The financial institution has been trying to mitigate inflation by hiking interest rates, and according to market expectations, this metric should trend lower in its July print.

In addition, the Ethereum “Merge” was set for September 2022. This event is considered highly bullish for the cryptocurrency which has provided ETH bulls with enough strength to push the market to the upside.

Related Reading | Bitcoin Makes Surprise Climb As Fed Discloses 0.75 Point Rate Bump

Polygon (MATIC), Avalanche (AVAX), Solana (SOL), and Cosmos (ATOM) might prove good bets in the long run due to the upcoming products, their partnerships with major players in and outside the crypto industry, and their development teams.

Ideal ingredients for a Summer Relief Rally are there:

Powell becoming dovish on policy and more data-dependent.
$ETH merge coming up in September.
Heavy impact on 3AC, Celsius, and more already priced in.

I’m seeing $ETH to $2,400 and $BTC to $28,000-30,000.

— Michaël van de Poppe (@CryptoMichNL) July 27, 2022 

Solana And Avalanche Poised For Gains As Crypto Market Enjoys New Tailwinds

Over the past several days, the market has been favorable for cryptocurrencies, which has given them a significant boost. Two of the currencies that have seen a considerable increase over the past seven days are Solana (SOL) and Avalanche (AVAX). Investors are also optimistic as a result of the cryptocurrency market’s recent growth trends.

According to CoinGecko data, SOL is currently trading at $45.04 and has experienced a significant 7-day rise of 37.2 %. While it is still down 82% from its peak of $259.96 on November 6, 2021, approximately nine months ago.

Related Reading | An Interview with Ben Caselin on AAX- Lightning Network Integration and TARO Protocol Implementation

With a spectacular rise of 49.4% over the past seven days, AVAX excelled. As a result, its current price, $25.29, has increased by 5.8% during the last 24 hours. It is also 82% below its ATM of $144.96 on November 21, 2021, which was eight months ago.

The Crypto Market Shows Signs Of Recovery

“Crypto winter” is without a doubt the phrase that every crypto trader is uttering right now. After reaching a high of $3 trillion in 2021, the market capitalization of cryptocurrencies had a sharp decline, down to $1 trillion, a loss of around $2 trillion.

In the history of cryptocurrency, there have been a number of well-known bear markets. Still, the one in 2022 is particularly noteworthy due to the extreme testing of decentralized financial systems and the excessive use of trading leverage. However, the intense storm is now gradually winding down.

SOL is currently trading at $45 on the daily chart | Source: SOLUSDT From Tradingview

Along with other encouraging economic data, the recent increase in cryptocurrency prices in mid-July suggests that the bear market is slowly reversing and that the cryptocurrency industry is on the way to recovery. 

Solana And Avalanche On Recovery 

Most coins strive to become better ones of themselves in order to find fortune and increase in value. As these cryptocurrencies grow, investors will view them as more reliable, which will boost their attractiveness.

That is why Avalanche’s (AVAX) recent price rise may be gearing up to reclaim its worth. The crypto community believes the Avalanche currency may make a comeback this month as it has just achieved a solid recovery from its June low of $13.

AVAX is a blockchain system that is rising in recognition as an Ethereum rival. The coin has also shown that it has the capacity to succeed as well as the resources needed to recover even under pressure.

Related Reading | Ethereum Merge: How ETHBTC Could Hint At A Return Of Risk Appetite

On the other hand, the well-known blockchain network Solana (SOL) has made a strong comeback from its $25 low in June. Additionally, it still needs assistance to recover its value and reach a high of $95 in May.

Furthermore, according to a group of fintech experts from Finder.com, Solana (SOL) will see a value increase to $45 by the end of 2022. The panel forecasts that SOL will be valued at around $166 in 2025 and $512 in 2030.

Featured image from Flickr, chart from Tradingview.com

Here Are The Crypto Leading The Market Recovery With 50% Gains

The crypto market has managed to sustain its bullish momentum and reclaimed the $2 trillion market cap. Bitcoin and Ethereum seem to have pushed the market from the mid $30,000, and to its current levels.

Related Reading | Only In Crypto: A Croissant Explains Ethereum Hottest Trends Post Merge

The first and second crypto by market cap has seen a surge of new bullish narratives. The upcoming “Merge” and Bitcoin has pristine collateral seem to have provided additional support for the current momentum.

Both ETH and BTC recorded around 17% profits in the last week, as the crypto market moves upwards. However, Delphi Digital recorded layer-1 cryptocurrencies with gains surpassing 50% in a 30-day period.

Near (NEAR) stood among the latter and led the current market recovery, followed by Polkadot (DOT), and Terra (LUNA). As seen below, Binance Coin (BNB), Solana (SOL), Avalanche (AVAX), Cosmos Hub (ATOM), and others were in the best performer group.

Source: Delphi Digital via Twitter

Delphi Digital noted the following on NEAR’s current bullish momentum:

NEAR led the L1 recovery by growing by ~50% over the past month, a significant lead against the rest. The outperformance over the past week was catalyzed by the Bastion Lockdrop, which attracted $293M in capital. NEAR, WBTC, ETH, USDT, USDC were available to be locked for 1-12 months.

Avalanche (AVAX) records a 10% profit in the last week with a 37% profit in two weeks. In addition, Avalanche records an explosion in daily active users in a 6-month period.

This metric has been hovering around 100,000 since Q4, 2021. This suggests a growing interest for Avalanche as the price push to the upside. Delphi Digital noted:

When looking at the delta in this data, the strong relationship between AVAX price and active addresses immediately becomes recognizable. It is not often that price increases sustainably without metrics such as TVL and daily active addresses also increasing.

Source: Delphi Digital via Twitter
What Could Add More Fuel For This Crypto Rally

In the short term, the crypto market could see a brief pullback. Indicators point to overbought levels across the board, but bulls have been able to preserve their strength.

According to Delphi Digital, the long to mid-term could stay in the green for Avalanche (AVAX). In addition to its fundamentals, the crypto platform recently launched a $290 million multiverse incentive program, and it will be integrated with Terra.

The moon is coming to #avalanche in force, and next week we will show you just how much 🌕@avalancheavax @terra_money 🪄

— Do Kwon 🌕 (@stablekwon) March 18, 2022

The research firm believes the biggest AVAX catalyzer is the implementation of its subnet functionality. This should increase Avalanche’s use case and scalability and potentially inject more conviction into a double-digit rally. Delphi Digital noted:

Important to keep in mind is that each subnet validator must also be a validator in Avalanche’s primary network. This means each subnet validator generates additional demand for staking AVAX, which should improve value accrual for AVAX as subnet adoption grows.

Related Reading | Terra (LUNA), Quant (QNT) Pull Up As Avalanche (AVAX) Nosedives

At the time of writing, AVAX trades at $94 with sideways movement on the last day.

AVAX with bullish momentum on the daily chart. Source: AVAXUSDT Tradingview