Bitcoin Cash (BCH) Surges 15% As Coinbase Plans Futures Listing

Bitcoin Cash (BCH) has registered a sharp 15% rally in the past 24 hours after plans of a futures listing on Coinbase have surfaced for the asset.

Coinbase Plans To Launch Bitcoin Cash Futures Product On 1 April

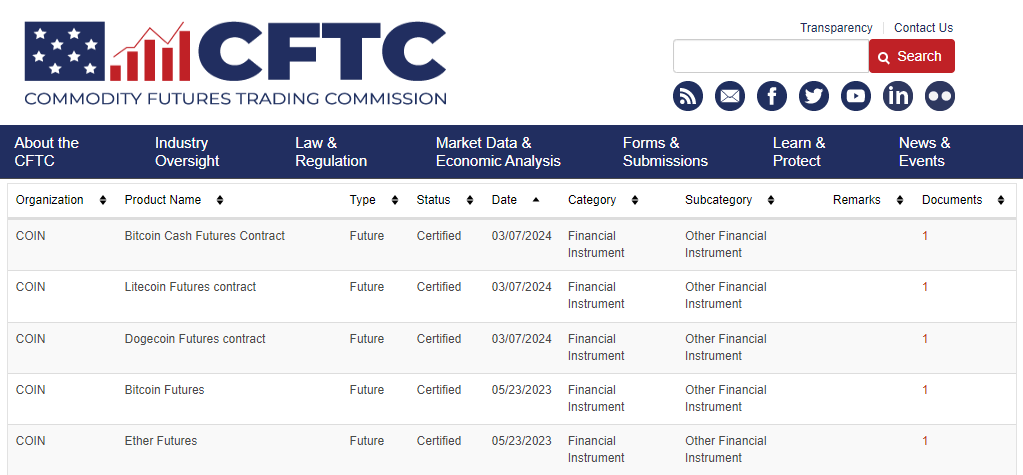
As an X user has pointed out, the cryptocurrency exchange Coinbase appears to have filed certifications with the Commodity Futures Trading Commission (CFTC) to list futures products for three coins on its platform: Bitcoin Cash (BCH), Dogecoin (DOGE), and Litecoin (LTC).

As per the CFTC filing, all of these products were certified on March 7, and they are set to go live on trading on the first of the month.

Bitcoin Cash Futures

Interestingly, all three of these digital assets happen to be based on the original cryptocurrency: Bitcoin. Bloomberg analyst James Seyffart has hinted that this may be why Coinbase has chosen them.

Unlike LTC and DOGE, which are based initially on BTC’s code, BCH is a direct fork of the cryptocurrency made to fulfill BTC’s original purpose as a fast and cheap form of currency that may be used for regular purposes (hence the name).

The filling made by Coinbase on Bitcoin Cash reads:

The market position of Bitcoin Cash reflects its role as an alternative to Bitcoin that prioritizes transaction efficiency. While it has not matched Bitcoin in terms of market capitalization or price, Bitcoin Cash has established itself as a significant player in the cryptocurrency space, with a dedicated user base and ecosystem.

BCH Has Enjoyed A 14% Surge During The Last 24 Hours

The cryptocurrency sector has been up in the past day, but two coins in particular have stood out among the top 20 assets by market cap: Bitcoin Cash and Dogecoin.

Both of these have managed more than 14% returns in this period, notably outperforming their peers. Bitcoin itself has only been able to put together a rally of about 6%.

Given that the Coinbase filling has been making the rounds in this window, it would appear likely that it was at least partially responsible for the extraordinary surges of these coins.

Even though Litecoin is also planned to see its futures contract launch on the same day as the other two, its price performance has been more or less in line with the rest of the market with its profits sitting at just 4%.

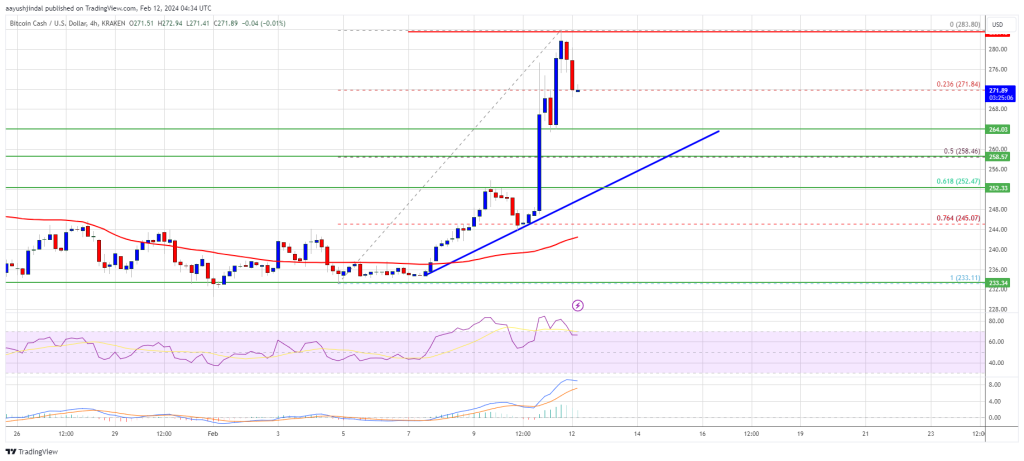
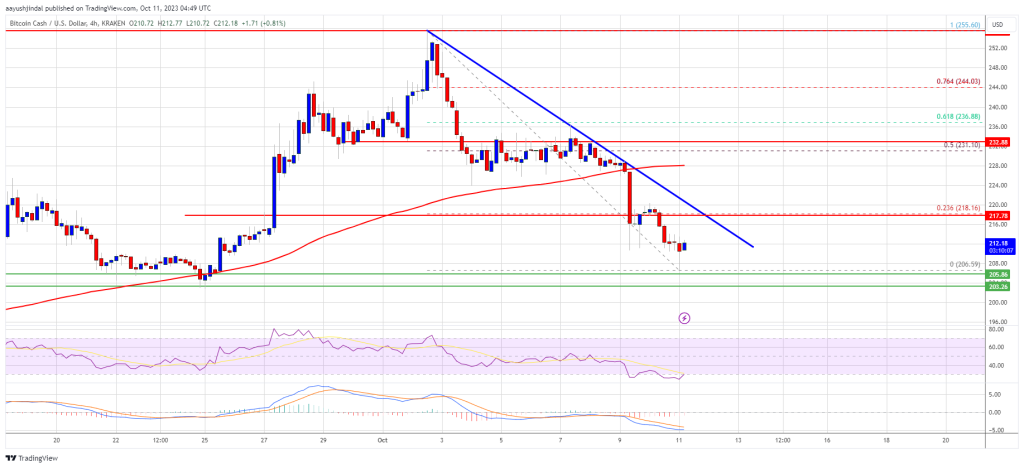
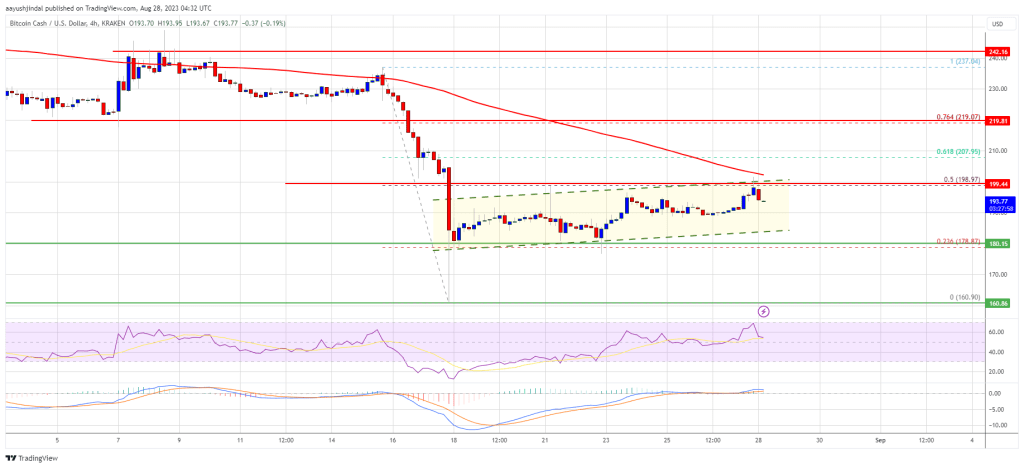
Following the sharp rally, Bitcoin Cash has now arrived at the $424 level. The chart below shows how the cryptocurrency’s trajectory has looked in the last few days.

Bitcoin Cash Price Chart

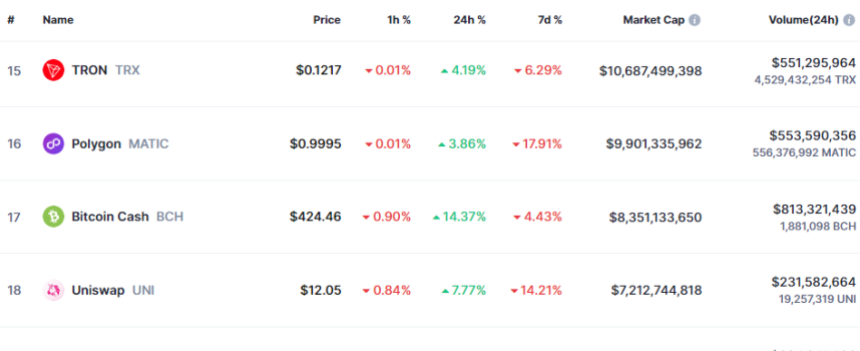
Regarding the market cap, Bitcoin Cash is currently the 17th largest asset. While there is some distance to Polygon (MATIC) in 16th place, LTC may be able to catch it if it can keep up this rally.

Bitcoin Cash Market Cap

Bitcoin Cash Price Solid 15% Gain: Signs Point to Fresh BCH Rally Ahead

Bitcoin Cash price rallied over 15% and broke the $275 resistance. BCH is now facing strong resistance near the $282 zone.

  • Bitcoin cash price started a fresh surge above the $250 resistance.
  • The price is trading above $265 and the 100 simple moving average (4 hours).
  • There is a key bullish trend line forming with support at $258 on the 4-hour chart of the BCH/USD pair (data feed from Kraken).
  • The pair could continue to move up if it clears the $282 resistance zone.

Bitcoin Cash Price Rallies Above $270

After forming a base above the $232 level, Bitcoin Cash price started a steady increase. It broke the $245 resistance to enter a positive zone, like Bitcoin and Ethereum.

There was a strong increase above the $250 and $265 resistance levels. The price gained over 15% and tested the $282 resistance. A high was formed near $283 and the price is now correcting gains. There was a move below the $275 level.

The price tested the 23.6% Fib retracement level of the upward move from the $233 swing low to the $283 high. BCH is now showing positive signs above $260 and the 100 simple moving average (4 hours).

Bitcoin Cash Price

Source: BCH/USD on TradingView.com

There is also a key bullish trend line forming with support at $258 on the 4-hour chart of the BCH/USD pair. If there is another increase, the price might face resistance near $275. To continue higher, the price must settle above $282. The next major resistance is near $292, above which the price might accelerate higher toward the $300 level. Any further gains could lead the price toward the $320 resistance zone.

Fresh Drop in BCH?

If Bitcoin Cash price fails to clear the $275 resistance, it could start a fresh decline. Initial support on the downside is near the $265 level.

The next major support is near the $258 level or the trend line. It is close to the 50% Fib retracement level of the upward move from the $233 swing low to the $283 high, where the bulls are likely to appear. If the price fails to stay above the $258 support, the price could test the $245 support. Any further losses could lead the price toward the $232 zone in the near term.

Technical indicators

4-hour MACD – The MACD for BCH/USD is losing pace in the bullish zone.

4-hour RSI (Relative Strength Index) – The RSI is currently in the overbought zone.

Key Support Levels – $265 and $258.

Key Resistance Levels – $275 and $282.

Bitcoin Cash Price Pumps Over 10% But $255 Is The Key To More Gains

Bitcoin Cash price rallied over 10% and broke the $245 resistance. BCH is now facing strong resistance near the $255 zone.

  • Bitcoin cash price started a fresh surge above the $232 resistance.
  • The price is trading above $245 and the 100 simple moving average (4 hours).
  • There was a break above a key bearish trend line with resistance near $225 on the 4-hour chart of the BCH/USD pair (data feed from Kraken).
  • The pair could continue to move up if it clears the $255 resistance zone.

Bitcoin Cash Price Rallies Above $250

After forming a base above the $220 level, Bitcoin Cash price started a steady increase. It broke the $225 resistance to enter a positive zone, like Bitcoin and Ethereum.

There was a break above a key bearish trend line with resistance near $225 on the 4-hour chart of the BCH/USD pair. There was a strong increase above the $232 and $245 resistance levels. The price is up over 10% and it is now testing the $255 resistance.

BCH is now showing positive signs above $245 and the 100 simple moving average (4 hours). It is also above the 23.6% Fib retracement level of the upward move from the $219 swing low to the $255 high.

Bitcoin Cash Price

Source: BCH/USD on TradingView.com

The price is now struggling to clear the $255 resistance. To continue higher, the price must settle above $255. The next major resistance is near $265, above which the price might accelerate higher toward the $280 level. Any further gains could lead the price toward the $300 resistance zone.

Fresh Drop in BCH?

If Bitcoin Cash price fails to clear the $255 resistance, it could start a fresh decline. Initial support on the downside is near the $245 level.

The next major support is near the $232 level or the 61.8% Fib retracement level of the upward move from the $219 swing low to the $255 high, where the bulls are likely to appear. If the price fails to stay above the $232 support, the price could test the $225 support. Any further losses could lead the price toward the $220 zone in the near term.

Technical indicators

4-hour MACD – The MACD for BCH/USD is gaining pace in the bullish zone.

4-hour RSI (Relative Strength Index) – The RSI is currently in the overbought zone.

Key Support Levels – $245 and $232.

Key Resistance Levels – $255 and $265.

Bitcoin Cash Rally Threatened As Exchange Drops BCH Following XRP Listing Rumors

Bitcoin Cash has followed the general growth trend of Bitcoin with the price almost clearing the $250 resistance before being rejected. Even though BCH maintains this bullish momentum, it is not completely in the clear following its delisting from one crypto exchange.

EDX Markets Delists Bitcoin Cash

In another unexpected blow, Bitcoin Cash (BCH) has been delisted from the EDX Markets crypto exchange. Users had first suspected that the exchange was ending support for BCH and rumors spread like wildfire through social media. Eventually, the crypto exchange will confirm these rumors, with a spokesperson revealing that EDX Markets was indeed no longer offering support for BCH.

Contrary to the norm, EDX Markets did not give any indication of why the cryptocurrency was delisted from the exchange. Rather, users were directed to sign up for the newsletter to get updates about listings, as well as check out the website for supported coins.

Interestingly, this is happening at a time when rumors have been circulating that EDX Markets might be planning to list XRP. This would make sense given that many exchanges have resisted the cryptocurrency after Ripple’s victory over the SEC. Since then, XRP’s volume has been on the high side and crypto exchanges have clamored for a chance to get a piece of the pie.

BCH Price Struggles To HoldOn

Following the rejection from the $250 level, the Bitcoin Cash (BCH) price has been hard-pressed to continue on its previous trajectory. The fall toward the $240 level shook out a good portion of longs before the bulls were able to take over once more.

However, the BCH daily trading volume is still seeing good momentum after rising 36% in one day. If anything, this shows there is still a fair amount of interest in the altcoin with trading garnering a lot of attention from market participants.

The major resistance to a BCH breakout currently lies at the $250 level. If the price is able to clear this resistance, then the rally is expected to continue and could touch $270 before losing steam. But it is still a long way from its yearly high of $300.

At the time of writing, BCH is trading at $243 with 3.75% losses on the weekly chart. However, it is performing much better in the last day after rising 2.23%.

Bitcoin Cash BCH price chart from Tradingview.com

Bitcoin Cash Price Prediction: This Support Could Trigger Fresh BCH Rally

Bitcoin Cash price is holding the key $205 support against the US Dollar. BCH could start a fresh increase if it stays above the $205 and $200 support levels.

  • Bitcoin cash price started a fresh decline below the $230 level against the US Dollar.
  • The price is trading below $220 and the 100 simple moving average (4 hours).
  • There is a key bearish trend line forming with resistance near $217 on the 4-hour chart of the BCH/USD pair (data feed from Kraken).
  • The pair could start a fresh increase unless there is a move below $200.

Bitcoin Cash Price Holds Support

In the past few days, Bitcoin Cash price saw a steady decline from the $255 resistance zone. BCH declined below the $232 support to enter a short-term bearish zone, like Bitcoin and Ethereum.

The bears were able to push the price below the $220 support. Finally, the price found support near the $205 zone (a multi-touch zone). A low has formed near $206.59 and the price is now consolidating losses. It seems like there is a key bearish trend line forming with resistance near $217 on the 4-hour chart of the BCH/USD pair.

Bitcoin Cash is now trading below $220 and the 100 simple moving average (4 hours). Immediate resistance is near the $217 level and the trend line. It is close to the 23.6% Fib retracement level of the downward move from the $255 swing high to the $206 low.

Bitcoin Cash Price Prediction

Source: BCH/USD on TradingView.com

The next major resistance is near $228 or the 100 simple moving average (4 hours). The next major resistance is near the $232 level. It is close to the 50% Fib retracement level of the downward move from the $255 swing high to the $206 low. Any further gains could lead the price toward the $250 resistance zone.

Downside Break in BCH?

If Bitcoin Cash price fails to clear the $217 resistance, it could continue to move down. Initial support on the downside is near the $205 level.

The next major support is near the $200 level, where the bulls are likely to appear. If the price fails to stay above the $200 support, the price could test the $184 support. Any further losses could lead the price toward the $162 zone in the near term.

Technical indicators

4-hour MACD – The MACD for BCH/USD is losing pace in the bearish zone.

4-hour RSI (Relative Strength Index) – The RSI is currently below the 50 level.

Key Support Levels – $205 and $200.

Key Resistance Levels – $217 and $232.

Bitcoin Cash Price Won’t Go Down Quietly – Risk of Bounce Grows

Bitcoin Cash price is holding the key $220 support against the US Dollar. BCH seems to be aiming for a fresh increase unless there is a move below $220.

  • Bitcoin cash price is showing positive signs above the $220 level against the US Dollar.
  • The price is trading above $220 and the 100 simple moving average (4 hours).
  • There was a break below a key bullish trend line with support near $238 on the 4-hour chart of the BCH/USD pair (data feed from Kraken).
  • The pair could start a fresh increase unless there is a move below $220.

Bitcoin Cash Price Holds Support

In the past few days, Bitcoin Cash price saw a steady decline from the $255 resistance zone. BCH declined below the $240 support to enter a short-term bearish zone, like Bitcoin and Ethereum.

The price declined below the 50% Fib retracement level of the upward move from the $203 swing low to the $255 high. Besides, there was a break below a key bullish trend line with support near $238 on the 4-hour chart of the BCH/USD pair.

However, the bulls were active above the $220 support. The price found support near the 61.8% Fib retracement level of the upward move from the $203 swing low to the $255 high.

Bitcoin Cash is now trading above $220 and the 100 simple moving average (4 hours). Immediate resistance is near the $236 level. The next major resistance is near $244. Any further gains could lead the price toward the $250 resistance zone.

Bitcoin Cash Price

Source: BCH/USD on TradingView.com

The next major hurdle is near the $262 level, above which BCH might start a decent increase toward the $280 level or $288 in the coming days.

Downside Break in BCH?

If Bitcoin Cash price fails to clear the $244 resistance, it could start a fresh decline. Initial support on the downside is near the $225 level.

The next major support is near the $220 level, where the bulls are likely to appear. If the price fails to stay above the $220 support, the price could test the $212 support. Any further losses could lead the price toward the $200 zone in the near term.

Technical indicators

4-hour MACD – The MACD for BCH/USD is losing pace in the bullish zone.

4-hour RSI (Relative Strength Index) – The RSI is currently below the 50 level.

Key Support Levels – $225 and $220.

Key Resistance Levels – $236 and $244.

Bitcoin Cash Price Signals Fresh Increase Despite Weakness in BTC and ETH

Bitcoin Cash price is holding the key $180 support against the US Dollar. BCH seems to be aiming for a fresh increase toward the $205 and $220 levels.

  • Bitcoin cash price is showing positive signs above the $180 level against the US Dollar.
  • The price is trading below $200 and the 100 simple moving average (4 hours).
  • There was a break above a major bearish trend line with resistance near $189 on the 4-hour chart of the BCH/USD pair (data feed from Kraken).
  • The pair is likely to accelerate higher if it clears $197 and $200.

Bitcoin Cash Price Aims Higher

In the past few days, Bitcoin Cash price saw a steady decline below $205. BCH even traded below the $195 level, but the downsides were limited compared to Bitcoin and Ethereum.

The price remained well-bid near the key $180 support. A low has formed near $180 and the price is now attempting a fresh increase. It broke the $185 level. There was a break above a major bearish trend line with resistance near $189 on the 4-hour chart of the BCH/USD pair.

The price is now testing the 23.6% Fib retracement level of the downward move from the $238 swing high to the $180 low. However, Bitcoin Cash is now trading below $200 and the 100 simple moving average (4 hours).

Immediate resistance is near the $197 level and the 100 simple moving average (4 hours). The next major resistance is near $205 or the 50% Fib retracement level of the downward move from the $238 swing high to the $180 low.

Bitcoin Cash Price

Source: BCH/USD on TradingView.com

Any further gains could lead the price toward the $220 and $225 resistance levels in the near term. The next major hurdle is near the $240 level.

Dips Supported in BCH?

If Bitcoin Cash price fails to clear the $205 resistance, it could start a fresh decline. Initial support on the downside is near the $185 level.

The next major support is near the $180 level, where the bulls are likely to appear. If the price fails to stay above the $180 support, the price could test the $168 support. Any further losses could lead the price toward the $150 zone in the near term.

Technical indicators

4-hour MACD – The MACD for BCH/USD is gaining pace in the bullish zone.

4-hour RSI (Relative Strength Index) – The RSI is currently above the 50 level.

Key Support Levels – $185 and $180.

Key Resistance Levels – $197 and $205.

Bitcoin Cash Traders Move Into Profit, But Can The Rally Continue?

As the price of Bitcoin and the general crypto market has rallied, leading to a much-needed increase in price, Bitcoin Cash (BCH) investors are once again on a profitable path. The majority of investors are now in the green following its double-digit surge in the last week. But now the question posed is, will the price of BCH continue to maintain this surge?

Bitcoin Cash Short And Long-Term Holders Enjoy Profits

In a Thursday post, on-chain data tracking platform Santiment revealed that both short and long-term holders of Bitcoin Cash are doing quite well right now. The chart shared by the tracker showed that the average returns for 30-day and 365-day holders have risen above their average cost price.

This means that investors who got into the digital asset in the last month, as well as those who have been holding for a year, are the ones doing well right now. It is also the first time in 10 weeks that this cohort of BCH investors is seeing profit.

Santiment BCH

The data from Santiment is also backed up by that from another on-chain tracker IntoTheBlock. According to the latter’s data on its website, 59% of all BCH investors are seeing green compared to 38% sitting in the red and 3% in neutral territory. Furthermore, IntoTheBlock shows that 96% of holders have held for more than one year, with 3% holding between 1-12 months, and 1% holding for less than one month.

Combining the data from both trackers tells us that there are more long-term investors in profit compared to short-term investors. This fact reinforces the long-standing belief that buying and holding is usually the best way to invest in cryptocurrencies.

But Can BCH Hold Its Gains?

The fact that so many short and long-term holders are currently in profit can be attributed to the digital asset’s spike in the last week. Following the Grayscale ruling that saw the market surge, BCH’s price rose over 14%, bringing its value to the $220 level before the retracement. Most of these gains have been sustained so far, as evidenced by the high percentage of holders in profit.

However, Santiment points out in its report that for Bitcoin Cash to continue to rise, it would be up to the whales. This is because, during the price spike, there was an increase in whale activity in relation to the BCH token. So they likely played a part in the asset’s rise.

If the whales continue to be active and put buying pressure on the coin, then the price of BCH could continue to appreciate. However, a turn from buy to sell among these large holders would quickly crash the price, especially since the market is already feeling the euphoria felt earlier this week start to recede.

Presently, data from Coinmarketcap shows that Bitcoin Cash is trading at $219, a 14.57% increase in the last week.

Bitcoin Cash price chart from Tradingview.com

Bitcoin Cash Price Could Restart Increase To $250 If It Breaks This Resistance

Bitcoin Cash price recovered from the $160 zone against the US Dollar. BCH might aim a fresh rally toward the $240 and $250 levels.

  • Bitcoin cash price is consolidating above the $180 level against the US Dollar.
  • The price is trading below $200 and the 100 simple moving average (4 hours).
  • There is a key rising channel forming with resistance near $200 on the 4-hour chart of the BCH/USD pair (data feed from Kraken).
  • The pair is likely to accelerate higher if it clears $195 and $200.

Bitcoin Cash Price Prepares For The Next Move

After a strong decline, Bitcoin Cash price found support near the $160 level. BCH traded as low as $160.90 and recently started a recovery wave, like Bitcoin and Ethereum.

The price climbed above the $175 and $180 resistance levels. There was a break above the 23.6% Fib retracement level of the downward move from the $237 swing high to the $160 low. The price is now trading in a range above the $190 level.

Bitcoin Cash is now trading below $200 and the 100 simple moving average (4 hours). There is also a key rising channel forming with resistance near $200 on the 4-hour chart of the BCH/USD pair.

Immediate resistance is near the $200 level, the channel zone, and the 100 simple moving average (4 hours). The next major resistance is near $220 or the 76.4% Fib retracement level of the downward move from the $237 swing high to the $160 low.

Bitcoin Cash Price

Source: BCH/USD on TradingView.com

Any further gains could lead the price toward the $240 and $250 resistance levels in the near term. The next major hurdle is near the $265 level.

Dips Supported in BCH?

If Bitcoin Cash price fails to clear the $200 resistance, it could start a fresh decline. Initial support on the downside is near the $185 level.

The next major support is near the $180 level, where the bulls are likely to appear. If the price fails to stay above the $180 support, the price could test the $170 support. Any further losses could lead the price toward the $160 zone in the near term.

Technical indicators

4-hour MACD – The MACD for BCH/USD is losing pace in the bullish zone.

4-hour RSI (Relative Strength Index) – The RSI is currently above the 50 level.

Key Support Levels – $185 and $180.

Key Resistance Levels – $200 and $220.

The Inside Story Of The Roger Ver Vs. CoinFLEX Conflict

The infamous Roger Ver is back in the headlines for all the wrong reasons. Like many players in the industry, the derivatives exchange CoinFLEX recently ran into financial trouble. Surprisingly, they blamed it all on Roger Ver and the circus started. Luckily for us, Chinese journalist Colin Wu covered “the entire insider details through a source close to the situation” in his newsletter. However, as you can see, it’s an anonymous source. So, take the story we’re about to analyze with a grain of salt. 

The summary of the situation according to Wu:

“On June 24, 2022, the exchange CoinFLEX announced that it made the decision to halt user withdraws, and the price of the platform Token FLEX subsequently plummeted, from $4.30 to less than $1.50 in four hours. At the same time, FlexUSD, the platform’s stablecoin, also began to de-peg, with prices dropping as low as $0.23.”

The funny thing is that both entities were clearly in business together. On May 14th, Roger Ver tweeted, “Interest paying FlexUSD by CoinFLEX  is on its way to being the default stable coin for the whole SmartBCH ecosystem if USDT & USDC don’t move quickly.” How did everything deteriorate so fast? That’s what this article’s about. 

Roger Ver Vs. CoinFLEX, The Play By Play

The story starts with CoinFLEX announcing to their partners that they “opened a special account for Roger Ver.” The account’s characteristics guaranteed that Roger Ver “would not be liquidated immediately if it fell below the maintenance margin, but rather that he would be given sufficient time to make a margin call.” Nothing special here, the man is a high-net-worth individual, deals like this are a dime a dozen in high finance. 

As a guarantee, Roger Ver offered “a margin of BCH,” valued “at around $400.” Then, the Terra collapse happened and the whole crypto market crashed. By the time CoinFLEX ”faced a liquidity crisis,” Bitcoin Cash was worth around $120. It’s still at that price range at the time of writing. This is where things get insane. The biggest revelation of Wu’s story is at the end of this paragraph.

“If that were all, CoinFLEX would have been able to cover its shortfall. However, prior to this, CoinFLEX had issued its own stablecoin, FlexUSD, like other exchanges. At this point, CoinFLEX used FlexUSD to buy a large amount of FLEX from the secondary market and opened short position to hedge the spot price. However, the counterparty to this short position was also Roger Ver!”

As we’ve seen happen again and again, “when the withdrawal restriction announcement was made, CoinFLEX’s total funds began to fall in a cyclical fashion.” And all hell broke loose. 

BCH price chart on Coinbase | Source: BCH/USD on TradingView.com
An All-Out Twitter War

On June 27th, the company’s CEO Mark Lamb tweeted, “CoinFLEX made the decision to halt user withdrawals on June 23, shortly after a long-time customer of CoinFLEX went into negative equity. ” Immediately after, the rumor that Roger Ver was that “long-time customer” began circulating.

The Bitcoin Cash leader went on the offensive and tweeted a statement obviously written by a lawyer. “Recently some rumors have been spreading that I have defaulted on a debt to a counter-party. These rumors are false. Not only do I not have a debt to this counter-party, but this counter-party owes me a substantial sum of money, and I am currently seeking the return of my funds.” How could those two statements be true? Remember that “the counterparty to this short position was also Roger Ver!”

However, Mark Lamb was not having it. Even though both parties were negotiating, Lamb took to Twitter and stated, “CoinFLEX also categorically denies that we have any debts owing to him.” Plus, “Roger Ver owes CoinFLEX $47 Million USDC. We have a written contract with him obligating him to personally guarantee any negative equity on his CoinFLEX account and top up margin regularly.”

Even if CoinFLEX is right in this instance, did they have to air their dirty laundry in public?

Roger Ver Vs. CoinFLEX, The Aftermath

Back to Colin Wu’s newsletter:

“In the end, Roger Ver’s position was completely worn out and turned into negative equity, while CoinFLEX was left with a lot of delisting FLEX. It was revealed that CoinFLEX had a real loss of $120 million, including losses from the de-peg of the stablecoin FlexUSD and the loss of withdrawals (less than $10 million) due to the collapse of the SmartBCH cross-chain bridge, which was built by CoinFLEX.”

And the fact of the matter is that, even if Roger Ver’s debt caused this, CoinFLEX’s risk management team has a few questions to answer. “Roger Ver became almost the only counterparty to the exchange, and this only counterparty had the privilege of not replenishing the margin in time,” Wu concludes. It was an unfortunate sequence of events, but both parties signed those deals and both parties took to Twitter to resolve what should’ve been a private matter. 

Shame all around.

Featured Image by Gerd Altmann from Pixabay | Charts by TradingView